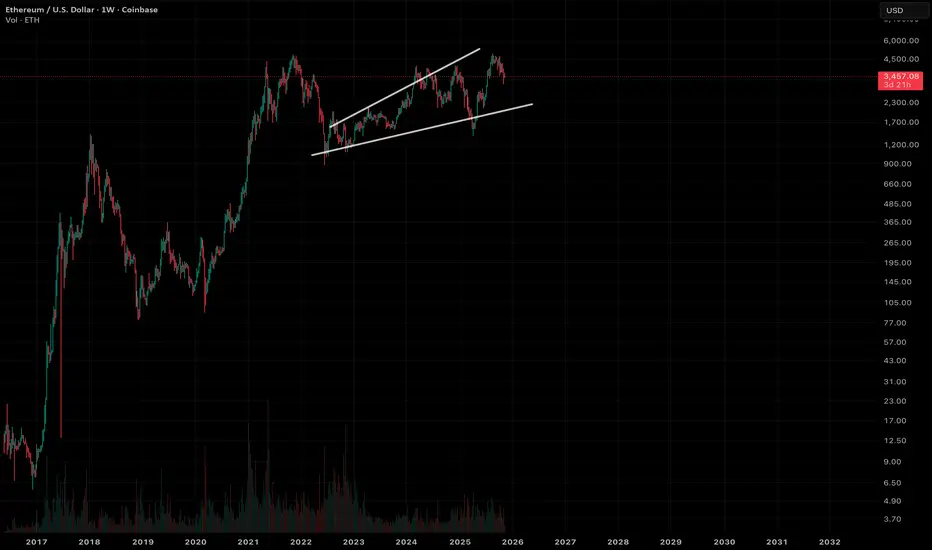
eth dip incomingwith simple analysis you can see eth started a bullish channel back in 2022 every time we touch the top of the red trend line we see a reversal. so i will expect to see eth retrace to the green support line and bottom of channel where we could expect 1800.00 to 1500.00 then continue up after a test of support. if we start to see a reversal we well likely create a inverted head and shoulders and will invalidate the trend only time will show us hints of direction .until i see a clear trend change i will remain bear.
Market insights

Dalai Llama - Oh YeahOh yeah its Dalai Llama time. We must summon the dalai llama, but only to thank him for running this bad boy back turbo. Bottoms in send it to Valhalla for the reasons in all my recent posts.

Global Soft Commodity Trading1. What Are Soft Commodities?
Soft commodities are agricultural goods used for food, textiles, beverages, and biofuels. They are classified into several broad segments:
a) Grains and Cereals
Wheat
Corn (maize)
Rice
Barley
These form the backbone of global food security and are traded extensively via futures contracts.
b) Oilseeds and Edible Oils
Soybeans
Palm oil
Sunflower oil
Rapeseed
These commodities are vital for cooking oil, animal feed, and industrial applications.
c) Tropical Products
Coffee
Cocoa
Sugar
Spices
Produced mostly in tropical regions, they are influenced by regional climate and weather events like El Niño and La Niña.
d) Fiber Commodities
Cotton
Rubber
Jute
Used primarily in textiles, manufacturing, and industrial processes.
e) Livestock and Dairy
Cattle
Hogs
Milk derivatives
These are essential for the food processing and meat industries.
2. Structure of Global Soft Commodity Trading
Soft commodity trading operates through two primary channels:
a) Physical (Spot) Trading
Involves buying and selling the actual agricultural product.
Participants include:
Farmers and cooperatives
Exporters and importers
Commodity merchants (e.g., Cargill, ADM, Bunge)
Food processing companies
Textile manufacturers
Physical trading focuses on logistics, shipping, storage, warehousing, and quality inspection.
b) Derivatives Trading
Soft commodities are widely traded on futures exchanges such as:
Chicago Board of Trade (CBOT)
Intercontinental Exchange (ICE)
NYMEX
Dalian Commodity Exchange (DCE)
Multi Commodity Exchange (MCX India)
Derivatives allow traders, corporations, and governments to hedge price risks or speculate on future price movements.
3. Key Players in the Soft Commodity Market
a) Producers
Countries in Latin America, Africa, India, China, and Southeast Asia dominate production. For example:
Brazil: coffee, soybeans, sugar
Ivory Coast & Ghana: cocoa
India: cotton, sugar, spices, wheat
China: soybeans, rice
b) Traders and Merchants
Large multinational firms manage procurement, logistics, and distribution networks.
c) Commodity Exchanges
Provide transparent pricing and risk-management tools for global participants.
d) Financial Institutions
Banks, hedge funds, and investment firms trade soft commodities for portfolio diversification and speculation.
e) End-Users
Food manufacturers, textile mills, beverage companies, and energy producers rely on stable supply.
4. Factors Influencing Soft Commodity Prices
Soft commodities are highly volatile because they depend on natural events and global economic fluctuations. Major price-moving factors include:
a) Weather and Climate
Extreme weather—droughts, floods, cyclones—can sharply reduce production.
Events like El Niño often disrupt supply chains worldwide.
b) Seasonal Cycles
Planting and harvesting seasons create predictable demand and supply patterns.
c) Geopolitics
Trade restrictions, sanctions, export bans, and conflict zones (like in the Black Sea region) significantly influence grain and oilseed prices.
d) Currency Movements
Most commodities are priced in USD, so a stronger dollar makes them more expensive for importing nations.
e) Supply Chain Disruptions
Port delays, shipping shortages, or logistical failures create shortages.
f) Global Demand Trends
Rising middle-class consumption boosts demand for:
Protein (livestock feed demand increases soy and corn usage)
Coffee and cocoa
Biofuels (palm oil, corn ethanol, sugar ethanol)
g) Government Policies
Minimum support prices, export taxes, and subsidies influence domestic and global markets.
5. Trading Strategies in Soft Commodities
Soft commodity traders use multiple strategies in derivatives and physical markets:
a) Hedging
Producers lock in prices to protect against volatility.
Example: a coffee farmer hedges future production by selling coffee futures.
b) Arbitrage
Traders exploit price differences:
Between markets (inter-market arbitrage)
Between expiration months (calendar spreads)
Between commodity grades (quality spreads)
c) Speculation
Traders take directional bets on future price movements based on:
Weather forecasts
Supply-demand data
Economic indicators
d) Spread Trading
Buying and selling correlated commodities:
Corn vs. wheat
Soybeans vs. soybean oil
e) Algorithmic and High-Frequency Trading
Increasingly used for short-term price anomalies.
6. Importance of Soft Commodity Trading in the Global Economy
a) Food Security and Stability
Soft commodities ensure availability of food grains and edible oils.
Their pricing impacts inflation, especially in developing countries.
b) Industrial and Manufacturing Input
Cotton, rubber, and other fibers support the textile and automotive sectors.
c) Employment Generation
Millions of farmers, traders, and logistics workers depend on agriculture.
d) Global Trade Balances
Major exporters—Brazil, Argentina, India, US—earn significant foreign exchange through soft commodity exports.
e) Price Discovery
Futures markets provide transparent global benchmarks that help governments and industries plan production and inventory.
7. Emerging Trends in Soft Commodity Trading
a) Sustainable and Ethical Sourcing
Consumers demand ethically sourced coffee, cocoa, and palm oil.
Traceability and ESG compliance are becoming mandatory.
b) Digital Farming and Smart Agriculture
Technologies like:
AI-based weather prediction
Drones and satellite imaging
Precision farming
These improve crop quality and supply forecasting.
c) Climate-Resilient Commodities
Investment is rising in drought-resistant seeds, alternative proteins, and regenerative agriculture.
d) Rise of Biofuels
Biofuel policies increase demand for:
Corn (ethanol)
Sugarcane (ethanol)
Soy/palm oil (biodiesel)
e) E-Trading Platforms
Digital trade platforms reduce intermediaries and streamline global trade.
8. Challenges in Soft Commodity Trading
a) High Volatility
Weather and geopolitics create unpredictable price swings.
b) Supply Chain Complexities
Quality inconsistencies, delays, and transportation losses can impact pricing.
c) Regulatory Changes
Sudden export bans (as seen with wheat, sugar, or rice) disrupt global markets.
d) Climate Change
Rising temperatures threaten yields and increase production risks.
e) Financial Constraints for Farmers
Small farmers in developing nations lack access to credit and hedging tools.
Conclusion
Global soft commodity trading plays a vital role in ensuring global food availability, supporting manufacturing industries, and stabilizing economic systems. It connects farmers to international markets, provides effective price discovery mechanisms, and helps manage risk through futures trading. However, the market is highly sensitive to weather, geopolitics, and global economic shifts.
With rising concerns around sustainability, digital transformation, and climate impacts, soft commodity trading is evolving rapidly. Countries and corporations that adapt to these changes—through better risk management, technology adoption, and sustainable practices—will shape the future of global agricultural trade.

Inverse HnSImagine if CRYPTOCAP:ETH inverse Head and Shoulder plays out.
This would be a good 2026 for CRYPTOCAP:ETH

RSI Never Lies🧠 RSI Never Lies
I believe the RSI indicator, especially on the daily timeframe, is the most powerful signal in the market.
Since the moment I noticed the bearish divergence on Ethereum, the price has dropped over 15%, even touching $3500.
I didn’t do anything special — I’m no fortune teller.
I just listened to my dear friend, RSI.
Now RSI is around 40 on the daily chart, which clearly suggests that the downtrend may continue.
#ETH #Ethereum #RSI #TechnicalAnalysis #TradingView #RMBS

ETHUSD long trade activated In my opinion EThUSD has a great potential to benefit from the seasonal trend in November and December, when compared to Bitcoin on ETHBTC chart it also show momentum.
The daily and weekly trends are also strong so a reverseal is the most probable move here.
The stoploss and targets are showed in the chart.

$ETH following my macro planCRYPTOCAP:ETH is following my macro plan. I shorted it on the retest with a stoploss slightly above the highest wick of previous week. This was a simple 13% so far. This is why I like high time frame trading it shows you more than just noise on short timeframe charts.
ETH LONG 🟢 Entry : 3300$ - 3360$
🎯 Targets :
1) 3370$
2) 3450$
3) 3550$
4) 3700$+
🔴 Stop : Blw 3180$

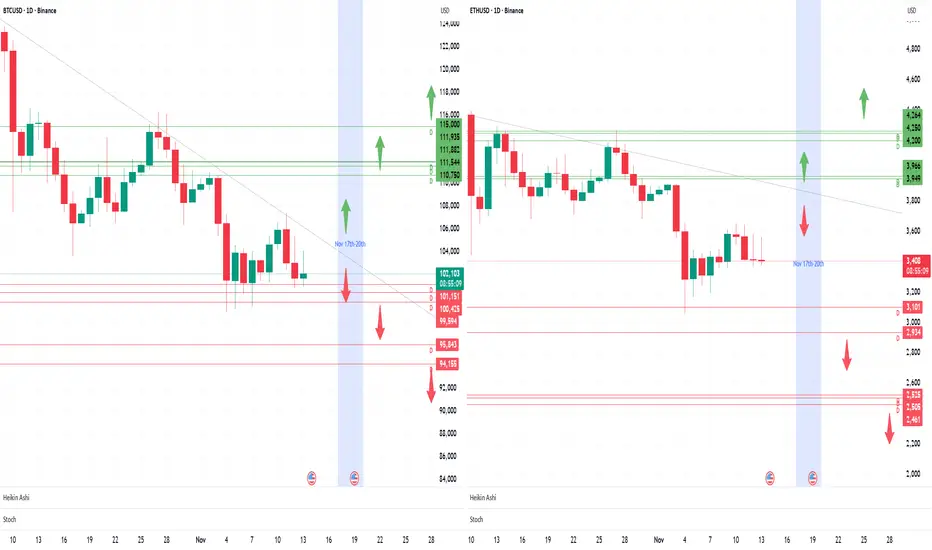
BTC ETH It's Decision Time!BTC ETH should be deciding which direction to move to by next week.
We need DAILY CLOSINGS above green resistance and Downtrend Line OR below red support to confirm in which direction it will move to next.
The odds are that it's a BREAKOUT back to ATH with ETH, perhaps, maybe, blasting higher into January.
BTC might not blast too much higher just yet.
If the price does not breakout of the Downtrend Line rather quick, things could turn really ugly again next week.
ETHUSD: Caught in a Downtrend Triangle Below Key Targets📉 ETHUSD: Caught in a Downtrend Triangle Below Key Targets – What's Next for Ethereum?
Timeframe: 4-Hour Chart
Ethereum (ETHUSD) is currently trading around $3,440. The price is showing clear signs of bearish pressure, trapped within a developing pattern after failing to sustain higher levels.
Current Price Action & Trend Analysis:
Ethereum has been in a sustained downtrend since hitting peaks in late October, marked by a series of lower highs. The most recent attempt at a recovery was firmly rejected at the 3700 'Upside 1st Target' zone around November 10th-11th. Since this rejection, ETHUSD has been consolidating, largely operating below a prominent red descending trendline that acts as dynamic resistance.
The price is currently hovering around the 3350 'Deciding Area', which appears to be acting as immediate support. However, repeated rejections from the descending trendline (forming a potential descending triangle or wedge pattern) highlight the persistent selling pressure. While the price has found temporary bounces from this 'Deciding Area', the inability to break the overhead trendline suggests continued weakness.
Key Resistance Levels:
Descending Red Trendline: This dynamic trendline, currently just above the 3500 mark, is the most immediate obstacle for any bullish recovery. A breakout above this would be the first hint of shifting momentum.
3700 Upside 1st Target: This was the recent high point before the current leg down and represents a significant resistance level that bulls need to overcome to regain conviction.
3850 to 3950 1st Key Resistance & 4085: These higher resistance zones are currently out of immediate reach but remain significant hurdles for a broader trend reversal.
4200 to 4300 Strong Resistance: This major overhead resistance marks the area of the previous peak and would require a substantial bullish impulse to challenge.
Key Support Levels:
3350 Deciding Area: This grey zone is acting as immediate support. Sustained trading below this area would be a clear bearish signal.
3200 Downside 1st Target: Should the 'Deciding Area' fail to hold, the chart identifies 3200 as the 'Downside 1st Target'. This level could attract buyers but also represents a critical breakdown point.
3000 Key Support Level: This strong psychological and technical support level would come into play if 3200 is breached. It represents a last line of defense for the broader mid-term bullish structure.
Bullish Scenario:
For Ethereum to turn bullish in the short term, it needs to decisively break above the descending red trendline and then firmly reclaim the 3700 'Upside 1st Target' with strong volume. This would invalidate the current bearish pattern and suggest a potential move towards higher resistance levels.
Bearish Scenario:
The prevailing bearish sentiment suggests a higher probability of continued downward movement. Failure to break the descending trendline and a decisive break below the 3350 'Deciding Area' would likely open the path to test the 3200 'Downside 1st Target'. A breach of 3200 could lead to a rapid descent towards the 3000 'Key Support Level'.
Conclusion:
Ethereum is currently at a critical juncture, struggling under a bearish trendline and clinging to the 3350 'Deciding Area' support. The immediate future for ETHUSD hinges on whether it can break out of this descending formation to the upside, or if continued selling pressure will push it towards the 3200 and 3000 support levels. Traders should watch for a clear break from the current consolidation pattern to confirm the next directional move.
Disclaimer:
The information provided in this chart is for educational and informational purposes only and should not be considered as investment advice. Trading and investing involve substantial risk and are not suitable for every investor. You should carefully consider your financial situation and consult with a financial advisor before making any investment decisions. The creator of this chart does not guarantee any specific outcome or profit and is not responsible for any losses incurred as a result of using this information. Past performance is not indicative of future results. Use this information at your own risk. This chart has been created for my own improvement in Trading and Investment Analysis. Please do your own analysis before any investments.

ETH PERPETUAL TRADE SELL SETUP Short from $3505ETH PERPETUAL TRADE
SELL SETUP
Short from $3505
Currently $3505
Targeting $3452 or Down
(Trading plan IF ETH
go up to $3570 will add more shorts)
Follow the notes for updates
In the event of an early exit,
this analysis will be updated.
Its not a Financial advice

13.11 ETH UPEarly sellers will be happy to give their money in the 3900-4700 range to the big boys who will take profits there.

Potential bullish rise?Ethereum (ETH/USD) has bounced off the pivot, which is an overlap support, and could rise toward the first resistance, a pullback resistance level that aligns with the 61.8% Fibonacci retracement.
Pivot: 3,439.63
1st Support: 3,194.116
1st Resistance: 3,756.58
Disclaimer:
The opinions given above constitute general market commentary and do not constitute the opinion or advice of IC Markets or any form of personal or investment advice.
Any opinions, news, research, analyses, prices, other information, or links to third-party sites contained on this website are provided on an "as-is" basis, are intended to be informative only, and are not advice, a recommendation, research, a record of our trading prices, an offer of, or solicitation for, a transaction in any financial instrument and thus should not be treated as such. The information provided does not involve any specific investment objectives, financial situation, or needs of any specific person who may receive it. Please be aware that past performance is not a reliable indicator of future performance and/or results. Past performance or forward-looking scenarios based upon the reasonable beliefs of the third-party provider are not a guarantee of future performance. Actual results may differ materially from those anticipated in forward-looking or past performance statements. IC Markets makes no representation or warranty and assumes no liability as to the accuracy or completeness of the information provided, nor any loss arising from any investment based on a recommendation, forecast, or any information supplied by any third party.

ESG Investing and Sustainable Finance1. Understanding ESG Investing
ESG stands for Environmental, Social, and Governance — the three key pillars used to evaluate the sustainability and ethical impact of an investment.
Environmental (E):
This pillar examines how a company manages its environmental responsibilities. Factors include carbon emissions, energy efficiency, waste management, pollution control, renewable energy use, and climate change mitigation strategies.
Example: Companies that reduce greenhouse gas emissions or invest in renewable energy are seen as environmentally responsible.
Importance: Investors assess environmental performance to gauge how well a company can manage climate-related risks and comply with emerging environmental regulations.
Social (S):
This component focuses on how a company interacts with people — employees, customers, suppliers, and communities. It includes labor practices, employee welfare, diversity and inclusion, human rights, product safety, and community engagement.
Example: Firms that promote gender equality, maintain fair wages, or engage in ethical supply chains demonstrate strong social values.
Importance: Socially responsible companies tend to attract loyal customers, maintain a motivated workforce, and avoid reputational risks.
Governance (G):
Governance deals with corporate leadership, internal controls, and shareholder rights. It assesses board diversity, executive pay, ethical business conduct, transparency, and anti-corruption policies.
Example: Companies with independent boards, fair executive compensation, and transparent reporting systems score high in governance.
Importance: Good governance reduces the likelihood of fraud, mismanagement, and unethical behavior — ensuring long-term stability.
In ESG investing, these three dimensions help investors identify organizations that are not only financially sound but also sustainable and ethical in their operations.
2. The Rise of ESG Investing
ESG investing has evolved from a niche concept to a global mainstream movement. Several factors have contributed to this shift:
Investor Awareness:
Modern investors, particularly millennials and Gen Z, are increasingly motivated by values. They prefer to invest in companies that align with their ethical and environmental beliefs.
Regulatory Push:
Governments and international bodies are promoting ESG standards. For example, the European Union introduced the Sustainable Finance Disclosure Regulation (SFDR), and India’s Business Responsibility and Sustainability Report (BRSR) mandates ESG disclosures for top-listed companies.
Corporate Accountability:
Global corporations are under growing pressure to adopt ESG frameworks, not only to attract investors but also to secure long-term sustainability and brand credibility.
Risk Management:
ESG factors are now recognized as essential to identifying long-term risks such as environmental disasters, regulatory changes, or social unrest that could affect business performance.
According to data from the Global Sustainable Investment Alliance (GSIA), ESG-related investments surpassed $35 trillion globally by 2023, representing about one-third of all professionally managed assets.
3. The Concept of Sustainable Finance
While ESG investing focuses on evaluating company performance using sustainability metrics, sustainable finance refers to the broader financial system that supports sustainable development.
Sustainable finance integrates environmental, social, and governance considerations into all aspects of financial decision-making — including banking, insurance, and capital markets. It aims to channel capital toward projects and companies that contribute positively to society and the planet.
Key components of sustainable finance include:
Green Finance:
This focuses on funding environmentally friendly projects — such as renewable energy, energy-efficient infrastructure, sustainable agriculture, or water conservation.
Example: Green bonds are debt instruments used to finance environmental projects.
Social Finance:
This supports initiatives that improve social well-being — such as affordable housing, education, healthcare, or employment generation.
Climate Finance:
A subcategory of sustainable finance, it targets investments that mitigate or adapt to climate change. This includes funding clean technologies and climate-resilient infrastructure.
Impact Investing:
This approach seeks measurable positive social and environmental outcomes alongside financial returns. Investors directly fund projects or enterprises that deliver tangible societal benefits.
4. Interconnection Between ESG Investing and Sustainable Finance
ESG investing is a subset of sustainable finance. While ESG focuses on assessing companies through sustainability metrics, sustainable finance provides the financial infrastructure — such as green bonds, sustainability-linked loans, and climate funds — to support those ESG-driven companies and initiatives.
In other words:
ESG provides the criteria for evaluation.
Sustainable finance provides the capital for transformation.
Together, they form a comprehensive ecosystem where financial decisions contribute to a greener, fairer, and more transparent global economy.
5. Benefits of ESG Investing and Sustainable Finance
Long-Term Value Creation:
ESG-aligned companies tend to perform better in the long run due to better risk management, innovation, and adaptability.
Lower Risk Exposure:
Firms adhering to ESG standards are less likely to face regulatory fines, lawsuits, or reputational damage.
Improved Access to Capital:
Sustainable companies attract more investors, as many institutional funds now mandate ESG compliance.
Enhanced Reputation and Brand Loyalty:
Consumers increasingly support ethical and eco-conscious brands, boosting market share.
Positive Societal Impact:
Capital is directed toward solving global issues like climate change, poverty, and inequality, leading to inclusive growth.
6. Challenges in ESG and Sustainable Finance
Despite its growth, ESG investing faces several obstacles:
Lack of Standardization:
Different rating agencies use varying ESG criteria, leading to inconsistent evaluations of the same company.
Greenwashing:
Some companies falsely claim to be sustainable to attract investors — a practice known as “greenwashing.”
Data Limitations:
Reliable and comparable ESG data is scarce, especially in emerging markets.
Short-Term Market Pressures:
Investors often prioritize quarterly profits over long-term sustainability goals.
High Implementation Costs:
Transitioning to sustainable practices can be expensive, particularly for small and medium enterprises (SMEs).
7. Global and Indian Perspective
Globally, regions like Europe and North America lead in ESG adoption, with institutional investors such as BlackRock and Vanguard emphasizing sustainability mandates. The United Nations Principles for Responsible Investment (UN PRI) and the Paris Agreement have further driven ESG integration into the financial system.
In India, ESG and sustainable finance are gaining momentum:
SEBI (Securities and Exchange Board of India) has made ESG reporting mandatory for the top 1,000 listed companies under the BRSR framework.
The Reserve Bank of India (RBI) has initiated policies supporting green and social financing.
Indian banks like SBI and HDFC are issuing green bonds to finance renewable energy and social projects.
This marks a clear shift in India’s investment culture — aligning financial growth with sustainability.
8. The Future of ESG and Sustainable Finance
The future of finance lies in sustainability-driven innovation. Artificial intelligence, big data, and blockchain are being used to enhance ESG data transparency and traceability. Governments are introducing carbon pricing, taxonomy regulations, and sustainability-linked incentives to encourage responsible investing.
As climate risks and social inequalities intensify, ESG and sustainable finance will continue to evolve — not as alternatives but as the new standard of global financial practice.
Conclusion
ESG investing and sustainable finance represent more than just financial trends — they are part of a paradigm shift in how societies view growth and prosperity. They align economic success with social well-being and environmental preservation. By integrating sustainability into financial systems, investors and institutions are not only securing returns but also shaping a resilient, equitable, and sustainable future for generations to come.
In essence, profit and purpose are no longer opposites — they are partners in the global mission toward sustainable development.

ETH - 3 Hours Chart Opinions?🧠 Keep it on watch. Momentum shifting.
⚠️ Disclosures :
This analysis is for informational purposes only and is not financial advice. It does not constitute a recommendation to buy, sell, or trade any securities, cryptocurrencies, or stocks. Trading involves significant risk, and you should consult with a qualified financial advisor before making any investment decisions. Past performance is not indicative of future results.

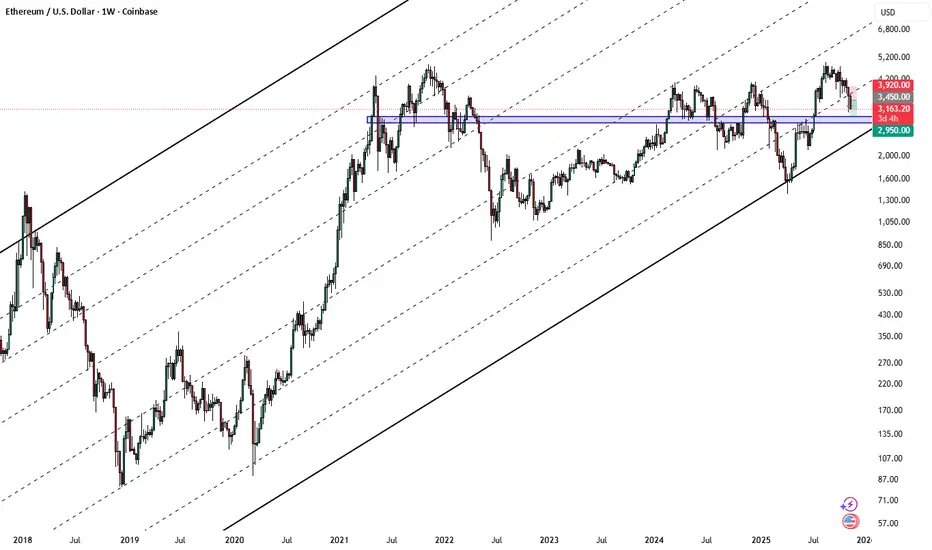
Dalai Llama Livermore Accumulation Cylinder - Bear Hunting TimeGentlemen and Of Course The Ladies,
The state of affairs are that the homies have been carried out on a stretcher on the long side. Big guys, smart guys, right guys, and you know the wrong and longest guys.
But when you zoom out……
We’ve slapped all time highs in a 5 year Livermore accumulation cylinder breaking out above all time highs into a confirmation of an ascending triangle of a similar magnitude.
The forced liquidations enabled the largest buyers to accumulate the most inventory at the lowest cost as fast as possible.
Time to run it back turbo above all time high and then to $8500 by Jan 15th.
ETHUSD rising wedge forming?The ETHUSD remains in a neutral trend, with recent price action showing signs of an oversold rally within the broader range trading.
Support Zone: 3,365 – a key level from previous consolidation. Price is currently testing or approaching this level.
A bullish rebound from 3,365 would confirm ongoing upside momentum, with potential targets at:
3,940 – initial resistance
4,064 – psychological and structural level
4,200 – extended resistance on the longer-term chart
Bearish Scenario:
A confirmed break and daily close below 3,365 would weaken the bullish outlook and suggest deeper downside risk toward:
3,200 – minor support
3,055 – stronger support and potential demand zone
Outlook:
Bullish bias remains intact while the ETHUSD holds above 3,940 A sustained break below this level could shift momentum to the downside in the short term.
This communication is for informational purposes only and should not be viewed as any form of recommendation as to a particular course of action or as investment advice. It is not intended as an offer or solicitation for the purchase or sale of any financial instrument or as an official confirmation of any transaction. Opinions, estimates and assumptions expressed herein are made as of the date of this communication and are subject to change without notice. This communication has been prepared based upon information, including market prices, data and other information, believed to be reliable; however, Trade Nation does not warrant its completeness or accuracy. All market prices and market data contained in or attached to this communication are indicative and subject to change without notice.

Ethereum Whales Buy $900M Despite Bearish SignalsEthereum’s price hovers near $3,445, showing short-term strength even as bearish crossovers loom. The 50-day EMA is close to slipping under the 100-day EMA, and the 20-day EMA is nearing the 200-day, both warning of momentum loss.
Yet, whales appear unfazed — wallets holding large ETH sums added nearly $900 million in just two days, raising holdings from 101.44M to 101.70M ETH. This steady buying suggests confidence in Ethereum’s long-term setup.
The RSI shows a hidden bullish divergence, with price forming higher lows while RSI made lower ones — a structure that often signals trend continuation.
If ETH stays above $3,333, targets sit at $3,650 and $3,994. A daily close below $3,050 could break the pattern.
Despite short-term risks, whales seem to be buying the fear — betting that momentum turns before the next leg up.

ETH PERPETUAL TRADE BUY SETUP Long from $3570ETH PERPETUAL TRADE
BUY SETUP
Long from $3570
Currently $3570
Targeting $3640 or Above
(Trading plan IF ETH
go down to $3520 will add more longs)
Follow the notes for updates
In the event of an early exit,
this analysis will be updated.
Its not a Financial advice


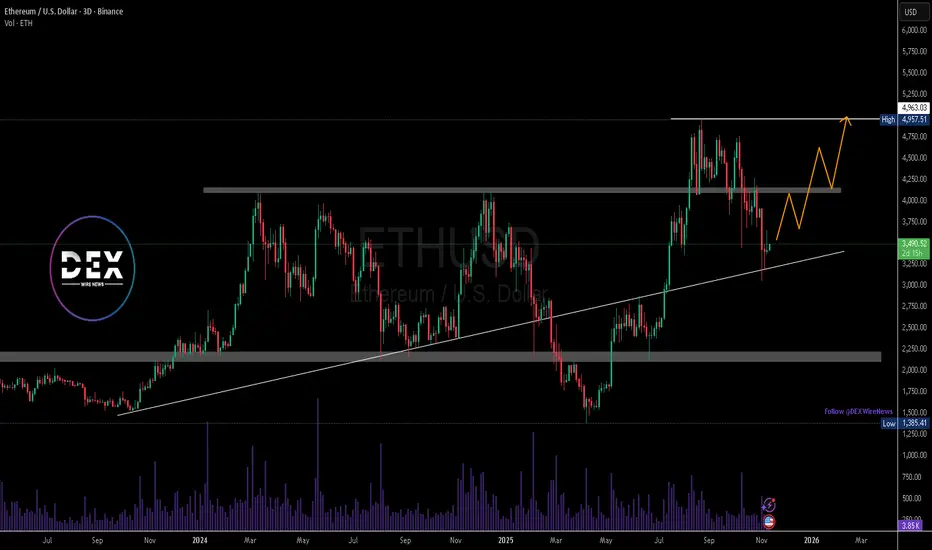
Ethereum Eyes $5K on Rate Cuts Hopes & U.S. Shutdown ResolutionEthereum (ETH/USD) continues to show resilience as macroeconomic conditions begin to favor risk assets. With the U.S. Federal Reserve expected to cut interest rates by 25–50 basis points in December, investors are gradually rotating back into crypto, anticipating improved liquidity and higher capital inflows. Lower interest rates typically weaken the dollar and boost speculative assets like ETH and BTC, making this a potential catalyst for Ethereum’s next bullish leg.
Additionally, progress toward resolving the U.S. government shutdown, which has lingered for weeks, is helping stabilize investor sentiment. Once uncertainty around fiscal operations fades, institutional activity is expected to pick up across both traditional and digital markets — further supporting Ethereum’s recovery momentum.
On-chain fundamentals remain strong. Ethereum’s staking deposits continue to rise, now exceeding 33 million ETH locked in validator contracts. This sustained demand reduces circulating supply and underpins long-term price stability. Meanwhile, the Ethereum network maintains its dominance in decentralized finance (DeFi), non-fungible tokens (NFTs), and Layer-2 scaling activity, positioning it as the backbone of Web3 infrastructure even amid increasing competition.
Technically, ETH/USD has bounced from the $3,200 support zone, aligning with a long-term ascending trendline. The chart shows potential for a sustained push toward the $4,150 resistance before retesting and targeting the $5,000 high. A clear daily close above this level would confirm a continuation of the larger bullish structure and could open the door to new all-time highs in 2026 if macro tailwinds persist.
Overall, Ethereum’s fundamentals and technicals are converging at a favorable point, and with rate cuts on the horizon and fiscal fears fading, ETH may be preparing for a powerful rally into Q1 2026.
ETHUSD 30min Long setup 🔵 Price Action
Successfully reacted to 4H FVG & Order Block
Now trading back above Alligator (3,450.3/3,446.0/3,446.1)
🟡 ICT + Bill Williams Analysis
FVG Fill & Hold: Price respected 3,407-3,415 zone
Order Block Activation: Bullish reversal from 4H OB
Alligator Realignment: Price above all 3 lines → bullish momentum resuming
🎯 Trade Management
Longs from FVG/OB: ✅ Active (AMD)
Stop Loss: To 3,400
Take Profit Levels:
TP1: 3,520 (partial profits)
TP2: 3,560-3,580
TP3: 3,640-3,658
#ETH #ICT #FVG #OrderBlock #Alligator #TradingView

Bearish reversal off pullback resistance?Ethereum (ETH/USD) is rising toward the pivot, which serves as a pullback resistance, and could decline to the first support level, identified as an overlap support.
Pivot: 3,508.18
1st Supprt: 3,359.64
1st Resistance: 3,643.
Disclaimer:
The opinions given above constitute general market commentary and do not constitute the opinion or advice of IC Markets or any form of personal or investment advice.
Any opinions, news, research, analyses, prices, other information, or links to third-party sites contained on this website are provided on an "as-is" basis, are intended to be informative only, and are not advice, a recommendation, research, a record of our trading prices, an offer of, or solicitation for, a transaction in any financial instrument and thus should not be treated as such. The information provided does not involve any specific investment objectives, financial situation, or needs of any specific person who may receive it. Please be aware that past performance is not a reliable indicator of future performance and/or results. Past performance or forward-looking scenarios based upon the reasonable beliefs of the third-party provider are not a guarantee of future performance. Actual results may differ materially from those anticipated in forward-looking or past performance statements. IC Markets makes no representation or warranty and assumes no liability as to the accuracy or completeness of the information provided, nor any loss arising from any investment based on a recommendation, forecast, or any information supplied by any third party.
