ETH (SELL) SHORTS UPDATE FROM $4270ETH SHORTS UPDATE FROM $4270
20% Shorts Added from $4270
Targets to watch for Sellers
$4100, $4080 , $4040
This Setup will be Invalided after breaking $4500
Stop loss $4500
Not a Financial advice
Trade ideas

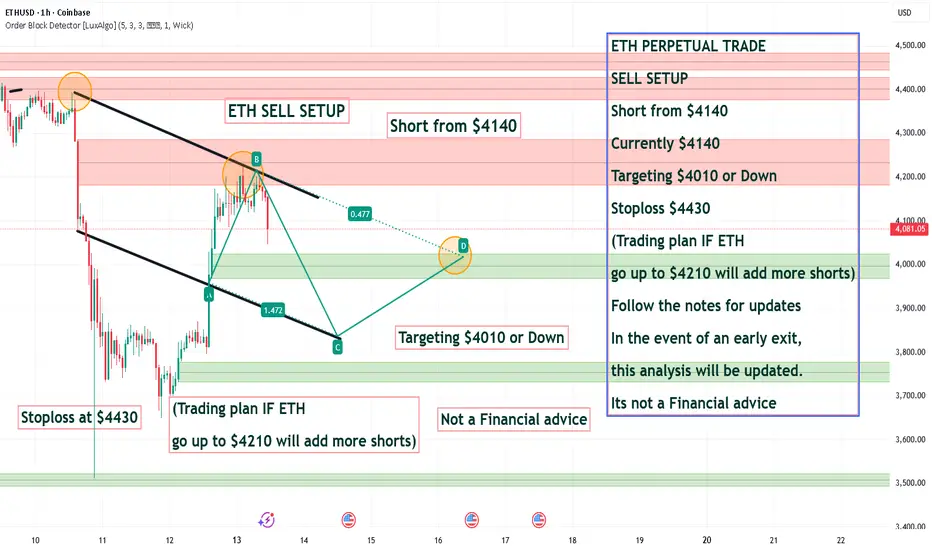
ETH PERPETUAL TRADE SELL SETUP Short from $4140ETH PERPETUAL TRADE
SELL SETUP
Short from $4140
Currently $4140
Targeting $4010 or Down
Stoploss $4430
(Trading plan IF ETH
go up to $4210 will add more shorts)
Follow the notes for updates
In the event of an early exit,
this analysis will be updated.
Its not a Financial advice
Derivatives and Risk Management in Global Markets1. Introduction
In modern financial systems, derivatives are indispensable tools that shape the structure, strategy, and stability of global markets. They serve as critical instruments for managing risks, enhancing liquidity, and providing opportunities for speculation and arbitrage. Derivatives—contracts whose value is derived from underlying assets such as equities, commodities, currencies, interest rates, or indices—have transformed the way investors, corporations, and institutions navigate uncertainty.
The importance of derivatives has grown exponentially over the past four decades. From the early futures markets in Chicago to today’s complex over-the-counter (OTC) instruments, derivatives have become central to the global financial ecosystem. However, while they offer significant benefits in risk mitigation and capital efficiency, they also introduce systemic risks when used recklessly, as seen in crises such as the 2008 financial meltdown. Understanding derivatives and their role in risk management is thus essential for policymakers, traders, and global investors.
2. Concept and Nature of Derivatives
The term derivative originates from the idea that the instrument’s value “derives” from an underlying variable or asset. Derivatives are financial contracts that allow participants to transfer, hedge, or assume risk related to changes in asset prices, interest rates, exchange rates, or other market factors.
2.1 Types of Derivatives
Forward Contracts
A forward is a customized, over-the-counter agreement between two parties to buy or sell an asset at a predetermined price on a specific future date. These contracts are flexible but carry counterparty risk because they are not traded on regulated exchanges.
Futures Contracts
Futures are standardized forward contracts traded on organized exchanges. They are regulated and guaranteed by clearinghouses, which mitigate default risk. Futures are widely used for commodities, stock indices, and currencies.
Options
An option gives the holder the right, but not the obligation, to buy or sell an asset at a predetermined price within a specified period.
Call option: Right to buy.
Put option: Right to sell.
Options enable asymmetrical payoff structures, making them powerful hedging and speculative tools.
Swaps
A swap is a contractual agreement to exchange cash flows between two parties, typically to manage exposure to interest rates, currency movements, or credit risk. Common swaps include interest rate swaps, currency swaps, and credit default swaps (CDS).
Structured Derivatives
These combine features of multiple derivative types or are embedded in other securities. Examples include collateralized debt obligations (CDOs) and equity-linked notes (ELNs).
3. Growth and Globalization of Derivatives Markets
Since the 1980s, deregulation, financial innovation, and technological advancement have fueled the explosive growth of global derivatives. The notional value of outstanding derivatives now exceeds hundreds of trillions of dollars globally, encompassing exchange-traded and OTC markets.
3.1 Exchange-Traded Derivatives (ETDs)
ETDs are standardized instruments traded on regulated exchanges such as the Chicago Mercantile Exchange (CME), Intercontinental Exchange (ICE), Eurex, and the National Stock Exchange (NSE) of India. These markets provide transparency, liquidity, and margin requirements to ensure integrity.
3.2 Over-the-Counter (OTC) Derivatives
OTC derivatives are privately negotiated contracts between institutions, tailored to specific needs. They dominate in areas like interest rate swaps and credit derivatives. While offering flexibility, OTC products pose greater counterparty and systemic risks.
3.3 Drivers of Global Derivatives Expansion
Financial liberalization and globalization
Volatile interest rates, currencies, and commodities
Corporate demand for risk hedging
Technological innovations and algorithmic trading
Sophisticated financial engineering and product innovation
The globalization of finance has interconnected derivative markets across continents. Today, an oil futures contract traded in New York can influence hedging strategies in Singapore, while a currency swap in London might impact credit exposure in Mumbai.
4. Derivatives in Risk Management
Risk management is the art and science of identifying, assessing, and mitigating exposure to financial uncertainty. Derivatives serve as vital tools in this process. Their principal value lies not merely in speculation but in their ability to transfer risk efficiently among market participants.
4.1 Types of Financial Risks Managed by Derivatives
Market Risk
The risk of losses due to changes in asset prices, interest rates, or exchange rates. Futures and options are widely used to hedge such risks.
Interest Rate Risk
Corporations and banks use interest rate swaps and futures to stabilize borrowing costs or asset yields.
Currency (Exchange Rate) Risk
Multinational firms hedge foreign exchange exposure through forward contracts, currency options, or swaps to mitigate losses from currency fluctuations.
Commodity Price Risk
Producers, consumers, and traders use commodity derivatives to stabilize revenues or input costs. For example, airlines hedge jet fuel costs through oil futures.
Credit Risk
Credit derivatives like CDS help lenders transfer the risk of borrower default to other parties.
Liquidity and Volatility Risk
Derivatives like volatility indices (VIX futures) allow investors to hedge against unexpected market turbulence.
4.2 Corporate Hedging Strategies
Corporations utilize derivatives not for speculation but for risk stabilization. Examples include:
Airlines hedging fuel prices using crude oil futures.
Exporters hedging currency exposure through forward contracts.
Banks managing interest income volatility via interest rate swaps.
Portfolio managers using index futures to hedge market downturns.
These strategies protect firms from adverse price movements, enhance planning accuracy, and stabilize cash flows, which in turn supports long-term investment and profitability.
5. Speculation and Arbitrage
While hedging is risk-averse, speculation involves taking on risk in anticipation of profit from price movements. Derivatives amplify speculative opportunities because they require limited initial investment relative to their notional exposure—a phenomenon known as leverage. Traders use derivatives to bet on price directions of currencies, stocks, or commodities.
Arbitrage, on the other hand, involves exploiting price discrepancies in related markets to earn risk-free profits. For example:
Simultaneous purchase and sale of futures and spot assets when mispriced.
Cross-market arbitrage between exchanges in different countries.
Arbitrage activities improve market efficiency by aligning prices across markets.
However, speculative misuse or excessive leverage can destabilize markets, as seen in the collapse of Long-Term Capital Management (LTCM) in 1998 and the 2008 financial crisis.
6. Derivatives and Systemic Risk
Derivatives can amplify systemic risk when interconnected financial institutions face cascading defaults. The 2008 crisis exemplified this danger, as credit default swaps magnified the exposure of banks and insurance firms to mortgage-backed securities. The opacity of OTC contracts and high leverage contributed to widespread contagion.
6.1 Major Lessons from the 2008 Crisis
Lack of transparency in OTC markets increased counterparty risk.
Inadequate collateral and margin requirements led to credit exposures.
Complex structured products obscured true risk levels.
6.2 Regulatory Reforms Post-2008
In response, global regulators implemented sweeping reforms:
Central clearing mandates for standardized OTC derivatives.
Reporting obligations to trade repositories for transparency.
Higher capital and margin requirements for derivative exposures.
Regulatory bodies like ESMA, CFTC, and SEBI strengthened oversight.
These reforms have improved resilience but also shifted derivative activity toward exchange-traded platforms, enhancing systemic safety.
7. Valuation and Pricing of Derivatives
Derivative valuation relies on sophisticated mathematical models that account for time, volatility, and interest rates.
7.1 Key Pricing Models
Black-Scholes Model (1973)
A groundbreaking formula for pricing European options using variables like volatility, strike price, time to maturity, and risk-free rate.
Binomial and Trinomial Models
Discrete-time frameworks that model possible price movements and associated probabilities.
Monte Carlo Simulation
Used for complex derivatives where analytical solutions are infeasible, especially in exotic options or structured products.
Interest Rate Models (e.g., Hull-White, Vasicek)
Applied to value interest rate derivatives and fixed-income instruments.
Accurate pricing is essential for managing risk exposure and ensuring market stability.
8. Derivatives and Emerging Markets
Emerging economies like India, Brazil, and China have witnessed rapid development of derivative markets, often starting with currency and interest rate products before expanding to equity and commodity derivatives.
8.1 The Indian Derivatives Market
India’s derivatives segment, led by the National Stock Exchange (NSE) and Multi Commodity Exchange (MCX), has grown dramatically since the early 2000s. Key features include:
Equity index futures and options (NIFTY, Bank NIFTY)
Currency futures and options (USD/INR, EUR/INR)
Commodity derivatives (gold, crude oil, agricultural products)
Interest rate futures
These instruments support corporate hedging, institutional trading, and retail participation, contributing to capital market depth and liquidity.
8.2 Challenges in Emerging Markets
Limited financial literacy and risk awareness
Low liquidity in certain derivative segments
Regulatory and infrastructural constraints
Higher volatility and exchange rate instability
Despite these hurdles, derivatives are becoming vital for managing economic and financial risks in developing economies.
9. The Role of Technology and Innovation
Digital transformation has revolutionized derivative trading and risk management. Algorithmic trading, artificial intelligence (AI), and blockchain are reshaping how derivatives are priced, executed, and settled.
9.1 Algorithmic and High-Frequency Trading (HFT)
Algorithms execute complex trading strategies in milliseconds, enhancing market liquidity but sometimes increasing volatility.
9.2 Artificial Intelligence and Risk Analytics
AI-driven models improve credit risk assessment, volatility forecasting, and derivative portfolio optimization.
9.3 Blockchain and Smart Contracts
Decentralized platforms promise transparent, tamper-proof recording of derivative contracts, reducing counterparty risk and settlement delays.
10. Derivatives and Global Risk Interconnection
Globalization has linked derivative markets across geographies. A disruption in one region can transmit shocks globally through interconnected positions, as seen in:
The Asian financial crisis (1997)
The global financial crisis (2008)
COVID-19 market volatility (2020)
Risk management now requires systemic thinking—understanding interdependencies among markets, institutions, and instruments. International coordination among regulators and central banks (through the Financial Stability Board and BIS) is essential to monitor global derivative exposures and systemic vulnerabilities.
11. Ethical and Strategic Considerations
While derivatives enhance efficiency, ethical concerns arise when used for manipulation or excessive speculation. The Barings Bank collapse (1995) and Société Générale’s trading scandal (2008) highlighted the dangers of poor internal controls and unmonitored derivative trading.
Corporations and institutions must balance profit motives with prudent risk governance. Derivative policies should align with the firm’s risk appetite, compliance standards, and shareholder value objectives.
12. The Future of Derivatives and Risk Management
Looking forward, derivative markets will continue evolving amid changing macroeconomic, technological, and regulatory landscapes.
Key Trends:
Green and ESG-linked Derivatives
Instruments tied to carbon credits, renewable energy, and sustainability metrics are gaining traction.
Digital Asset Derivatives
Futures and options on cryptocurrencies and tokenized assets are creating new risk paradigms.
Cross-border Regulatory Harmonization
Standardization across jurisdictions will enhance transparency and reduce arbitrage gaps.
AI-powered Risk Management Systems
Predictive analytics and machine learning will redefine how firms identify and manage exposure.
The emphasis will shift toward resilience—ensuring derivative use supports sustainable growth without amplifying systemic fragility.
13. Conclusion
Derivatives are the backbone of modern financial architecture. They enable efficient risk transfer, price discovery, and market integration across borders. Used wisely, derivatives enhance stability and facilitate economic growth by allowing firms and investors to manage uncertainty. Yet, when misused, they can magnify systemic risks and destabilize economies.
Risk management, therefore, is not just about employing derivatives—it’s about understanding their power, purpose, and peril. The challenge for global markets lies in maintaining a delicate balance: leveraging derivatives for innovation and stability while safeguarding against excesses that could endanger financial integrity.
In essence, derivatives are neither inherently good nor bad—they are reflections of how humans manage risk in pursuit of progress. As financial systems evolve, the sophistication of derivatives must be matched by an equal measure of prudence, transparency, and ethical governance.
BTC Trade Idea: Will Support Hold or Is a Reversal Coming? Bitcoin has broken structure to the upside and is showing early bullish signs 🟢. I’m watching closely for a long opportunity if price holds above the current support level and we see a confirmed break of structure from the current low.
However ⚠️ — if this level fails to hold and price breaks below the previous low, we could shift bias and look for a short opportunity 🔻.
📊 Not financial advice — for educational purposes only.

ETh! Now That's Propostrous I can't help but to see it how I see it, and I like to see it for what it is. 3/4, that's what I often aim for. 3/4 the all time high at least.

ETHUSD H1 | Bullish BounceETH/USD is falling towards the buy entry at 4,199.93, which is a pullback support that aligns with the 23.6% Fibonacci retracement and could bounce from this level to the upside.
Stop loss is at 4,080.59, which is a pullback support that lines up with the 50% Fibonacci retracement.
Take profit is at 4,412.84, which is an overlap resistance that lines up with the 61.8% Fibonacci retracement.
High Risk Investment Warning
Trading Forex/CFDs on margin carries a high level of risk and may not be suitable for all investors. Leverage can work against you.
Stratos Markets Limited (tradu.com ):
CFDs are complex instruments and come with a high risk of losing money rapidly due to leverage. 65% of retail investor accounts lose money when trading CFDs with this provider. You should consider whether you understand how CFDs work and whether you can afford to take the high risk of losing your money.
Stratos Europe Ltd (tradu.com ):
CFDs are complex instruments and come with a high risk of losing money rapidly due to leverage. 66% of retail investor accounts lose money when trading CFDs with this provider. You should consider whether you understand how CFDs work and whether you can afford to take the high risk of losing your money.
Stratos Global LLC (tradu.com ):
Losses can exceed deposits.
Please be advised that the information presented on TradingView is provided to Tradu (‘Company’, ‘we’) by a third-party provider (‘TFA Global Pte Ltd’). Please be reminded that you are solely responsible for the trading decisions on your account. There is a very high degree of risk involved in trading. Any information and/or content is intended entirely for research, educational and informational purposes only and does not constitute investment or consultation advice or investment strategy. The information is not tailored to the investment needs of any specific person and therefore does not involve a consideration of any of the investment objectives, financial situation or needs of any viewer that may receive it. Kindly also note that past performance is not a reliable indicator of future results. Actual results may differ materially from those anticipated in forward-looking or past performance statements. We assume no liability as to the accuracy or completeness of any of the information and/or content provided herein and the Company cannot be held responsible for any omission, mistake nor for any loss or damage including without limitation to any loss of profit which may arise from reliance on any information supplied by TFA Global Pte Ltd.
The speaker(s) is neither an employee, agent nor representative of Tradu and is therefore acting independently. The opinions given are their own, constitute general market commentary, and do not constitute the opinion or advice of Tradu or any form of personal or investment advice. Tradu neither endorses nor guarantees offerings of third-party speakers, nor is Tradu responsible for the content, veracity or opinions of third-party speakers, presenters or participants.

$ETHUSD add to position on pullbackBITSTAMP:ETHUSD has bounced to almost the 61.8% retracement. I'm long but don't have a full position. I plan to add to my position on pullbacks. Expect BITSTAMP:ETHUSD to make new highs before the year end.
The Crash Is DONE — Alt Season Starts NOW!!🔥 The Market Collapsed… But I Told You This Would Happen.
Ever since I started this channel, I’ve been saying we needed a liquidity sweep before the real move begins — and we just got it. The market has flushed out the weak hands, and now I’m finally turning bullish.
In this video, I break down:
-How I predicted the crash and why it was necessary
-Why I’m now long and bullish on EVERYTHING
-What this means for the next phase: ALT SEASON
-Key ICT levels and setups I’m watching for massive opportunities
-MAIN TARGET LEVELS
This could be the start of the move we’ve been waiting for. Let’s get ready for what’s coming next. ALT SZN IS UPON US
#Bitcoin #AltSeason #Crypto #BTC #ETH #CryptoNews #CryptoTrading #ICTStrategy

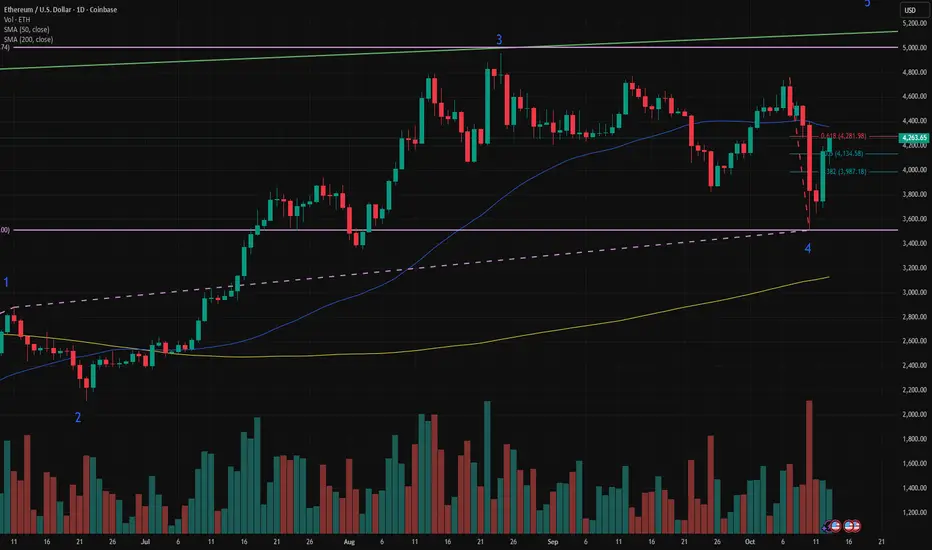
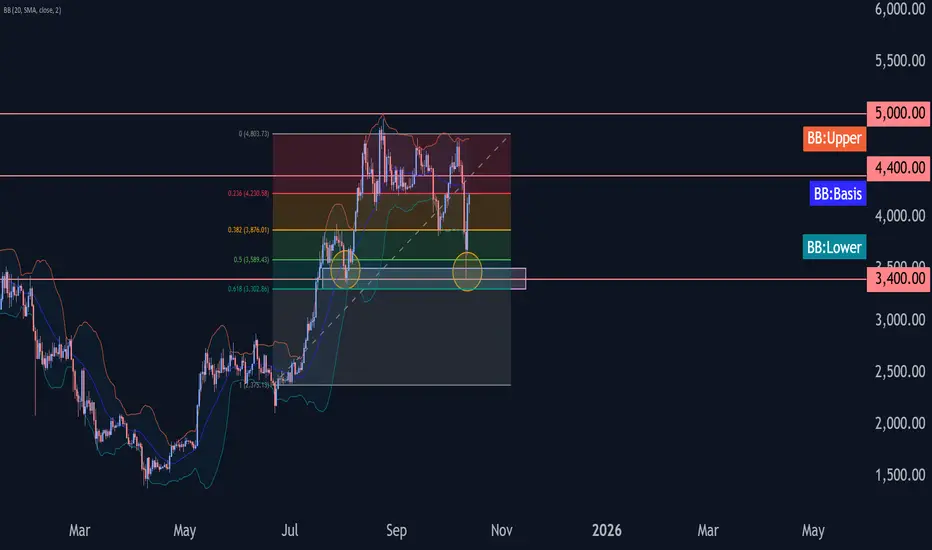
Ethereum Wave Analysis – 13 October 2025
- Ethereum reversed from the support zone
- Likely to rise to resistance level 4400.00.
Ethereum cryptocurrency recently reversed up from the support zone between the key support level 3400.00 (which also reversed the price in August), lower daily Bollinger Band and the 50% Fibonacci correction of the upward impulse from June.
The upward reversal from this support zone created the daily Japanese candlesticks reversal pattern Bullish Engulfing.
Given the clear daily uptrend, Ethereum cryptocurrency can be expected to rise to the next resistance level 4400.00.
Ethereum's critical juncture at 4200-4300Ethereum's critical juncture at 4200-4300
ETH/USD on the 4-hour timeframe presents a compelling picture of a market at a crucial inflection point. Following a significant correction, Ethereum has staged a notable recovery and is now testing a formidable resistance zone. This analysis delves into Ethereum's journey and outlines the key levels that will shape its immediate future.
The Retreat and The Resilient Foundation
Ethereum experienced a strong rally that culminated around the 4700 mark in early October. This was followed by a sharp downturn, seeing the price drop significantly over several days. The decline found its ultimate floor around the Key Support near 3500 area, with an initial bounce originating from the 3700 1st Key Support level. These lower regions proved to be robust foundations, indicating strong demand at these price points.
The Grand Comeback: From Depths to Decision
From these lower support levels around October 11th, Ethereum initiated a robust recovery. A series of strong green candles indicates significant buying interest, driving the price upwards. This upward movement is currently encapsulated by an ascending trend channel (white lines), suggesting a short-term bullish momentum.
Ethereum has successfully pushed back up through the 4100 Deciding Area (grey band), which acted as both support and resistance previously. The price is now directly engaging the 4200 to 4300 Strong Resistance (red band). This zone represents a significant overhead barrier, where previous bullish momentum stalled, and price consolidated before its major decline.
The Current Crossroads: 4200 to 4300 Strong Resistance
Ethereum is currently battling within the 4200 to 4300 Strong Resistance zone. This area is crucial as it signifies a previous consolidation region before the sharp move down. Overcoming this resistance would be a strong indicator of continued bullish intent, whereas a rejection could signal a pause or retracement in the current recovery.
Key Levels to Watch: Resistance & Support
On the Upside (Resistance):
4200 to 4300 Strong Resistance: This is the immediate, critical barrier. A sustained break and hold above this zone would be a strong bullish signal.
4500 Flip Zone: Above the current resistance, this teal band represents the next significant challenge. This area has historically acted as both support and resistance, indicating its importance as a potential turning point or consolidation zone.
On the Downside (Support):
Ascending Trend Channel: The lower boundary of the white trendlines provides dynamic support for the current bounce. A breakdown below this could indicate a loss of short-term momentum.
4100 Deciding Area: Below the current price, this grey band is now acting as immediate support. Holding this level is crucial for maintaining the current upward trajectory.
3850 to 3950 Possible Retest: This light green zone offers a deeper support level if the 4100 area fails to hold. A retest here could provide another entry for buyers, assuming the overall bullish structure remains intact.
3700 1st Key Support: A significant support level established during the recent bottoming process.
Key Support near 3500: The ultimate critical support. A breach below this level would signal a major breakdown of the recovery structure and could lead to further downside.
Potential Scenarios from Here
The chart illustrates potential paths forward with dotted white lines:
Bullish Path: A successful breakout and sustained close above the 4200 to 4300 Strong Resistance could see Ethereum targeting the 4500 Flip Zone.
Correction Path: A rejection from the current 4200 to 4300 Strong Resistance might lead to a retest of the ascending trendline and the 4100 Deciding Area. A deeper pullback could see the price testing the 3850 to 3950 Possible Retest zone.
Conclusion
Ethereum is currently at a critical juncture, testing a strong resistance level after a robust bounce from key support. The ability to overcome the 4200 to 4300 Strong Resistance will be paramount in determining the immediate bullish continuation. Conversely, a failure to break through could prompt a retracement to established support levels. Close observation of price action around these defined zones, especially the 4200 to 4300 Strong Resistance and the 4100 Deciding Area, is essential for understanding Ethereum's short-term direction.
Disclaimer:
The information provided in this chart is for educational and informational purposes only and should not be considered as investment advice. Trading and investing involve substantial risk and are not suitable for every investor. You should carefully consider your financial situation and consult with a financial advisor before making any investment decisions. The creator of this chart does not guarantee any specific outcome or profit and is not responsible for any losses incurred as a result of using this information. Past performance is not indicative of future results. Use this information at your own risk. This chart has been created for my own improvement in Trading and Investment Analysis. Please do your own analysis before any investments.

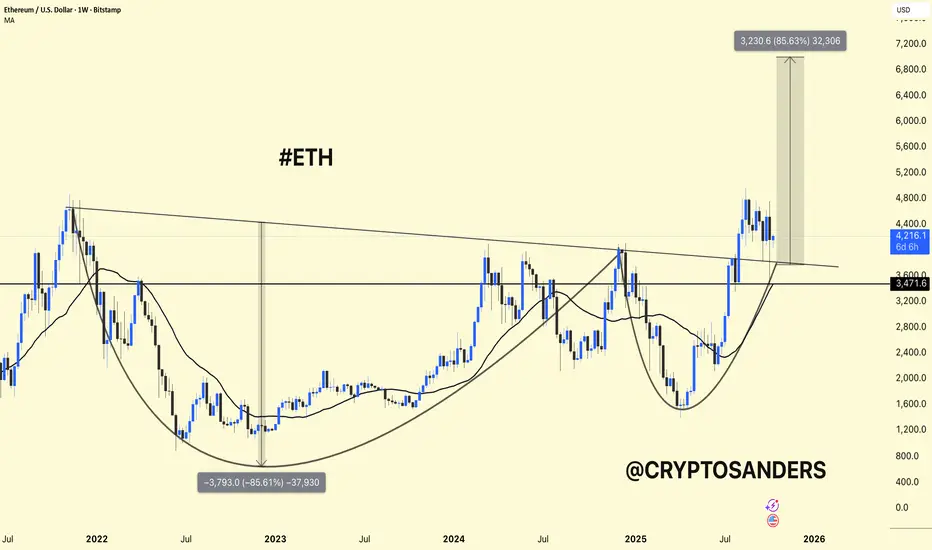
ETH/USDT Weekly Chart Analysis !!ETH/USDT Weekly Chart Analysis.
Structure: The chart shows a large cup-and-handle pattern – a classic bullish formation that signals a long-term trend reversal.
Current Price: Around $4,150, trading above the $3,470-$3,600 support area, which was the previous breakout area.
Moving Average (MA): ETH remains above the weekly MA (~$3,460) – confirming bullish momentum.
Breakout Area: The key downtrend line of 2022 has already been broken to the upside, showing strength.
Upside Target: If ETH maintains a price above $3,600, a potential upside move towards $7,000-$7,200 (≈ approximately +85%) is possible, as shown in the chart.
ETH is consolidating after its breakout, remaining stable above its support level.
Holding $3,600 → Bullish momentum likely to continue.
Loss of $3,400 → Could trigger a deeper decline towards $3,000.
DYOR | NFA
ETHUSDT is coming!!!ETH looks ready for a bullish move — I’m seeing a clear 3-wave pattern forming, each wave getting bigger. Momentum’s building up nicely 👀🚀

ETH Outlook after the Dip. What to expect NOW?The price has now reached the bottom of the wedge, and this could be a sign for a rebound, or possibly Kangaroo-like move to the middle of the wedge.

Eth looking for swing longThere is one last wave, Flat correction for the fourth wave the fifth major one.

ETH Intra-Day Analysis 13-Oct-25
After the Sell-off that took place on Friday Oct-10, due to the fear in the markets after the US President announced 100% tariffs on Chinese Exports.
The move triggered massive liquidation which wiped out around 19B in 1 day.
Later during the weekend we started to head a de-escalation tone from Trump.
In this video, we are sharing the areas of interest we will be looking at on ETH.
Disclaimer: easyMarkets Account on TradingView allows you to combine easyMarkets industry leading conditions, regulated trading and tight fixed spreads with TradingView's powerful social network for traders, advanced charting and analytics. Access no slippage on limit orders, tight fixed spreads, negative balance protection, no hidden fees or commission, and seamless integration.
Any opinions, news, research, analyses, prices, other information, or links to third-party sites contained on this website are provided on an "as-is" basis, are intended only to be informative, is not an advice nor a recommendation, nor research, or a record of our trading prices, or an offer of, or solicitation for a transaction in any financial instrument and thus should not be treated as such. The information provided does not involve any specific investment objectives, financial situation and needs of any specific person who may receive it. Please be aware, that past performance is not a reliable indicator of future performance and/or results. Past Performance or Forward-looking scenarios based upon the reasonable beliefs of the third-party provider are not a guarantee of future performance. Actual results may differ materially from those anticipated in forward-looking or past performance statements. easyMarkets makes no representation or warranty and assumes no liability as to the accuracy or completeness of the information provided, nor any loss arising from any investment based on a recommendation, forecast or any information supplied by any third-party.
Risk Warning: 74% of retail investor accounts lose money when trading CFDs with this provider. You should consider whether you can afford to take the high risk of losing your money. Please refer to our full risk disclaimer on our website.

ETH 2025 Price TargetBased on the chart structure and historical behavior, if we continue to move within a within a narrowing triangle, a strong breakout toward the 6K level seems very likely. You could even say it’s almost inevitable, but only if the Fed doesn’t inject new negative catalysts and capital doesn’t start exiting positions. Thanks to institutional investors steady accumulation, the 6K target remains highly probable.
Not financial advice.

Zoom out $ETH Ethereum is currently retesting the same area after breaking its major falling that has been ongoing since 2021.
The area that was previously resistance is now a strong demand zone.
The pullback in the short term is not a cause for panic, but rather a healthy retest in the bigger picture.
The trend remains upward, and staying above the demand zone will mark the beginning of Ethereum's next major run.

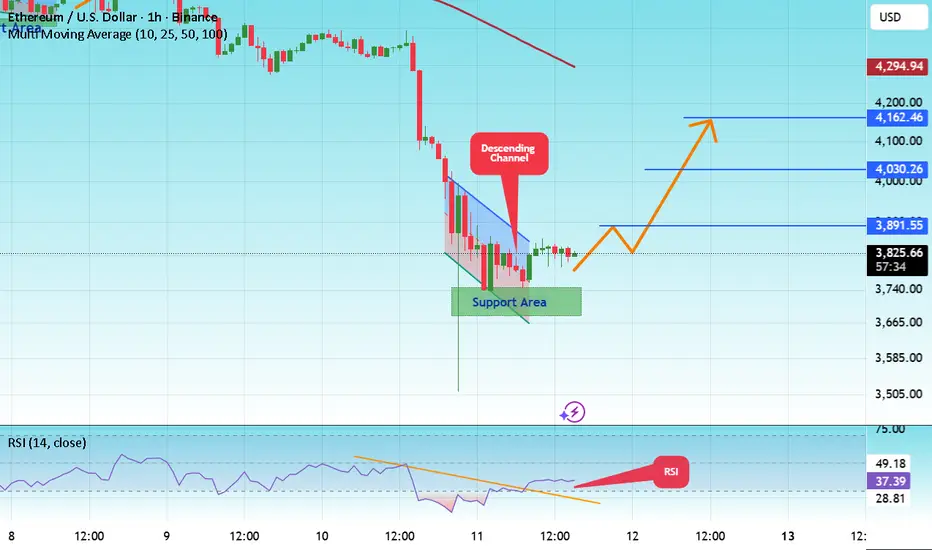
#ETH/USDT forms bullish patterns#ETH
The price is moving in a descending channel on the 1-hour frame and is expected to break and continue upward.
We have a trend to stabilize above the 100 moving average once again.
We have a downtrend on the RSI indicator that supports the upward move with a breakout.
We have a major support area in green that pushed the price higher at 3700.
Entry price: 3817.
First target: 3890.
Second target: 4030.
Third target: 4162.
To manage risk, don't forget stop loss and capital management.
When you reach the first target, save some profits and then change your stop order to an entry order.
For inquiries, please comment.
Thank you.
ETH: high-level consolidationAfter last week's sharp decline, the price began to rebound over the weekend and broke above 4,000. Today, it entered a high-level consolidation phase. This indicates that bullish forces have strengthened recently and are trying to push the price higher. Overall, today's trend shows that the bulls have started to counterattack, but the overall situation is still uncertain. Given the market's uncertainty, it is essential to set strict stop-losses and control positions when trading to guard against risks from sharp price fluctuations.
Buy 4020 - 4030
TP 4040 - 4050 - 4060
SL 4010
Daily-updated accurate signals are at your disposal. If you run into any problems while trading, these signals serve as a reliable reference—don’t hesitate to use them! I truly hope they bring you significant assistance

Start of Altseason and Ethereum's RiseHello friends 👋
I've posted my Ethereum analysis for you ✍️. Given the oversold zone on the RSI 📉 and Ethereum's past history 📜, I predict we will see a significant surge in the next two months 🚀—around 130% 💹, reaching a price of $8,000 USDT for Ethereum 💎.
Furthermore, the altcoin season is also expected to happen during this period 🌕.
I hope you'll also share your own thoughts about the market in the comments section 💬.
📢 Important Note: This is solely an analysis/prediction, and the responsibility for any trading or investment decisions is entirely your own! ⚠️

ETH is still following my plans pretty preceiselyWhat a mess Friday turned out to be with a recording breaking liquidation event with the numbers still growing - bigger than FTX!
SUNK COST FALLACY: THE DAMAGE IS DONE, DO NOT PANIC IN AND OUT OF POSITIONS.
So many alt-coins proved there is nothing but thin air holding them up - no real demand whatsoever! I'll take a look at some charts today. Now these wicks can be classed as 'anomalies' in technical analysis but in this case i think we've revealed some of the strong tokens now with real backing.
It is expected that with such large wicks we at least test the centre of the wick on one more terrifying shake-out that isn't actually as bad as the one we just has but feels it because traders and investors are been kicked while their down in a state of panic.
-------------
CRYPTOCAP:ETH was looking toppy for a while especially with the 'poke above all time high' Elliot wave 1 rule and i shared my thoughts on downside targets. It is has my secondary target o the drop of the daily 200EMA and bounce hard with bullish divergence in RSI. This is also a shallow retracement of the .382 Fibonacci showing macro strength.
I expect another pullback to test the High Volume Node as support before a strong wave 3 to commence
Safe trading

Energy Market Analysis and the Rising Geopolitical Tensions1. Overview of the Global Energy Market
The global energy market is a vast network of interconnected systems that encompass fossil fuels (oil, coal, and natural gas), renewable sources (solar, wind, hydro, and bioenergy), and emerging technologies such as hydrogen and nuclear fusion. As of 2025, fossil fuels still account for approximately 80% of global energy consumption, although renewable energy’s share is growing rapidly due to environmental pressures and technological progress.
Key Players in the Energy Market
OPEC and OPEC+: The Organization of the Petroleum Exporting Countries (OPEC), led by Saudi Arabia, along with partners like Russia (OPEC+), plays a central role in regulating global oil supply and influencing prices.
The United States: A global leader in shale oil and gas production, the U.S. has transformed from an energy importer to a major exporter, significantly altering global trade flows.
China and India: As the world’s largest energy consumers, these nations’ growing demand drives global market trends, particularly in coal and renewable energy investments.
Russia: A dominant exporter of natural gas to Europe and oil to Asia, Russia’s geopolitical strategies have direct consequences on global energy stability.
Current Market Trends
Increased diversification toward renewable energy and energy storage systems.
Shift in trade patterns as Europe reduces dependence on Russian energy.
Price volatility driven by conflicts, sanctions, and supply chain disruptions.
Strategic stockpiling and national energy security initiatives.
2. The Role of Geopolitics in Energy Markets
Energy and geopolitics are deeply intertwined. Control over energy resources has long been a source of both cooperation and conflict among nations. Geopolitical events often cause significant fluctuations in energy supply and prices. For example:
The 1973 Oil Crisis, when Arab nations embargoed oil exports to the West, caused severe economic shocks.
The Gulf War (1990–91) disrupted oil flows and reshaped Middle Eastern energy politics.
The Russia–Ukraine war (2022–present) has triggered global energy shortages and a reorientation of European energy policy.
Why Geopolitics Matters
Energy as a Strategic Weapon: Countries with abundant energy reserves use them as geopolitical tools to influence others.
Supply Chain Disruptions: Political instability or sanctions can halt production or transportation.
Investment Uncertainty: Geopolitical risks discourage long-term investments in exploration and infrastructure.
Shifts in Alliances: Nations often realign politically to secure stable energy supplies.
3. Geopolitical Flashpoints Affecting the Energy Market
a. The Russia–Ukraine Conflict
The ongoing Russia–Ukraine war has had one of the most profound impacts on the global energy system in decades. Before the conflict, Russia supplied nearly 40% of Europe’s natural gas. Sanctions and the subsequent cutoffs have forced Europe to diversify rapidly toward liquefied natural gas (LNG) from the U.S., Qatar, and Norway.
This geopolitical shift has led to:
Record-high energy prices in Europe (2022–2023).
Acceleration of renewable energy projects to reduce dependence on imports.
Growth in LNG infrastructure, especially in Germany, the Netherlands, and Poland.
Increased Russian energy exports to China and India, creating new trade alliances.
b. Middle East Tensions
The Middle East remains the heart of global oil production, with countries like Saudi Arabia, Iran, Iraq, and the UAE controlling vast reserves. However, the region’s persistent instability—stemming from political rivalries, sectarian divides, and external interventions—creates continuous uncertainty.
Recent flare-ups, such as Iran–Israel tensions and Red Sea shipping disruptions, have threatened supply routes through vital chokepoints like the Strait of Hormuz and Suez Canal, through which nearly 20% of global oil shipments pass.
c. The South China Sea Dispute
The South China Sea is a key maritime route that handles nearly 30% of global trade, including large volumes of energy cargo. Competing territorial claims between China, Vietnam, the Philippines, and others create risks for oil and gas exploration and maritime transport. China’s increasing militarization of the area has strategic implications for global energy logistics, especially for nations dependent on oil imports from the Middle East.
d. U.S.–China Strategic Competition
The rivalry between the U.S. and China extends beyond trade—it encompasses technology, semiconductors, and energy resources. Both nations are competing for leadership in clean energy technologies such as solar panels, batteries, and electric vehicles. Additionally, the race to control rare earth minerals—vital for renewable technologies—has become a geopolitical battleground.
4. Energy Security and Supply Chain Vulnerabilities
Energy security refers to the uninterrupted availability of energy sources at an affordable price. Geopolitical tensions undermine this stability in multiple ways:
Disrupted Supply Chains: Wars or sanctions can halt production and transport of energy commodities.
Infrastructure Attacks: Pipelines and refineries are often prime targets during conflicts.
Price Volatility: Market panic and speculation amplify price swings, harming consumers and industries.
Dependence Risks: Heavy reliance on a single supplier or route increases vulnerability.
In response, many countries are pursuing energy diversification strategies, developing domestic reserves, investing in renewables, and building strategic petroleum reserves (SPR) to cushion against shocks.
5. The Green Energy Transition Amid Geopolitical Uncertainty
The global shift toward renewable energy is reshaping the geopolitical map. Solar, wind, hydro, and green hydrogen are reducing dependence on fossil fuels, yet they introduce new challenges—especially around the sourcing of critical minerals like lithium, cobalt, and nickel.
Opportunities in the Green Transition
Energy Independence: Nations can reduce reliance on imports by producing renewable energy domestically.
Job Creation: Expansion of renewable infrastructure creates employment and stimulates innovation.
Climate Commitments: The transition supports global sustainability goals under the Paris Agreement.
Challenges
Mineral Dependency: Many clean technologies rely on minerals concentrated in politically unstable regions (e.g., Congo for cobalt).
High Initial Investment: Developing renewable capacity requires significant capital.
Technological Gaps: Developing nations may struggle to keep pace with advancements in green technology.
6. Market Impacts: Price Fluctuations and Investment Trends
Geopolitical instability exerts a direct impact on energy prices:
Oil Prices: Fluctuate sharply with supply disruptions. For instance, Brent crude spiked above $120 per barrel in 2022 due to the Ukraine crisis.
Natural Gas Prices: Europe’s gas prices increased fivefold amid the cutoff from Russia.
Coal Demand: Surged temporarily as nations sought alternatives to gas.
Renewable Energy Investments: Hit record highs as governments sought energy security through self-sufficiency.
Investors are increasingly incorporating geopolitical risk assessments into portfolio decisions. Energy companies are diversifying geographically and shifting capital toward renewables and resilient infrastructure.
7. Regional Analysis
a. Europe
Europe has taken bold steps toward energy independence. The EU’s REPowerEU plan aims to cut Russian gas imports by 90% and expand renewable capacity. However, the short-term transition has been costly, leading to inflation and industrial challenges.
b. North America
The U.S. continues to leverage its shale revolution and emerging hydrogen sector to strengthen energy security. Canada’s vast oil sands also play a role in regional stability.
c. Asia-Pacific
Asia remains the largest energy-consuming region. China leads in solar and battery manufacturing, while India is aggressively expanding its renewable portfolio. However, both nations remain dependent on coal and imported oil.
d. Middle East and Africa
The Middle East continues to dominate fossil fuel exports, but some nations—like the UAE and Saudi Arabia—are investing in renewable diversification through initiatives like NEOM and Masdar. African countries such as Nigeria and Mozambique are emerging gas exporters, though political instability hinders growth.
8. The Future of Energy Geopolitics
The energy landscape is moving toward multipolarity—no single region will dominate global energy supply. Key trends shaping the future include:
Energy Transition Diplomacy: Nations will compete to lead in clean technology exports.
Technological Dominance: Control over green technology patents and supply chains will become a geopolitical tool.
Strategic Partnerships: New alliances will form around renewable energy corridors, critical minerals, and hydrogen infrastructure.
Decentralization of Power: Smaller nations rich in minerals or renewable potential will gain strategic significance.
9. Policy Recommendations
To mitigate risks and foster stability, global policymakers should:
Diversify Energy Sources: Reduce dependence on single suppliers or regions.
Invest in Infrastructure Security: Protect pipelines, grids, and data networks from attacks.
Strengthen Multilateral Cooperation: Use institutions like the IEA, WTO, and G20 to mediate energy disputes.
Accelerate Renewable Adoption: Support financing and innovation in clean energy technologies.
Promote Strategic Reserves: Maintain emergency stockpiles for oil, gas, and critical minerals.
Conclusion
The global energy market stands at a crossroads where geopolitics and sustainability intersect. Rising geopolitical tensions—whether from wars, trade rivalries, or territorial disputes—continue to disrupt supply chains and influence market dynamics. Yet, this period of uncertainty also presents an opportunity: to accelerate the transition toward a more secure, diversified, and sustainable energy future.
Energy will always remain a cornerstone of national power, but its sources, structures, and strategies are evolving. Nations that adapt—by embracing renewable energy, strengthening supply resilience, and engaging in cooperative diplomacy—will not only withstand geopolitical shocks but also lead the next chapter of the global energy revolution.

Bullish Retest of Reclaimed SupportHello TradingView Community,
This post outlines a potential long trade setup for the Ethereum / U.S. Dollar (ETHUSD) pair, based on the 15-minute timeframe.
Technical Analysis:
The chart shows a key horizontal price level at approximately $4,141.59. This level has been a significant pivot point, acting as both support and, more recently, resistance.
After a sharp move down, the price has shown considerable strength by breaking back above this level, which is a bullish signal indicating that buyers may be regaining control. The trading idea is based on a classic "break and retest" pattern. The price is currently consolidating on top of this former resistance zone. The expectation is that this level will now act as new support, providing a solid base for a potential move higher.
Trade Setup:
The long position tool on the chart visualizes a potential trade plan for this bullish scenario:
Entry: Approximately $4,141.59 (at the retest of the new support).
Stop Loss: $4,054.84 (placed below the key support structure to invalidate the idea if the level fails to hold).
Take Profit: $4,392.28 (targeting a new potential higher high).
This setup provides a structured plan with a favorable risk-to-reward ratio for a potential continuation of the bullish momentum.
Disclaimer: This analysis is for educational and discussion purposes only and should not be considered financial advice. Trading cryptocurrencies involves significant risk. Please conduct your own due diligence and manage your risk appropriately.
