Bullish Retest of Reclaimed SupportHello TradingView Community,
This post outlines a potential long trade setup for the Ethereum / U.S. Dollar (ETHUSD) pair, based on the 15-minute timeframe.
Technical Analysis:
The chart shows a key horizontal price level at approximately $4,141.59. This level has been a significant pivot point, acting as both support and, more recently, resistance.
After a sharp move down, the price has shown considerable strength by breaking back above this level, which is a bullish signal indicating that buyers may be regaining control. The trading idea is based on a classic "break and retest" pattern. The price is currently consolidating on top of this former resistance zone. The expectation is that this level will now act as new support, providing a solid base for a potential move higher.
Trade Setup:
The long position tool on the chart visualizes a potential trade plan for this bullish scenario:
Entry: Approximately $4,141.59 (at the retest of the new support).
Stop Loss: $4,054.84 (placed below the key support structure to invalidate the idea if the level fails to hold).
Take Profit: $4,392.28 (targeting a new potential higher high).
This setup provides a structured plan with a favorable risk-to-reward ratio for a potential continuation of the bullish momentum.
Disclaimer: This analysis is for educational and discussion purposes only and should not be considered financial advice. Trading cryptocurrencies involves significant risk. Please conduct your own due diligence and manage your risk appropriately.
Trade ideas

ETH Already RecoveringNot too much to this trade here. A lot of it is fundamental but we do have some technical components.
After the huge liquidation of longs on Friday, I believe the bulls are going to step back in and drive the price back up.

ETH/BTC Ratio signalling a possible short term leadership flipIt looks like ETH might finally speak the language that the crypto traders like to hear


ETH's Critical $4100 Retest: What's Next for Ethereum?
ETH's Critical $4100 Retest: What's Next for Ethereum?
After dropping down to key support level of 3500, price has delivered a strong bounce today, currently retesting the critical $4100 'Deciding Area'. This recovery is now challenging the 'Dynamic Resistance Trend channel' formed during the recent decline.
Going forward, the key levels to watch are the immediate resistance from the $4100 zone and the trend channel. Should ETH overcome these, the next major resistance lies between $4200 to $4300. On the downside, if the current rebound loses momentum, previous support levels like the 3850−3950 zone and the $3700 1st Key Support will become crucial areas to hold.
Disclaimer:
The information provided in this chart is for educational and informational purposes only and should not be considered as investment advice. Trading and investing involve substantial risk and are not suitable for every investor. You should carefully consider your financial situation and consult with a financial advisor before making any investment decisions. The creator of this chart does not guarantee any specific outcome or profit and is not responsible for any losses incurred as a result of using this information. Past performance is not indicative of future results. Use this information at your own risk. This chart has been created for my own improvement in Trading and Investment Analysis. Please do your own analysis before any investments.

ETH:Plummeting sharplySince October, Ethereum has exhibited an extreme price trend of "rallying and then pulling back – plummeting sharply", reflecting violent swings in market sentiment between "optimism over technological prospects" and "macro-driven risk aversion".
The psychological levels of 3,400 and 4,000 serve as crucial short-term support. If the price breaks below 3,400, a flood of stop-loss orders may be triggered. Resistance is concentrated around 4,500 , and an effective breakout will require confirmation from increased trading volume.
In the short term, affected by lingering panic and insufficient trading volume, Ethereum is likely to consolidate within the 3,400–4,500 range. Close attention should be paid to the validity of the 3,400 support level.

ETH: Oscillated around the 3850Affected by the aftershocks of the global financial market turbulence in the previous two days, ETH rebounded slightly today and oscillated around the 3,850 level after a correction. This indicates that bullish sentiment in the market has not completely faded, but high leverage risks still persist.
Today's ETH trend also shows a tug-of-war between "long-term technical positives" and "short-term market volatility". Investors need to balance expectations for upgrades and macro risks, remain vigilant against the risk of a sell-off triggered by high-leverage trading, and at the same time pay attention to marginal changes in the Layer 2 ecosystem and upgrade adaptation progress.
Buy 3830 - 3840
TP 3850 - 3860 - 3870
SL 3825
Daily-updated accurate signals are at your disposal. If you run into any problems while trading, these signals serve as a reliable reference—don’t hesitate to use them! I truly hope they bring you significant assistance

Etherium: Short term BuyAfter blood bath on 10 oct, bullish divergence appears on RSI and MACD on 1hr time frame, breakout above LH (3867) level will generate bullish signal.
Buy = 3867
TP-1=4112
TP-2= 4360
SL= 3629

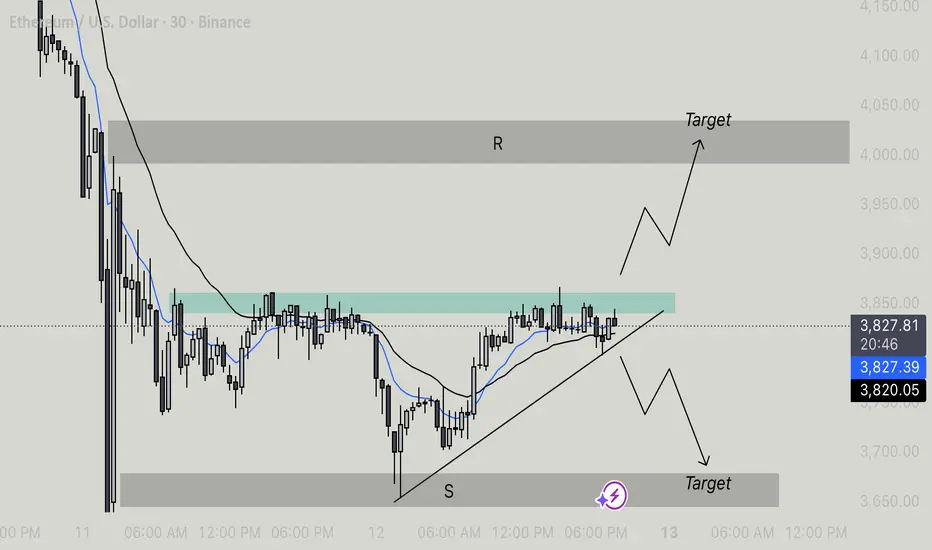
Eth/Usd - Breakout Loading, Watch Level CloselyEthereum is currently trading within an ascending triangle pattern, characterized by a horizontal resistance zone and rising trendline support. This pattern typically signals bullish continuation, though traders should watch closely for confirmation before entering a position.
Key Levels
• Resistance Zone (R): Around $3,850–$3,870, marked by repeated price rejection.
• Support Zone (S): Around $3,700–$3,720, providing strong buying interest.
• Current Price: Approximately $3,839.
Technical Outlook
• Trendline Support: ETH is respecting a clear upward-sloping trendline, showing buyers are steadily pushing higher lows.
• Horizontal Resistance: Price continues to test the $3,850 resistance area. A strong breakout and close above this level would confirm bullish momentum.
• Moving Averages: The shorter-term (blue) EMA is positioned above the longer-term (black) EMA, suggesting near-term bullish bias as long as support holds.
Scenarios
• Bullish Scenario:
If Ethereum breaks and holds above the $3,850 resistance, it could trigger a move toward the next resistance target near $4,000–$4,050. This would confirm a breakout from the ascending triangle pattern.
• Bearish Scenario:
A breakdown below the ascending trendline could lead to a retest of the $3,700 support zone or even lower toward $3,650, signaling short-term weakness.
Summary
Ethereum is consolidating just below a key resistance level within an ascending triangle. A breakout above $3,850 may open the door to further upside momentum, while a breakdown below trendline support could invalidate the bullish setup. Traders should watch for a decisive move with volume confirmation to gauge the next direction.
mrmoney limited ETH/USD position trading ideaprice has approached our monthly key resistance level which made price to have a bearish turn we have a minor support zone which price reacted to and has recently givenen us bullish momentum

Healthiness on the wayETHUSD is starting to look better again. If we break through the upper trend line then that would be bullish.

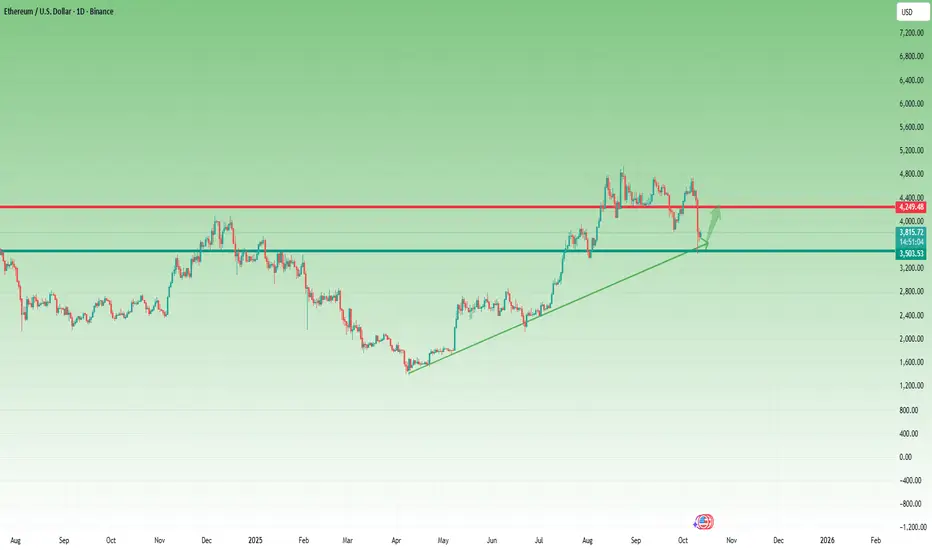
ETH— What the 3500 Support Means and How I’m Trading ItExactly on Friday, just before the big drop, I bought ETH at 4300.
Fortunately, I had a stop loss at 4150, which — of course — got triggered.
But instead of frustration or searching for someone to blame, I took it like a trader should — accepted it, moved forward, and focused on what’s next. Because in trading, maturity starts where ego ends.
Technical Picture
Looking at the chart, after breaking the 4300 support line, ETH accelerated to the downside and found buyers around 3500.
This level is not random — it’s defined by:
1. A major horizontal support
2. The ascending trendline from previous lows
3. And the psychological round number of 3500
Naturally, we saw an initial rebound from that area.
Trading Plan
If the market retests the 3500 zone, I’ll be looking for buying opportunities, targeting a potential retest of 4300.
However — and this is crucial — my trade will be low-volume and protected by a tight stop.
Why? Because while I believe this could be a turning point, so does everyone else.
And when every retail trader sees the same thing, I trade carefully — because as we’ve all learned now, there’s no such thing as free money.
Final Thought
Discipline is not about winning every trade — it’s about staying rational when emotions scream louder than logic.
$ETH I’m waiting for the 3D candle to close. CRYPTOCAP:ETH I’m waiting for the 3D candle to close.
If it closes above 3.8k, I expect the next candle to be green, indicating a small bounce across the board.
The key level to watch is 3,330k, which marks the 2025 yearly open.
Overall, the chart looks good, and ETH is currently testing the weekly demand zone.
#Ethereum

Short term Bearish ScenarioI’m trying to share ideas to come back and test later. Crypto market took a big hit and while a lot of people are hoping for quick recovery, it is always a good idea to stufy and wait for the market to show what it wants.
Best wishes to everyone out there.

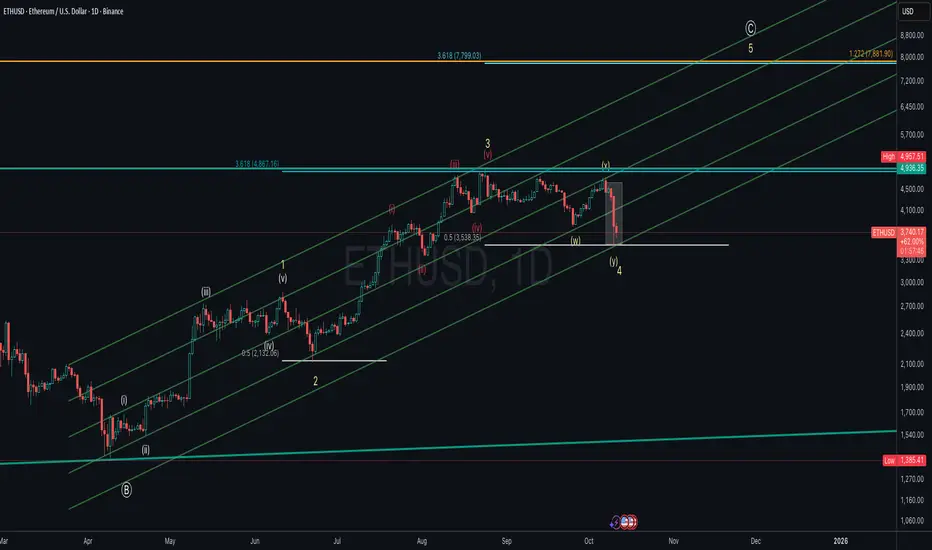
ETHUSD – Wave 4 Correction Near Completion? Preparing for the FiEthereum (ETHUSD, Log Mode) appears to be completing a Wave 4 corrective structure (W–X–Y) within the broader impulsive cycle from the March lows.
Wave 4 found strong support near the 0.5 retracement level around $3,500, aligning with the lower parallel channel of the wave 3 advance.
A potential Wave 5 rally could begin once confirmation of reversal is seen, with upside targets projected at:
$4,867 (3.618 extension of Wave 1)
$7,800–$7,900 (1.272 extension of the macro structure)
If ETH breaks below $3,500, it could invalidate this immediate bullish count and suggest a deeper correction.
Key Levels:
Support: $3,530 / $3,350
Resistance: $4,867 / $7,800
Invalidation: Below $3,500
Watching for signs of a Wave 4 bottom to confirm the start of Wave 5, potentially leading Ethereum into new all-time-high territory in the coming months.
ETH TO 3,054$ WITHIN THE NEXT 7 DAYS!Hi, all
as the title says.......
once BTC hits sub 103k levels, we then should achieve the next target of 2,410-2,198$ within the next 1.5 months MAXIMUM, but I expect it to happen much sooner.
PLEASE SEE LINKED IDEAS FOR CONTEXT and how we have been able to predict the market correctly time and time again and see what others are blinded to.

ETH/USD Navigates Critical Support Amid Bearish PressureETH/USD Navigates Critical Support Amid Bearish Pressure
The ETH/USD price is currently trading around 3826, hovering above the 3700 current support level. Current resistance is at 3850 to 3950 for today. A dynamic resistance trend channel suggests continued bearish pressure overhead. A potential short-term bounce towards the 4000 and 4100 levels is possible. However, if the 3700 current support fails to hold, the price could drop significantly towards 3500.
Disclaimer:
The information provided in this chart is for educational and informational purposes only and should not be considered as investment advice. Trading and investing involve substantial risk and are not suitable for every investor. You should carefully consider your financial situation and consult with a financial advisor before making any investment decisions. The creator of this chart does not guarantee any specific outcome or profit and is not responsible for any losses incurred as a result of using this information. Past performance is not indicative of future results. Use this information at your own risk. This chart has been created for my own improvement in Trading and Investment Analysis. Please do your own analysis before any investments.

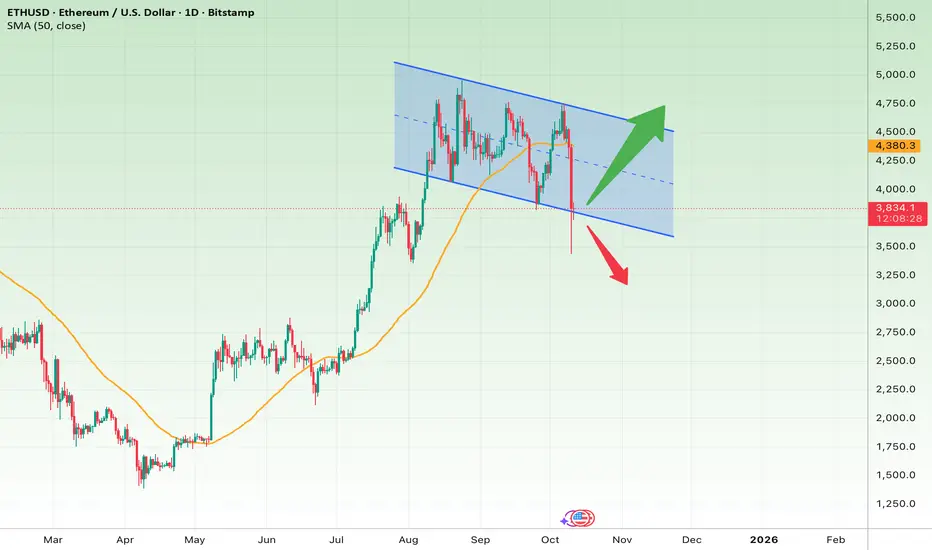
Ethereum at a Turning PointShort-Term Outlook (1–2 Weeks)
Ethereum has been moving inside a descending channel, with recent price action testing the lower boundary. The 50-day moving average (SMA50) around $4,380 acts as strong resistance.
Currently, ETH is trading below that level and close to the lower trendline — a zone of high sensitivity.
If price rebounds and closes above $3,900, a short-term recovery toward $4,250–$4,500 is likely.
However, a daily close below $3,700 would confirm a breakdown, opening the path toward $3,400–$3,200.
Short-Term Setup:
Entry Zone: Above $3,900 after confirmation
Targets: $4,250 → $4,500
Stop Loss: Daily close below $3,700
Long-Term Outlook (1–3 Months)
ETH remains within a medium-term descending channel, showing no confirmed breakout yet.
If it can reclaim and sustain above $4,500, the bearish pattern would be invalidated, and a rally toward $4,800–$5,000 could follow.
But a confirmed breakdown below $3,700 would strengthen the bearish case, potentially leading price down to $3,200–$2,900.
Long-Term Setup:
Bullish Case: Close above $4,500 → Targets: $4,800 → $5,000
Stop Loss: Below $3,900
Bearish Case: Close below $3,700 → Targets: $3,200 → $2,900
Stop Loss: Reclaim above $3,900
Summary:
Ethereum is standing right at a decision zone. The $3,700 level acts as the key pivot — holding it could trigger a rebound toward $4,500, while losing it might mark the start of a deeper correction in the months ahead.
ETH : good short!On October 9, the indicator showed a short signal, after which the price fell by 20%

20K Awaits: ETH reloading before the next runETH is looking very, very strong — there’s a powerful accumulation globally, and to me, it looks extremely bullish. We’re seeing both higher lows and a squeeze toward the $4,400 level. A breakout could be massive.
BUT since the short signals on Bitcoin (wedge + divergence) haven’t played out yet, according to my trading rules, I have no right to even look at longs.
Key support zone: $2,000–2,200.
We could drop to $1,500, but it’s crucial to hold above $2K.
I’m waiting to go long on ETH for the long term — getting the capital ready :)
The potential up to $20,000 is on the table — making a 10x wouldn’t be bad at all.

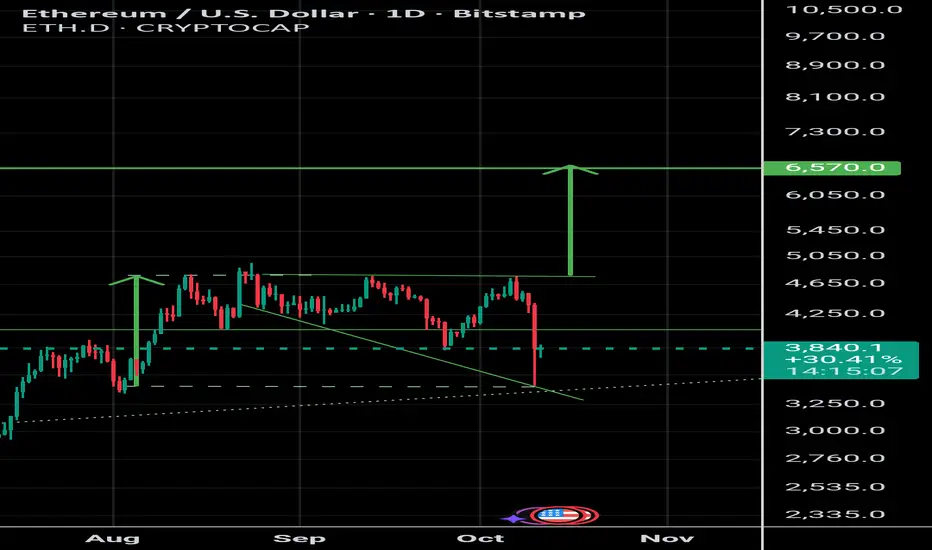
Megaphone pattern eth potentially to go up to.....With this potential megaphone pattern, there is no way the bull run is over.
For eth to pump to geary ATH's, it NEEDED to this correction, or test the diagonal support line.....
As you can see the measurements have been taken, the dotted lines, give an indication where ETH may hit, minimum $6500!!
Any thoughts would be ever so grateful, including constructive criticism.
Further market dynamicsTo date, the market has fully fulfilled its targets at the 3500 retest against the background of brent leaving below 64. Further, until the second half of Sunday, the probability of purchases up to the 4500 retest prevails. An important guideline for further dynamics will be the opening level of the new week and the second half of the month. If these periods open at least above 4,100, the probability of a flat and maintaining the market with the possibility of a breakout next month will remain. With weak purchase dynamics, there is a chance of opening the second half of the month below 4,100. In this case, in any case, we will see purchases before the end of the month for a pullback on the monthly candle, but then the market will consolidate around 3500. The available technical signals currently outweigh the bullish scenario. In this case, individual coins will turn the current month into a bullish one with significant interruptions.
The main contenders for this month's move are MITO VIC BMT HOOK, which are highly unlikely to be contenders for the monitoring tag and are more suitable for medium-term investments. It is also possible to consider scalping in the short term CHESS FIO COS QUICK DATA, which have reached supports and can show a deeper drawdown only when the ether falls below 3500. A signal has been left for a move to the ADX, however, there is a possibility of a deeper drawdown to 0.075-85 before the reversal.

Do Not Miss This...What I assume is a Bull retrace before we trend much higher - Many people will fumble this as they don't believe it's possible - this is going to suck so much $ going forward in 2026 - hard to say if the retrace is over but it can be as it tagged our .382 - anywhere in the box shown is a great entry - if we retrace the whole move this idea is invalidated - send it.
