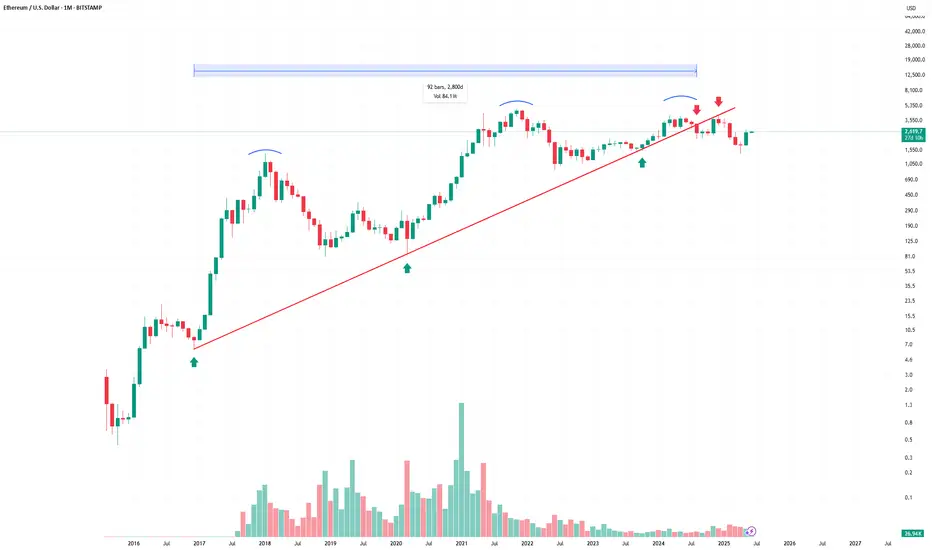
This is why I don't buy Ethereum.This chart shows a clear loss of momentum after a long-term uptrend.
The trendline supported the price for years, confirmed multiple times (green arrows).
Price broke below the trendline and failed to reclaim it (red arrows = rejection).
We're seeing a potential triple top pattern with lower highs (blue curves), a classic distribution signal.
📉 Last candle confirms breakdown structure — lower highs, and now lower lows.
I'm not saying ETH is dead.
But for me, this is not a buy.
Until it reclaims the trendline or shows true strength with a breakout and volume, I'm staying out.
Thanks For Reading.
Trade ideas

ETH/USD eyeing H&S top profit objective!From the daily price of ETH/USD (Ethereum versus the US dollar), price recently engulfed the neckline of a head and shoulders top pattern (extended from the low of US$4,060). Subsequently, it retested the underside of resistance at US$4,217. Should the unit hold resistance, further selling towards the head and shoulders pattern profit objective at US$3,609 could be seen.
FP Markets Research Team

Symplegades Part II – Ethereum at the Threshold of Breakout or B⚔️🌉 Symplegades Part II – Ethereum at the Threshold of Breakout or Breakdown 💥🧭
In the previous post, we explored Ethereum’s mythical challenge — the Symplegades, or Clashing Rocks. That post resonated, and now… here comes Part II.
ETH is once again caught in a narrowing passage, this time defined by:
📌 $2,805 – $2,911 resistance overhead
📌 $2,616 – $2,565 support just below
💡 Pectra could be the fuel to break out — or just another wave that crashes on the rocks. The chart shows the potential for both:
➡️ A clean breakout could spark a move to “Destination 1” (~$4.8K)
⚠️ A rejection here might drag us back under $2.6K, even toward $2.1K and $1.8K zones
The Pectra breakout box is clear. But the market won’t hand it to us easily. It rarely does.
🧠 With Vitalik still “asleep,” it’s a tight spot. But if this move gathers momentum? We could be at the very start of Ethereum’s next wave.
📽️ The full video posted earlier today dives into this thesis and why macro + micro signals are conflicting but critical.
📊 Stay tuned — Bitcoin post is up next.
One Love,
The FXPROFESSOR 💙
Disclosure: I am happy to be part of the Trade Nation's Influencer program and receive a monthly fee for using their TradingView charts in my analysis. Awesome broker, where the trader really comes first! 🌟🤝📈

Ethereum - The $15.000 price target!🚀Ethereum ( CRYPTO:ETHUSD ) will break out now:
🔎Analysis summary:
Looking at the higher timeframe, it is obvious that Ethereum has been consolidating for the past four years. But now, Ethereum is starting to break above the previous all time high. If Ethereum actually confirms the breakout, we are talking about an expected move of another decent +250%.
📝Levels to watch:
$15.000, $4.000
SwingTraderPhil
SwingTrading.Simplified. | Investing.Simplified. | #LONGTERMVISION

Exit Psychology 5/5: Tight vs. LooseNOTE – This is a post on Mindset and emotion. It is NOT a Trade idea or strategy designed to make you money. If anything, I’m taking the time here to post as an effort to help you preserve your capital, energy and will so that you are able to execute your own trading system as best you can from a place of calm, patience and confidence.
This 5-part series on the Psychology of Exits is inspired by TradingView’s recent post “The Stop-Loss Dilemma.” Link to the original post at the end of this article.
Here’s a scenario:
Two traders, same setup. One uses a tight stop. One sets it loose.
The first gets stopped out quickly - several scratches in a row. Frustration builds: “The market keeps hunting me.”
The second holds through the noise, but watches a small loss balloon. Self-talk creeps in: “If I’d cut it sooner, I’d be fine.”
Same market. Different styles. Each trader convinced the other way might be better.
How behaviour shows up with tight vs. loose stops:
Tight stops: Often chosen by traders who value precision and control. The mindset is “I’d rather be wrong small and often than wrong big.” The cost? A series of small cuts that can erode confidence.
Loose stops: Favoured by traders who value patience and the bigger picture. The mindset is “give the trade room to breathe.” The cost? Larger drawdowns and the risk of turning manageable losses into emotional ones.
Neither is inherently better. The choice often begins with trader type - your personality, values and beliefs shape a natural preference for precision (tight) or patience (loose). The trap isn’t in the preference itself it’s when short-term emotions hijack that baseline.
The psychology underneath:
Your baseline style comes from deeper beliefs and tendencies:
Tight stop traders often believe:
“If I’m precise, I can avoid being wrong.”
“Smaller losses hurt less.”
“Control comes from minimising risk quickly.”
Loose stop traders often believe:
“The market needs space to prove me right.”
“One big win will pay for the rest.”
“Patience will protect me from being shaken out.”
But when stress or excitement kicks in, those baseline tendencies can distort:
Tight traders over-tighten - cutting winners short out of fear.
Loose traders loosen further - holding too long out of hope.
The key is to know the difference between what reflects your style and what reflects an emotional trigger.
Why context matters:
Timeframe: Scalpers naturally need tighter stops; swing traders can afford looser ones.
Volatility: Calm markets tolerate precision; wild ones punish it.
Strategy: Breakout systems often need wider buffers; mean reversion thrives on tight control.
Your stop isn’t just about the chart. It’s about who you are, the system you run and the market you’re in.
Practical tips … the How:
Notice your natural bias: Do you lean toward safety through control (tight) or safety through space (loose)? Awareness matters more than labels.
Align your stop style with both your timeframe and your temperament. A system that grinds against your personality will drain your energy.
Review your data: Do tight stops cut you out too soon? Do loose stops bleed too much? Your history holds the clues.
Separate outcome from process: A stop-out isn’t failure - it’s feedback. Tight or loose, consistency beats reaction.
Reframe:
It’s not about tight versus loose. It’s about congruence, between your strategy, the market context and your personality. When those three line up, stops become less about fear and more about discipline.
Closing thought:
Every stop: initial, break-even, trailing, or profit target is really a mirror. It reflects not only your strategy, but also your relationship with uncertainty, control and trust in yourself.
The market doesn’t care how you exit. But your mindset does… as does your account.
Every adjustment, every shift of a stop, every decision to hold or cut, carries both a financial cost and an emotional cost. Learning to see those decisions clearly, is where growth begins and where your odds of staying in the game increase.
A link to Exit Psychology 4/5 : The Profit Target – Certainty vs. Potential
A link to the original article as promised:
This is Part 5 of the Psychology of Exits series.
👉 Thanks for following along ... and for those who have stayed the course with me, there's a bonus wrap up that I'll be writing up today and releasing tomorrow. Stay tuned.
p.s. Apologies if the chart on this post is a little odd. I had to repost this.

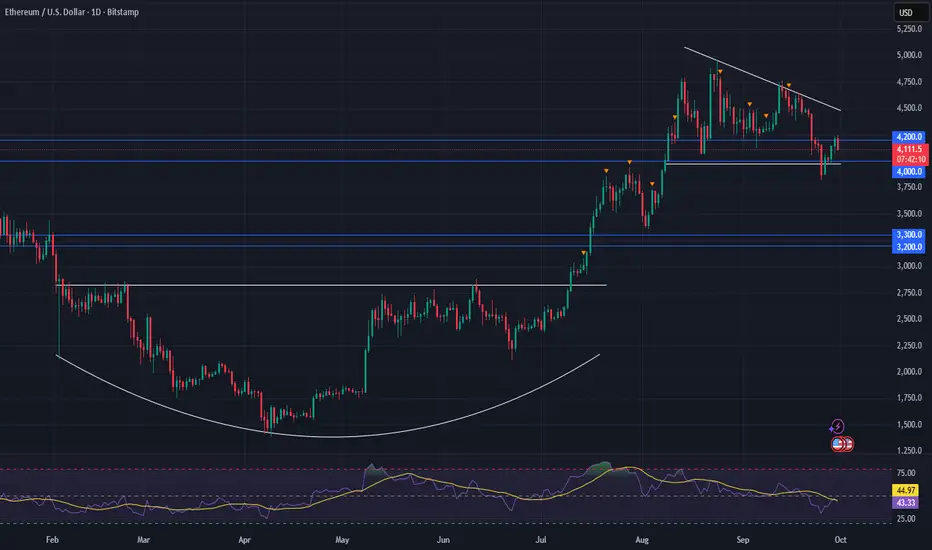
Ethereum Outlook – Key Levels in Play Amid Market JittersAfter a turbulent week across the crypto space—with volatility even bleeding into traditional equities—it's clear just how fragile sentiment remains. We’re seeing the usual overreactions: every minor selloff triggers calls that the bull market is over, despite the broader structure holding up... for now.
🔍 ETH Technical Outlook
Ethereum is retesting a major support zone between 4000–4200. This area has acted as a springboard before, but if it breaks decisively, it could flip to resistance, introducing more headwinds for bullish momentum.
Still, this may be shaping up as another dip-buying opportunity—if macro conditions remain stable and Bitcoin doesn't lead a broader breakdown.
🧱 Next Support Zone
If 4000–4200 doesn’t hold, the next major support zone is 3200–3300. This aligns with previous accumulation levels and would likely draw interest from larger buyers if price gravitates down there.
🔺 Chart Pattern Watch: Triangle Shift
We’ve been tracking a triangle formation, which now appears to be shifting from a symmetrical triangle to a descending triangle—a change in tone, but not yet a deal-breaker for the bulls.
The longer-term target remains intact: we’re still eyeing the 5700–5800 range, assuming structural support zones continue to hold and volume confirms any breakout.
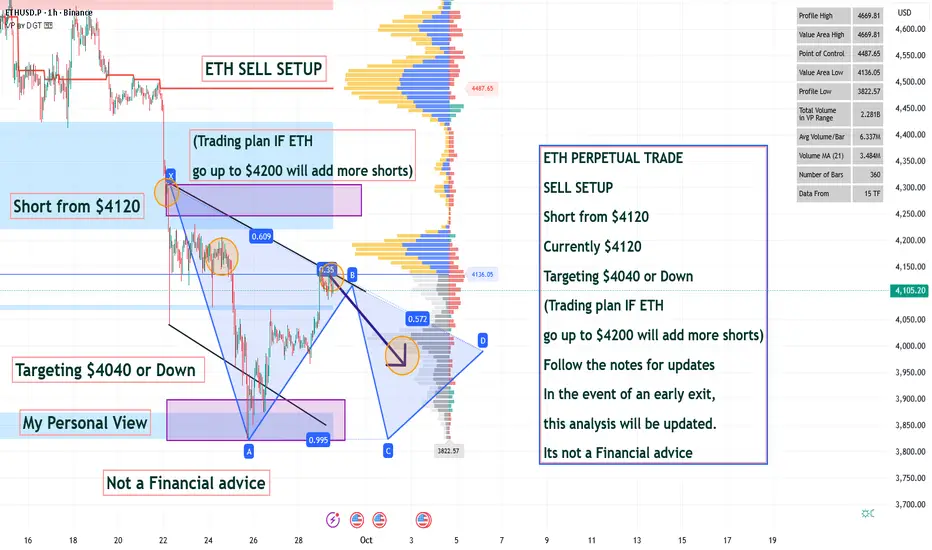
ETH PERPETUAL TRADE SELL SETUP Short from $4120ETH PERPETUAL TRADE
SELL SETUP
Short from $4120
Currently $4120
Targeting $4040 or Down
(Trading plan IF ETH
go up to $4200 will add more shorts)
Follow the notes for updates
In the event of an early exit,
this analysis will be updated.
Its not a Financial advice
ETHUSD supported at 3,975The ETHUSD remains in a bullish trend, with recent price action showing signs of a corrective pullback within the broader uptrend.
Support Zone: 3,975 – a key level from previous consolidation. Price is currently testing or approaching this level.
A bullish rebound from 3,975 would confirm ongoing upside momentum, with potential targets at:
4,290 – initial resistance
4,390 – psychological and structural level
4,460 – extended resistance on the longer-term chart
Bearish Scenario:
A confirmed break and daily close below 3,975 would weaken the bullish outlook and suggest deeper downside risk toward:
3,910 – minor support
3,830 – stronger support and potential demand zone
Outlook:
Bullish bias remains intact while the ETHUSD holds above 3,975. A sustained break below this level could shift momentum to the downside in the short term.
This communication is for informational purposes only and should not be viewed as any form of recommendation as to a particular course of action or as investment advice. It is not intended as an offer or solicitation for the purchase or sale of any financial instrument or as an official confirmation of any transaction. Opinions, estimates and assumptions expressed herein are made as of the date of this communication and are subject to change without notice. This communication has been prepared based upon information, including market prices, data and other information, believed to be reliable; however, Trade Nation does not warrant its completeness or accuracy. All market prices and market data contained in or attached to this communication are indicative and subject to change without notice.

ETH/USD – Bulls Eye 4,687 and 5,000 After Sharp CorrectionETH/USD dropped to 3,824.90 last week, hitting a 2-month low after Fed officials signaled no rush for rate cuts. Strong U.S. GDP growth (+3.8% vs. 3.3% forecast) and sticky inflation reinforced caution, sparking $4B in liquidations and dragging the “fear & greed” index to 28.
Despite this, ETH rebounded toward 4,200.00, supported by:
• ETF inflows rising to $546.9M
• Ethereum DEX volumes jumping from $22.9B → $33.9B
• Token supply shrinking to 2016 lows on institutional accumulation
This backdrop keeps recovery prospects intact.
Support / Resistance
• Resistance: 4,375 – 4,687 – 5,000
• Support: 3,750 – 3,125 – 2,812
Trading Plan
📈 Buy Stop: above 4,375 → TP 4,687 / 5,000, SL 4,130
📉 Sell Stop: below 3,750 → TP 3,125 / 2,812, SL 4,070
Bias: Sideways → bullish above 4,375. Risk of deeper correction if 3,750 fails.

ETHUSD ANALYLTICAL IDEA, FOR 30 SEP, 2025.After the quick fall below $4000, in value, the second in command on the coin market sharply went back to its original position and currently trades around $4100, but the overall direction is bullish as considered the altcoin season. But the question is, will it hold? Or continue pushing above or below well, for now, we can only sit tight on our hands, as my Bias remains bearish for the short term, and I look forward to taking sell trade positions as the price continues to push further in that direction.
As usual, my calls or analysis are based on what we see, the current Bias, and from a probability standpoint, meaning that this projection may be or may not be validated, so tread carefully, and as usual, this is not financial advice, trade responsibly.

#ETH/USDT : Bounce From Support, Eyes on $ 4128#ETH
The price is moving within a descending channel on the 1-hour frame, adhering well to it, and is heading for a strong breakout and retest.
We have a bearish trend on the RSI indicator that is about to be broken and retested, which supports the upward breakout.
There is a major support area in green at 3950, which represents a strong support point.
We are heading for consolidation above the 100 moving average.
Entry price: 4012.
First target: 4050.
Second target: 4084.
Third target: 4128.
Don't forget a simple matter: capital management.
When you reach the first target, save some money and then change your stop-loss order to an entry order.
For inquiries, please leave a comment.
Thank you.

Differences Between Forwards and Futures Trading Introduction
In the vast landscape of financial markets, risk management and speculation are two of the most important forces driving investment strategies. Businesses, investors, and institutions constantly seek instruments that help them manage uncertainty while simultaneously creating opportunities to generate returns. Among the most prominent tools that serve this purpose are derivative contracts.
Derivatives are financial instruments whose value is derived from an underlying asset, such as stocks, bonds, commodities, currencies, or indices. Among the many types of derivatives—options, swaps, forwards, and futures—the last two hold a particularly important place in global finance.
At first glance, forwards and futures contracts appear to be similar: both are agreements to buy or sell an asset at a predetermined price at a specific date in the future. However, the structural and functional differences between the two are significant, and these distinctions make them suitable for different participants, use cases, and risk preferences.
This discussion will dive deep into the key differences between forwards and futures, exploring their characteristics, market structure, risk implications, advantages, disadvantages, and practical applications. By the end, you’ll have a clear understanding not only of the technical differences but also of the strategic role each plays in the global financial ecosystem.
What Are Forwards?
A forward contract is a customized, over-the-counter (OTC) agreement between two parties to buy or sell an asset at a specified price on a future date.
Key features:
Customization: Forwards are tailor-made. Parties can set their own contract size, settlement date, price, and terms.
OTC nature: They are not traded on an exchange. Instead, they are private agreements negotiated directly between buyer and seller.
No daily settlement: Payment occurs only at maturity, not daily.
Credit risk exposure: Since forwards are private deals, there is a chance that one party may default.
Use case: Businesses often use forwards to hedge against price fluctuations in commodities, foreign exchange, or interest rates.
Example:
A wheat farmer in India expects to harvest 100 tons of wheat in six months. To protect against price drops, he enters into a forward contract with a flour mill, agreeing to sell the wheat at ₹20,000 per ton six months later. Regardless of the market price at that time, both parties are bound to honor this deal.
What Are Futures?
A futures contract is a standardized agreement traded on an organized exchange to buy or sell an asset at a specific price on a future date.
Key features:
Standardization: Futures contracts have fixed sizes, maturity dates, and specifications set by the exchange.
Exchange-traded: They are traded on regulated exchanges (e.g., CME, NSE, BSE, ICE).
Daily settlement (mark-to-market): Gains and losses are settled daily. This reduces the risk of large defaults.
Margin requirements: Both buyer and seller must deposit an initial margin with the exchange and maintain variation margin based on daily fluctuations.
Liquidity and transparency: Since they are exchange-traded, futures are more liquid and transparent compared to forwards.
Example:
A trader buys a crude oil futures contract on the NYMEX at $80 per barrel for delivery in three months. If oil prices rise to $90, the trader profits; if prices fall to $70, the trader incurs losses. Daily mark-to-market ensures gains/losses are credited or debited every trading day.
Key Differences Between Forwards and Futures
Let’s break down the main differences across multiple dimensions:
1. Market Structure
Forwards: OTC contracts; negotiated privately.
Futures: Exchange-traded; standardized terms.
Implication: Futures benefit from regulatory oversight and liquidity, while forwards offer customization.
2. Contract Customization
Forwards: Fully customizable (quantity, price, asset quality, settlement date).
Futures: Standardized by exchange (fixed contract sizes, expiry dates, asset quality).
Implication: Corporates prefer forwards for precise hedging; traders prefer futures for liquidity.
3. Settlement Mechanism
Forwards: Settled at maturity (physical delivery or cash).
Futures: Daily mark-to-market settlement.
Implication: Futures reduce credit exposure through daily margining; forwards concentrate risk until maturity.
4. Counterparty Risk
Forwards: Exposed to counterparty default.
Futures: Exchange clearinghouse guarantees contracts.
Implication: Futures are safer for retail and institutional traders, while forwards may expose businesses to greater risk.
5. Liquidity
Forwards: Lower liquidity; contracts are unique.
Futures: High liquidity due to standardized contracts and active trading.
Implication: Futures are better for short-term speculation; forwards suit long-term hedging.
6. Regulation
Forwards: Lightly regulated; depends on private agreements.
Futures: Heavily regulated by exchanges and regulators (e.g., SEBI in India, CFTC in the U.S.).
7. Pricing Transparency
Forwards: Pricing is opaque; available only to contract parties.
Futures: Prices are publicly available in real time.
8. Settlement Type
Forwards: Usually physical settlement.
Futures: Can be cash-settled or physically delivered.
9. Participants
Forwards: Mostly corporates, banks, and institutions.
Futures: Retail traders, speculators, hedgers, and arbitrageurs.
10. Maturity
Forwards: Any date, based on parties’ agreement.
Futures: Fixed maturity dates (monthly, quarterly).
11. Default Risk Mitigation
Forwards: No default protection; depends on trust.
Futures: Clearinghouse acts as counterparty to all trades, ensuring default protection.
12. Cost Structure
Forwards: No upfront margin; but risk exposure exists.
Futures: Require margin deposits and daily variation margins.
13. Flexibility vs. Accessibility
Forwards: High flexibility, low accessibility for retail traders.
Futures: Lower flexibility, higher accessibility due to exchanges.
14. Speculative vs. Hedging Use
Forwards: Primarily hedging.
Futures: Both hedging and speculation.
Practical Examples
Commodity Hedging
Airline companies use forwards to lock in jet fuel prices with suppliers.
Traders use crude oil futures to speculate on price movements.
Currency Hedging
Exporters sign forward contracts with banks to lock in foreign exchange rates.
Speculators trade currency futures on exchanges like CME or NSE.
Interest Rate Management
Corporates use interest rate forwards with banks.
Traders hedge with interest rate futures on treasury bonds.
Advantages and Disadvantages
Forwards
Advantages:
Tailored contracts.
Useful for corporate risk management.
Disadvantages:
Illiquid.
High counterparty risk.
Lack of transparency.
Futures
Advantages:
Standardized and liquid.
Regulated and transparent.
Reduced counterparty risk via clearinghouses.
Disadvantages:
Less customization.
Margin requirements can be costly.
Mark-to-market can cause cash flow volatility.
Applications in Trading and Risk Management
Corporates: Use forwards for precise hedging.
Retail Traders: Use futures for speculation and short-term trades.
Institutions: Use futures for portfolio hedging, arbitrage, and diversification.
Regulatory Aspects
Forwards: Governed by contract law, not heavily regulated.
Futures: Regulated by government authorities and exchanges to ensure fair trading and reduce systemic risk.
Impact on Market Participants
Hedgers: Prefer forwards for customization; futures for liquidity.
Speculators: Prefer futures for leverage and ease of entry.
Arbitrageurs: Futures allow arbitrage between spot and derivatives markets.
Conclusion
Though forwards and futures may seem like two sides of the same coin, their structural differences shape how they are used in practice. Forwards provide flexibility and tailored solutions, making them valuable for corporates with specific hedging needs. Futures, on the other hand, offer standardization, transparency, and reduced risk, making them ideal for traders, institutions, and investors seeking liquidity and safety.
In essence, forwards are personal contracts, while futures are public contracts. Each has its place in the financial ecosystem, and the choice between the two depends on the needs, risk appetite, and market participation style of the user.
ETH/USD: The Levels Nobody’s Talking AboutETH looks quiet… but the chart is coiling around decision zones.
A) A break of $4,606 clears the path to $5,500.
B) A slip below $3,800 opens the door to $3,669, with a deeper risk toward $2,200.
What most traders miss: it’s not about predicting which level hits first… it’s about understanding what those breaks mean for positioning.
I won’t post a full strategy here, but I’ll say this: the difference between smart money and retail is that smart money prepares before these levels break.
Curious to hear; how are you positioning if ETH chooses either path?

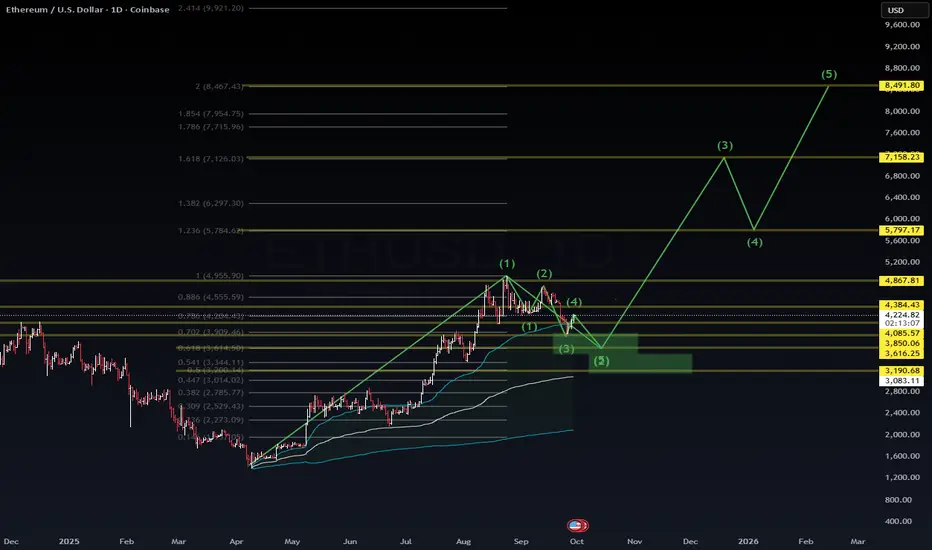
$ETH.X Wave count & Fib levels CRYPTOCAP:ETH 📊 Wave count & Fib levels suggest we could be in the middle of a corrective move before another impulsive leg higher.
✅ Potential accumulation zone highlighted (around $3.6–3.8K).
🎯 Targets: $5.8K → $7.1K → $8.4K if the structure holds.
This is not financial advice — just sharing my personal charting roadmap. Always DYOR and manage risk carefully.
Would love to hear how others are planning their ETH strategy here 👇
#Ethereum #Crypto #ElliottWave
Ethereum Elliott Wave Daily Analysis : Target 4500Ethereum (Timeframe: 4H)
1. Price Action & Trend
The chart shows a completed bearish wave that ended around zone (i) near the $3,700 level.
From this point, Ethereum started a clear upward move with strong bullish candles, suggesting the beginning of a new impulsive wave according to Elliott Wave Theory.
The first expected target for the current move is the key resistance area at $4,500, which represents a major technical level (the previous high .. clear horizontal line).
2. Support & Resistance
Nearest Support: $3,950 – $4,000 pivot zone of the latest bullish move.
Main Resistance: $4,500 both psychological and technical barrier.
3. Supporting Indicators
Momentum: The strong bullish candles reflect renewed buying demand.
Short-Term Trend: Bullish as long as price holds above $4,000.
✍️ Conclusion:
Analysis suggests that Ethereum is in the process of extending its bullish wave, potentially targeting the $4,500 zone in the coming sessions.
Any corrective pullback toward $4,000 remains a critical level to watch
👍 Don’t forget to boost this trading idea if you found it helpful,
and follow me for more daily crypto insights and trade signals.
Please note:
This is not financial advice – I’m only sharing my personal trades.
Always do your own research before taking action.
Best of luck 🌹

ETH/USD - BUILDING MOMENTUM FOR NEXT BULLISH LEGOn the 15-minute ETH/USD chart, we can clearly observe that price action has shifted into a bullish structure after forming a strong impulse move from the lower demand zone. The market respected the higher timeframe liquidity area around 4,140 – 4,150, where buyers stepped in aggressively, creating a solid base for the upward push. From there, a clean series of higher highs and higher lows started to establish, indicating strong bullish momentum in play.
Currently, ETH is respecting the ascending trendline that has been guiding the price upward. Each retest of this trendline has been met with bullish rejections, confirming that buyers remain in control. The price is now consolidating just above the minor supply-turned-demand zone near 4,170, which shows that the previous resistance has flipped into support — a positive sign for continuation.
If the price manages to sustain above this intraday support and trendline, we can expect a potential continuation toward the upside target. Any minor pullback into the demand zone would likely attract buyers again, keeping the bullish structure intact. As long as price stays above the 4,160 zone and does not break below the trendline with strong bearish candles, the bias remains bullish.
Overall, the structure suggests that ETH is preparing for another leg higher, with the projected target in sight. Traders should monitor the price behavior around the support and trendline for confirmation before entering, as clean candle closures above these levels will add confidence to the bullish scenario.

ETHUSD Long Idea: Bullish Break and Retest of Key ResistanceHello TradingView Community,
This post outlines a potential long trade setup on the Ethereum / U.S. Dollar (ETHUSD) pair, based on the 15-minute timeframe.
Technical Analysis:
The chart shows a significant horizontal price level at approximately $4,094.60. This level has acted as a key pivot, serving as both support and, more recently, as a strong resistance zone that capped the price.
We have now seen a decisive breakout above this resistance, which is a strong bullish signal suggesting a potential shift in market momentum. The trading idea is based on a classic "break and retest" pattern. The plan is to look for a long entry on a pullback to this former resistance level, with the expectation that it will now act as new support and provide a base for the next move higher.
Trade Setup:
The long position tool on the chart visualizes a potential trade plan based on this scenario:
Entry: Approximately $4,094.60 (at the retest of the new support).
Stop Loss: $4,007.15 (placed below the key support level to invalidate the idea if the level fails to hold).
Take Profit: $4,432.58 (targeting the next potential area of resistance or a new higher high).
This setup provides a structured plan with a favorable risk-to-reward ratio for a potential bullish continuation.
Disclaimer: This analysis is for educational and discussion purposes only and should not be considered financial advice. Trading cryptocurrencies involves significant risk. Please conduct your own due diligence and manage your risk appropriately.

Ethereum Daily Technical Signal: Buy and Target 4330Ethereum Daily Technical Analysis
Ethereum is currently showing signs of strength as it tests the key resistance level around 4150.
A confirmed 4H candle breakout above this zone could trigger fresh bullish momentum, opening the door for higher targets in the short term.
My Personal Long Setup
If the price breaks and closes a 4H candle above 4150, I will enter a long position.
🎯 Target 1: 4250
🎯 Target 2: 4330
❌ Stop-loss: 4040
👍 Don’t forget to boost this trading idea if you found it helpful,
and follow me for more daily crypto insights and trade setups.
⚠️ Please note:
This is not financial advice – I’m only sharing my personal trades.
Always do your own research before taking action.
Best of luck 🌹
Ethereum outflows point to bullish setup above $4KEthereum outflows point to bullish setup above $4K
Altcoins are surging, and Ethereum has reclaimed the spotlight after crossing the key $4,000 mark. Trading volume is rising, and ETH is holding steady near $4,100 after a relatively calm weekend, suggesting stability following last week’s volatility. Analysts view $4,000 as a crucial support level—if bulls defend it, ETH could soon retest higher levels.
One factor supporting this outlook is a steady decline in Ethereum balances on spot exchanges. A CryptoQuant report shows coins are being withdrawn into self-custody and staking, reducing sell-side liquidity. Historically, such outflows have set the stage for rallies as demand absorbs limited supply.
Short positioning also adds fuel: more than $11 billion in shorts could be forced to cover if ETH breaks above $4,200, potentially accelerating gains.
Still, analysts warn that supply constraints alone aren’t enough—strong buyer inflows are needed to sustain momentum. The next few days will be key, with ETH’s ability to hold above $4,000 serving as a test for the next leg of the rally.
Weak Spot Demand Threatens $4,000 SupportETH/USD is showing signs of fragility as spot market participation weakens. Since September 12, the On-Balance Volume (OBV) indicator has trended downward, highlighting fading buyer demand in the market.
The OBV measures cumulative trading volume by adding volume on bullish days and subtracting it on bearish days. A rising OBV typically reflects strong buyer momentum driving prices higher, while a decline suggests that sellers are gaining the upper hand.
With ETH’s OBV steadily falling, it signals that selling pressure currently outweighs buying activity. This imbalance amplifies downside risks and raises concerns about whether Ethereum can maintain support above the critical $4,000 level in the coming weeks.

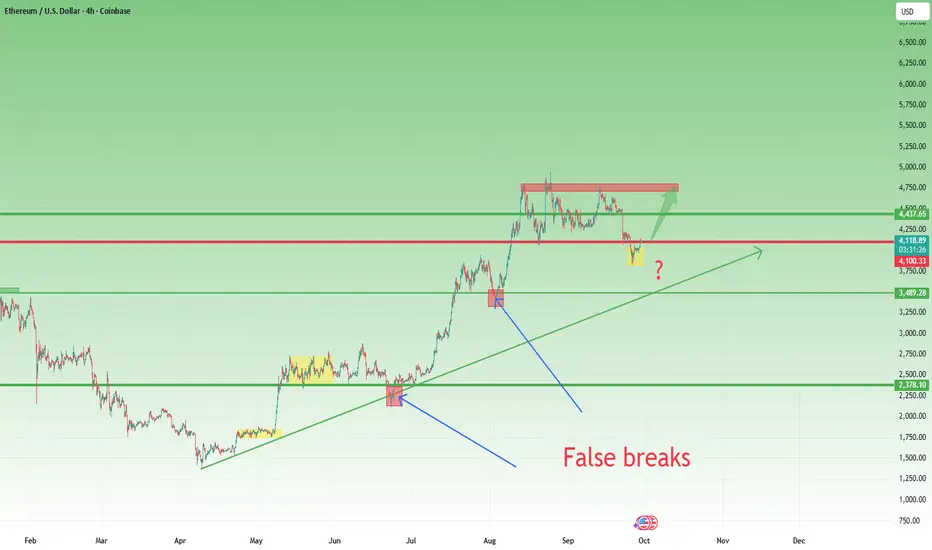
ETH Repeats the Pattern – $4800 Next Target?In my previous ETH analysis, I pointed out that while the price broke below the $4100 technical support and the $4000 psychological level, this move could represent a false break. But for this scenario to be valid, the market needed confirmation.
Since then, ETH has stabilized above $4000 and is now hovering around the $4100 level again.
📌 Looking back at the April rally (from $1400 upwards), we can already identify two similar cases of temporary breakdowns followed by strong recoveries.
• Each time, the market shook out weak hands before resuming the bullish leg.
• This repetition builds the case for another potential rebound, even if no outcome is ever guaranteed.
⚡ Trading Outlook:
• Bullish scenario: I expect ETH to rebound towards the $4400 zone, with the possibility of a retest of the $4800 resistance.
• Invalidation: A daily close back under $4000 would cancel this bullish setup and reopen the downside risk.
• Confirmation: A strong daily close near the highs of the day will add conviction to the bullish continuation.
👉 For now, the structure remains intact, and the bias stays bullish. The key levels to watch are $4000–4100 supports and $4400–4800 for resistance. 🚀
ETH TA 29.09On Thursday, we bounced well from the important zone with HTF divers and are already back above 4k. Now Ether desperately needs to break through the R1 zone of 4215-4250, and then there won't be any important resistances until 4600+. Currently, locally, we're trading sideways at 3980-4200+. Losing the lower boundary of the sideways range is undesirable and very dangerous for further growth, plus there's a good low there, albeit a Voskresensk one. And the nearest decent support is at 3500.
