ETHUSD ShortETHUSD is anticipated to drop from $5k, heading toward its target (TP 1&2), backed by the confirmation of a Crab pattern formation.
Trade ideas

ETH going sub 4k? Ether ABC wave to $3913 or $3431 worst caseEther pushed into 5k and started pulling back.
Looks to be in an Elliott wave "ABC" correction.
Two different sub-4k targets are on the radar.
$4067.17 is the minimum expected retrace.
$3901-3931 is the most likely retest zone.
$3366-3435 is the strongest support nearby.
.
See "Recent Publications" for previous charts such a as this TOP CALL:
Hit BOOST and FOLLOW for more such PRECISE and TIMELY charts.
=========================================================
.

ETHUSD: Financial and Market ReportPremise: This report provides a detailed, professional analysis of Ethereum (ETH), the second-largest cryptocurrency by market capitalization.
Data are sourced from reliable providers such as CoinMarketCap, Etherscan, DeFiLlama, Glassnode, and web research current to 2025.
On-chain data are separated from market analysis and qualitative opinions. Citations are indicated inline for traceability.
Forecasts are based on historical trends and macro scenarios and do not constitute financial advice.
All values are in USD.
1. Asset Overview
Project Summary, Underlying Technology, History and Team / Key Contributors
Ethereum is a decentralized open-source blockchain that serves as a platform for decentralized applications (dApps), smart contracts, and ERC-20/ERC-721 tokens. The underlying protocol has used Proof-of-Stake (PoS) since 2022 (The Merge). ETH is the native network token. The chain supports the EVM (Ethereum Virtual Machine) for executing Turing-complete code.
History: Vitalik Buterin’s whitepaper (2013), ICO in 2014 raising $18.3M in BTC, mainnet launch 30 July 2015 (Frontier). Key upgrades: Constantinople (2019), London (2021 — EIP-1559 fee burning), The Merge (Sept 2022 — PoS, ~99.95% energy reduction), Shapella (2023 — staking withdrawals), Dencun (2024 — proto-danksharding for L2 scalability), Pectra (May 2025 — account abstraction and increased blob throughput).
Core contributors include Vitalik Buterin, Charles Hoskinson (ex-Cardano), and Gavin Wood (Polkadot). Development coordination is led by the Ethereum Foundation (non-profit), with contributions from ConsenSys and a global developer community.
Primary Use Case, Tokenomics and Governance
Primary use case: Layer-1 platform for DeFi (lending, DEXs), NFTs (digital art, gaming), asset tokenization and dApps (social tokens, supply chain). Dominant L1 for smart contracts with >$93B TVL in DeFi.
Tokenomics:
Max supply: Unlimited (no hard cap).
Circulating supply: 120.7 million ETH (as of Oct 2, 2025).
Emission schedule: Post-Merge issuance reduced ~90% to ~972,000 ETH/year (staking issuance). EIP-1559 burns base fees, making supply potentially deflationary during high network activity. Since 2022 4.5M ETH burned; net supply modestly up (+0.8% annualized since 2021).
Governance: Primarily off-chain via community processes (Ethereum Magicians, All Core Devs Calls) and on-chain via EIPs. No centralized control; protocol changes require multi-stakeholder consensus.
2. On‑Chain Data and Economic Metrics
Total Supply, Circulating Supply and 3‑Year Changes
Total supply equals circulating supply (120.7M ETH). From 2022–2025 supply grew ~0.8% annually despite burns, as PoS issuance exceeded burns during low activity periods. Annual snapshots:
2022 (post‑Merge): ~120.2M ETH (+0.2% net).
2023: ~120.4M (+0.17%; 1.7M issued vs 1.3M burned).
2024: ~120.6M (+0.17%; deflationary in Q1, inflationary Q2–Q4).
2025 (Q3): 120.7M (+0.08%; 540,958 ETH issued vs 465,657 ETH burned YTD).
Year Starting Supply (M ETH) Net Issuance (ETH) Burn (ETH) Ending Supply (M ETH) Change %
2022 120.0 +972,000 -1,200,000 120.2 +0.2%
2023 120.2 +972,000 -1,300,000 120.4 +0.17%
2024 120.4 +972,000 -1,400,000 120.6 +0.17%
2025 (YTD) 120.6 +540,958 -465,657 120.7 +0.08%
Sources: Ultrasound.money, Etherscan.
Key On‑Chain Metrics
Active addresses (daily): 553,404 (24h; 2025 avg ~500k).
Daily transactions: 1.82M (24h; 2025 avg ~1.5M; 2022 peak 734k/day).
On‑chain volume: ~$4–5B/day (24h recent).
Average fees: 0.65 Gwei (~$0.06/tx; 2025 average ~$3.78/tx post‑L2).
Staking rate: ~29% of supply staked (35M ETH; ~1M validators).
Usage Metrics
DeFi TVL: $93.493B (Ethereum chain).
Smart contracts deployed: ~41M (historical), ~11B interactions.
NFT metrics: Volume ~$10–15B/year (2025), with peaks on OpenSea (Wyvern protocol).
Economic Indicators
Market cap: $537.23B.
Fully diluted market cap: $536.01B.
MVRV ratio: ~2.4 (elevated unrealized profits; >3.5 = bull extremes, <1 = bear).
SOPR: ~1.05 (slight net on‑chain profits).
NVT ratio: High (~100–150), indicating premium to transaction volume (analogous to P/E).
Holder turnover: Low (~0.1–0.2/yr — HODL behavior).
% held by beacon/exchanges/whales: ~54.6% in Beacon Deposit Contract; top exchanges: Coinbase 4.93M ETH, Binance 4.23M ETH; addresses >1% supply ≈30%.
Sources: Glassnode, CoinMarketCap.
3. Market & Price Analysis
Price Performance (last 12 months) and Notable Historicals
Oct 2024–Oct 2025: price range $1,471 (Apr 2025 low) to $4,831 (Aug 2025 high), ~+35.41% YTD. Average volumes: $45.46B/24h.
2025 performance: +191% from lows, with significant Q1 volatility.
Historical Volatility and Benchmark Comparison
30‑day volatility: ~50–60% (2025), higher than BTC (~40%). Beta vs BTC: ~1.2 (ETH more sensitive to macro shocks). Outperformed crypto index (CMC 200) by ~+15% YTD.
Liquidity and Market Depth
Top exchanges by volume: Binance (5% volume, $2.27B/24h), Bybit ($640M), Coinbase ($566M), OKX ($635M).
Bid‑ask spread: ~0.025% (tight).
Depth: ~$15–16M within ±0.1% price.
OTC desks account for significant institutional flows (~20–30%).
4. Technical Analysis (Brief)
Key Support & Resistance
Daily timeframe: Support $3,900–$4,000; Resistance $4,200–$4,263.
Weekly timeframe: Support $3,825; Resistance $4,600–$4,800.
Indicators & Recent Patterns
RSI (14): 45.7 (neutral; oversold ~34; >50 bullish).
MACD (12,26): Negative (signal bearish momentum but weakening).
Moving averages: Price below EMA 20/50 ($4,263/$4,212), above EMA 200 ($3,500); recent 50/200 death cross.
Price pattern: Sideways channel $3,800–$4,500; potential volume breakout; corrective double zigzag (W‑X‑Y).
Note: Subjective analysis; not trading signals.
5. Fundamental & Network Analysis
Roadmap, Partnerships, Recent Upgrades and Audits
Roadmap emphasizes scalability (Fusaka 2025 for PeerDAS, targeted +10x L2 throughput; Glamsterdam 2026 for Verkle trees). Recent: Pectra (May 2025, account abstraction, EIP-3074 wallet functionality). Integrations with major L2s (Arbitrum, Optimism). Auditing promoted by Ethereum Foundation (examples: SEAL audits); EIP-7907 (2025) introduced DoS protections.
Direct Competitors and Competitive Position
Competitors: Solana (very high TPS, higher revenue but outages), BNB Chain (large active user base, low fees), Polygon (L2/commit-chain). Ethereum remains the dominant EVM-compatible L1 leader for DeFi/NFTs, but faces competition on speed and cost.
Specific Risks
Smart contract vulnerabilities (reentrancy, oracle manipulation — e.g., Penpie hack 2024 ~$27M).
Regulatory risk (token utility classification, scrutiny of staking/ETFs).
Centralization concerns (54.6% in Beacon Deposit Contract; top addresses concentration; centralized L2 sequencers).
Dependence on external oracles and bridges (single‑point failures, bridge exploits).
Sources: Ethereum whitepaper, audit reports, industry articles.
6. Outlook & Scenarios
Qualitative Forecasts (1–3 years)
Conservative (2026–2028): $6,000–$8,000 (slower adoption, tighter regulation).
Base case: $10,000–$12,000 (DeFi/NFT growth, ETF inflows ~$27.6B; burn > issuance during high activity).
Optimistic: $15,000+ (strong institutional adoption, Fusaka delivering throughput; TVL >$150B, staking 40%).
Trends: increased corporate staking ($7.65B), L2 scalability, RWA tokenization.
Primary Drivers
Positive: ETF inflows, scalability upgrades (PeerDAS), increased DeFi/NFT adoption, macro crypto bull cycles.
Negative: L1 competition (Solana revenue growth), low network activity (burn < issuance), regulatory/tax developments.
Risk Mitigation Strategies
Diversify into L2s and select competing L1s.
Use hardware wallets for custody; split staking from hot wallets.
Employ multiple oracles and require audits before contract deployment.
Use stop‑losses for volatility; stake portion (20–30%) for yield (3–5%).
7. Conclusion & Recommendations
Risk/Reward Summary
ETH offers high upside potential (possible +100% over 1–3 years) due to DeFi dominance and structural deflation mechanics, but carries high risk (~50% volatility, regulatory and smart contract threats). Risk/return profile: high, suited to risk‑tolerant investors.
Operational Recommendations
Investors: accumulate under $4,000 for long‑term hold (1–3 years); take‑profit target $6,000 (2026); stop‑loss $3,500.
Holders: stake 20–30% to earn yield; monitor MVRV <1 as accumulation signal. Time horizon: mid‑term bull (2026+).
Strengths & Weaknesses
Strengths: mature ecosystem (TVL $93B), L2 scalability path, EIP‑1559 deflationary mechanism potential.
Weaknesses: higher base‑layer fees, staking centralization, oracle/bridge dependencies.
Sources: CoinMarketCap, Etherscan, Glassnode, Ethereum.org, DeFiLlama, CoinDesk, arXiv, CryptoSlate.


ETHEREUM LOCAL SHORT|
✅ETHUSD rejected a premium supply level, showing displacement after inefficiency fill. Order flow signals bearish intent, with liquidity below 4,320$ likely targeted for rebalancing. Time Frame 8H.
SHORT🔥
✅Like and subscribe to never miss a new idea!✅

ETH/USD (Ethereum vs US Dollar, 4H chart):ETH/USD (Ethereum vs US Dollar, 4H chart):
Current price is around 4,391.
Chart shows a breakout above the descending trendline and the Ichimoku cloud, suggesting bullish continuation.
My marked two target points on your chart.
📍 Target 1: Around 4,700 – 4,720
📍 Target 2: Around 4,850 – 4,880
👉 So, based on my setup, ETH has two bullish targets: first near 4,700 and then around 4,850.

Ethereum (ETH) Bulls Drive Towards 4500 Flip ZoneEthereum (ETH) Bulls Drive Towards 4500 Flip Zone
Ethereum (ETH) has shown a strong bullish recovery on the 4-hour chart, bouncing robustly from the "3850 key level" and the "4000" support zone, now trading at 4,392 within an ascending channel.
The price is currently challenging the immediate resistance around the "4500 Flip Zone," which represents a crucial hurdle for the continued upward momentum.
In case of a retracement from current levels, the "4200" mark serves as immediate support, aligning with the lower boundary of the current ascending channel.
Maintaining price action above the "4000" support level is essential for the bullish structure, with the "4800 to 4900 Sell Order Block" looming as the next significant resistance above the "4500 Flip Zone."
Disclaimer:
The information provided in this chart is for educational and informational purposes only and should not be considered as investment advice. Trading and investing involve substantial risk and are not suitable for every investor. You should carefully consider your financial situation and consult with a financial advisor before making any investment decisions. The creator of this chart does not guarantee any specific outcome or profit and is not responsible for any losses incurred as a result of using this information. Past performance is not indicative of future results. Use this information at your own risk. This chart has been created for my own improvement in Trading and Investment Analysis. Please do your own analysis before any investments.

ETHEREUM (ETHUSD): Time to RecoverIt appears that a confirmed bullish reversal is evident on the 📈Ethereum, following a test of a significant daily horizontal support level.
The formation of an ascending triangle pattern, coupled with a subsequent violation of its neckline, suggests a strong bullish signal.
I believe that the price may soon reach at least the 4,400 resistance level.

EthereumETHUSD
- Completed " 12345 " Impulsive Waves and " AB " Corrective Wave
- Order Block
- Fair Value Gap
- Resistance Level
- Fibonacci Level - 78.60%

$ETH mega run is loading.
Ethereum has experienced nearly identical scenarios across three distinct market cycles.
• 🔓 Major Resistance is breaking
• 🔁 Before Running Retest
• 💥 And then Parabolic run
We are currently in the third cycle, and Ethereum has again tested the same horizontal level. In the previous two cycles, this movement was followed by a parabolic run.

ETH 02.10#ETH
Ether doesn't care about any resistance right now, and there's nothing holding it back until it reaches the liquidity zone and the upper limit of the range around 4700. The HTF can't afford to lose 4200. There's plenty of local liquidity at 4280, and 4300 is the fair value (POC) zone in the range since August. We might struggle here for a while if they don't allow a direct expansion to 4700 without any pauses.
Support zones:
4268-4280
4200-4230
Resistance zones:
4456-4480
4660-4724
4768-4780

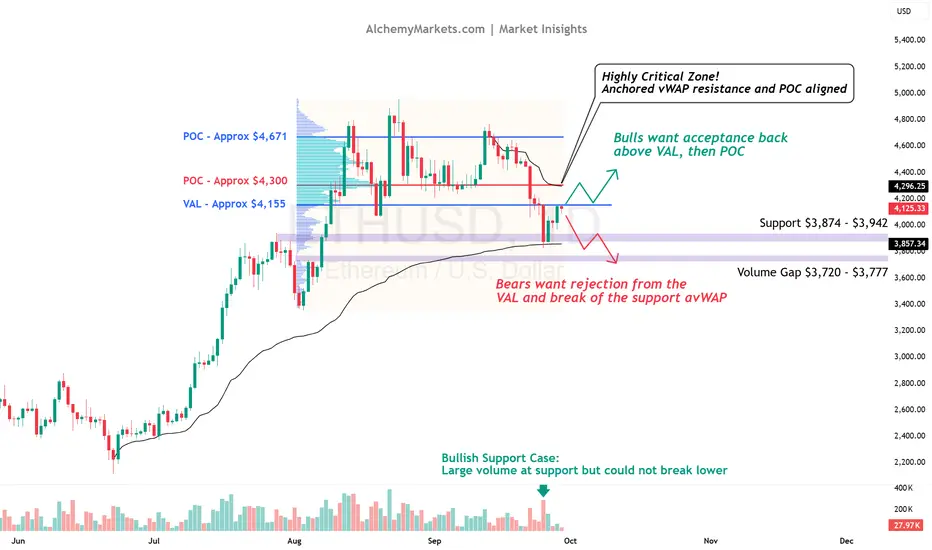
Ethereum Simple Analysis: Back to $4,000 or $4,300 next?After dropping from $4,700, ETH has actually held up better than BTC.
Now it’s sitting at a key decision point — retesting the Value Area Low (VAL) at $4,155, which marked the base of August’s rally from $3,400 to $4,900.
The bigger picture still leans bullish. ETH is holding above the anchored vWAP from July (~$3,857), the average entry point of that entire rally. Staying above means the market is still backing the trend. Lose it, and sentiment flips.
📌 Levels to watch:
$3,857 (anchored vWAP support)
$4,155 (VAL battleground)
$4,300 (critical resistance)
$3,720–$3,777 (volume gap support)
The fight now is simple:
Reject $4,155 → confirms weakness, ETH stays trapped under resistance.
Reclaim $4,155 → opens the door to rotate higher, with $4,300 as the real test.
Why $4,300? Because it’s both the Point of Control (POC) and anchored vWAP from the latest decline - meaning that it's both the most traded price level AND the average price since its decline.
Key takeaway: We are currently testing key resistance. Watch closely for a reaction and if we reclaim $4,155, expect the real test at $4,300.
ETH FORECAST Ethereum daily time frame is gearing up to flow into the bullish cycle. The bullish flag pattern comes into previous resistance and fails to break lower holding above price turning it into support. This suggest strong bulls holding price and a breakout of the bull is flag shall fuel the continuation higher to 5500

EthLooks bullish in the next few weeks could see 6k or higher by November or December possible bullish flag what u think

ALMOST ALT SEASON!? The September monthly close is in — and October could bring some huge moves.
Here’s what I’m expecting:
- A short-term bounce in October on BTC, ETH, and Total Market Cap
- Possible new highs on altcoins before the real move lower
- BTC pushing toward 100K and ETH higher in the short term
- A major collapse after the bounce, creating fear but also the best (and possibly last) big buying opportunity before altseason
This is where patience and planning matter most. I break down the charts using ICT concepts to show exactly what I’m watching on BTC, ETH, and the broader market.
👉 Do you think we get a pump first in October, or straight into the collapse? Share your thoughts in the comments.
#Crypto #Bitcoin #Ethereum #Altseason #CryptoAnalysis #ICTTrading #BTC100K

Eth/Usd - Bearish Reversal After Resistance Rejection This chart shows the recent price movement of Ethereum (ETH) against the U.S. Dollar on the 15-minute timeframe. The market initially found strong support in the green zone at the bottom, where price reversed and started moving upwards. This area marked the beginning of a bullish trend, confirmed by breaks of structure (BOS) and a change of character (CHoCH)—indicating a shift from bearish to bullish momentum.
Following this, ETH made a strong bullish move, breaking past previous highs and entering a resistance zone marked in blue. However, once price entered this resistance area, it began to slow down and form what is labeled a “Weak High”, meaning buyers were losing strength and struggling to push price higher.
The chart highlights a potential short trade setup: If a candle closes below the marked support level just under the resistance zone, it would suggest the start of a bearish move. In that case, the suggested trade is to enter a short position and aim for the lower support area (target zone) where the price may again find demand.
This setup reflects a possible trend reversal from bullish to bearish in the short term, especially if price fails to maintain above the resistance and breaks the nearby support.

ETHUSD NEW OUTLOOK According to H1 analysis ETHUSD market is almost at SUPPORT LEVEL so it is the best opportunity to go long from support level market will be fly from here dont bee greedy use money management
TRADE AT YOUR OWN RISK
REGARD ALBERT

Ethereum in a blazing October bull flag | The explosion is here!You’re making a mistake if you’re only looking at the chart!!
Because Tom Lee does not see a 10x jump based on that.
Don’t let technical analysis mislead you.
Indicator
Ethereum: Exchange Reserve – All Exchanges
Shows us the largest Ethereum withdrawals from exchanges — the supply shock, just like with Bitcoin, is here.
Indicator
ETH: Balance on Accumulation Addresses
27,700,000 ETH accumulated that will never be sold.
The M2 indicator shows us that liquidity is pushing us upward.

ETH Macro analysis and current cycle targets of $16k-20KI’ve been invested in Ethereum since 2020. Along the way, I took some profits above $4,000 and later rebuilt my position around $1,650. My conviction is rooted in direct experience—after 23 years working in IT, I clearly see both the strengths and limitations of the technology.
What I recognized back in 2020—its dominance, brand recognition, the credibility of its founder, and the trust it commands—is only now becoming clear to the broader market. This is reflected in the growing wave of ETH-based treasury products and institutional adoption.
For me, DeFi was never the main driver. While it has been an important use case, I believe Ethereum’s long-term value will come from its network dominance and trust, which will inevitably extend across multiple industries and verticals.
The logarithmic price chart of ETH since its inception illustrates this well. Historically, each cycle has peaked at roughly 3.4x the previous cycle’s high. If that pattern continues, it aligns with the upper band of the long-term log channel—suggesting potential in the $16K–$20K range during the next cycle.
I don't overthink; I go with what I see and what I know to be the macro trend.
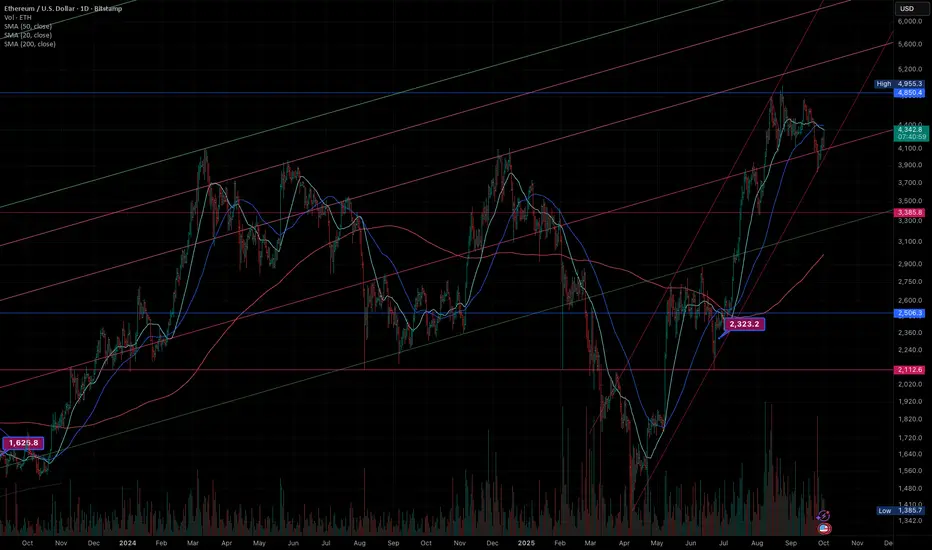
Eth to 10kEth looks to have broken out of its consolidation range. I prefer direct exposure and am also in BMNR. I believe this 4 year cycle will be broken and this cycle actually goes on much longer than people think. Eth has real use cases that are metalizing before our very eyes.

ETH/USD — Elliott Wave Setup Points to $6K or Breakdown at $4400Ethereum is trading near $4308, consolidating just below heavy resistance at $4400–$4600. Order book heatmaps show massive liquidity stacked here, while support thins around $3800–$4000. A break above could trigger a large-scale short squeeze — nearly $13.22B in shorts sit at risk around $4700.
Wave Structure
• Wave iii peaked at $4612 (78.6% Fib).
• Wave iv bottomed at $4061 (23.6% Fib).
• Next extension targets: $5233, $5815, $6406.
• Long-term Fibonacci extension: $6922.
Funding & Sentiment
Funding rates have normalized after swinging negative in September. Neutral positioning reflects market indecision: breakout or deeper retrace.
Key Levels
• Resistance: 4400–4600, 4700, 5233, 5815
• Support: 4061, 3800, 3665–3374
Trading Plan
📈 Long above 4600 → Targets: 4700 / 5233 / 5815 (SL 4300)
📉 Short below 4060 → Targets: 3800 / 3665 (SL 4220)

ETH Recovery Underway: Momentum Building!ETH Recovery Underway: Momentum Building!
Ethereum (ETH) is currently showing signs of a potential bullish reversal on the 4-hour timeframe. After a significant correction from the 4800-4900 "Sell Order Block" and breaking down through the 4500 "Flip Zone," ETH found strong support around the 3850 key level.
From that low, we've observed the formation of an ascending trendline, indicating a series of higher lows and a gradual recovery in buying interest. The price has successfully climbed back above the 4000 psychological support level and is now testing a more immediate resistance zone, as indicated by the smaller gray box.
A decisive break above this current resistance, potentially pushing towards the 4500 "Flip Zone" again, would significantly strengthen the bullish case. However, maintaining price action above the ascending trendline and the 4000 level is crucial to sustain this recovery momentum. Failure to hold these levels could see ETH retesting the 3850 key support.
Disclaimer:
The information provided in this chart is for educational and informational purposes only and should not be considered as investment advice. Trading and investing involve substantial risk and are not suitable for every investor. You should carefully consider your financial situation and consult with a financial advisor before making any investment decisions. The creator of this chart does not guarantee any specific outcome or profit and is not responsible for any losses incurred as a result of using this information. Past performance is not indicative of future results. Use this information at your own risk. This chart has been created for my own improvement in Trading and Investment Analysis. Please do your own analysis before any investments.

U.S. Government shuts down; Crypto rallies on uncertaintyU.S. Government shuts down; Crypto rallies on uncertainty
The U.S. government officially shut down on October 1, 2025, after Congress failed to agree on a budget. Disputes over spending and healthcare left agencies including the Fed, SEC, and CFTC paralyzed, delaying jobs and inflation data as well as ETF approvals for Solana and XRP.
Bitcoin, Ethereum, and other cryptocurrencies gained on Wednesday, with ETH up 4.2% to $4,330. Analysts said digital assets may be benefiting from pressure on the U.S. dollar, often seen as a trigger for crypto inflows.
Still, a prolonged shutdown could stall Fed rate-cut hopes by blocking key data releases. With borrowing costs already high, cryptos could face headwinds if the impasse drags on.
