The altcoin season begins with Ethereum ┆ HolderStat🔁 Wallet 0xc005…5f7 rotated via Binance: sent 851k USDT to the exchange, then withdrew 116.68 ETH (~$515k) back day later. DefiLlama shows ETH/L2 net inflows outpacing stable hoarding today—classic risk-on rotation. Expect on-chain deployment into majors or high-liquidity blue-chip alts next.
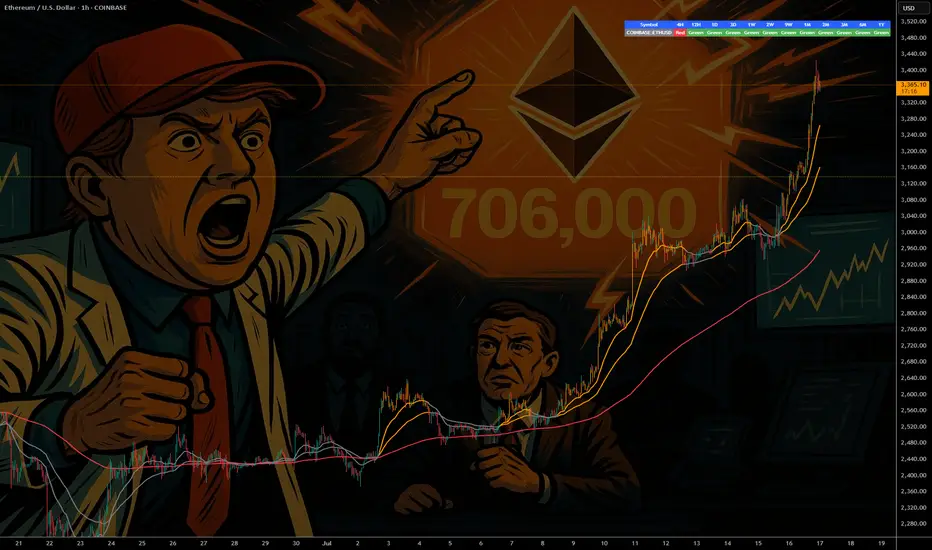
🔝 Score: 21 | Balance: ~$500k | Results: $49.3k→$756.5k (+1,535%, 16 trades; avg buy $830 / sell 3,613; age 67m; rating 136).
ETHUSD trade ideas

short-term ETH (Ethereum) analysis1. Current Price Structure
ETH is consolidating after a strong upward move.
A descending triangle pattern is visible, showing lower highs compressing toward flat support.
Price is sitting near $4,750–$4,800 zone, with weakening momentum.
2. Bearish Short-Term Path
Chart projection suggests ETH may first break down from the triangle.
If this occurs, ETH could fall toward the $4,100–$4,200 zone (green line marked).
This aligns with the previous strong breakout level, which now acts as major support.
3. Bullish Recovery Path
After testing support near $4,100, a sharp reversal bounce is possible.
If that happens, ETH could rally back quickly toward $4,800–$5,000 first, and then attempt a move toward $5,400–$5,500.
This scenario matches the V-shaped recovery projection drawn in red on the chart.
4. Short-Term Outlook
Bearish bias in the immediate term (due to descending triangle breakdown risk).
Bullish medium-term recovery remains valid as long as ETH holds above $4,000–$4,100 support.
The key level to watch short-term: $4,650. A clean break below opens the door for a deeper correction.
✅ Conclusion (Short-Term View):
ETH looks vulnerable to a near-term dip toward $4,100–$4,200, but this zone is expected to act as a strong demand area. From there, a sharp bullish reversal toward $5,000+ is possible. Traders should be cautious of the short-term breakdown but prepare for a recovery swing from major support.
Disclaimer:
This analysis is for educational and informational purposes only and should not be considered as financial advice. Trading and investing in cryptocurrencies involve significant risk, including the potential loss of capital. Please conduct your own research and consult with a qualified financial advisor before making any trading or investment decisions.

demand and supply ETH creating a new ATH
the minor demand zone did not hold, turning it into supply for me, anticipating a pullback to strong demand...
this means that am anticipating price will fall to the the new HL

ETHEREUM Strong Support Ahead! Buy!
Hello,Traders!
ETHEREUM is falling down
Now but as it is trading in a
Strong uptrend we are
Bullish biased so after it
Hits the strong horizontal
Support level below at 4,000$
A strong bullish rebound
Is to be expected
Buy!
Comment and subscribe to help us grow!
Check out other forecasts below too!
Disclosure: I am part of Trade Nation's Influencer program and receive a monthly fee for using their TradingView charts in my analysis.

ETH Eyes $4,800–5,000Hello traders,
ETH is currently trading around $4,233 after bouncing from the $4,000 zone. The uptrend remains clear: consecutive higher highs and higher lows, with Fair Value Gaps (FVGs) filled during the upward moves and then expanding further, indicating strong trend-following capital. On the Ichimoku chart, the price stays above the cloud and often rebounds from support zones – a sign that the uptrend has not weakened.
The nearest resistance lies around $4,400–4,500 (August highs). If ETH decisively breaks through, there is ample room for gains toward $4,800–5,000. Key support is at $4,000–3,950, but the uptrend remains dominant as long as this zone holds.
From a news perspective, capital is flowing into altcoins while Bitcoin consolidates, giving ETH an advantage. Market sentiment is also supported by expectations of a potential approval of a spot ETH ETF by year-end – a move that is both symbolic and likely to attract new capital. Fundamentally, Ethereum 2.0 upgrades, Layer 2 ecosystem developments, and fee optimizations continue to enhance user experience, providing a solid foundation for a medium- to long-term bullish trend.
Stay tuned and leave your comments below to share your thoughts on ETH’s next move!

Etherium is about to fly towards 8kEther currently is witnessing a pullback, but soon this will change .

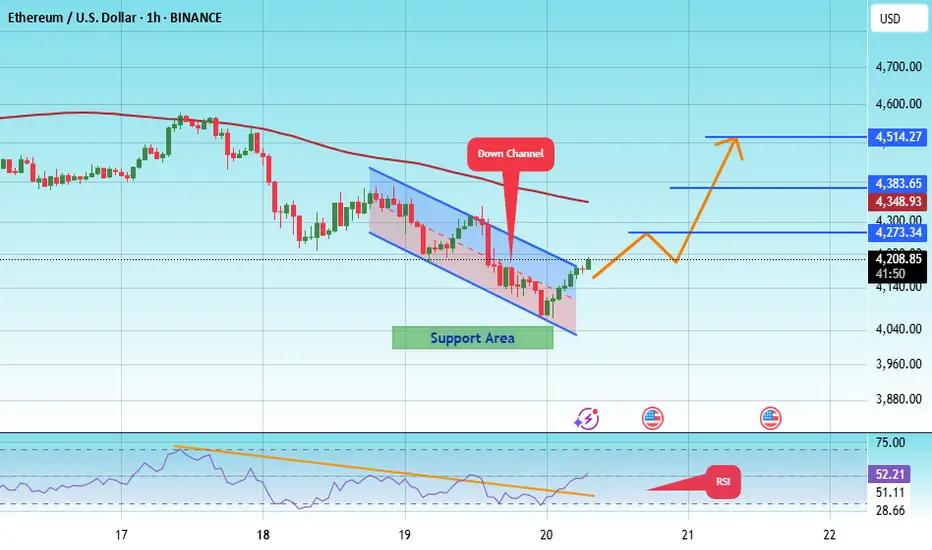
#ETH/USDT Breaks Below Recent Triangle Structure !#ETH
The price is moving within an ascending channel on the 1-hour frame, adhering well to it, and is on track to break it strongly upwards and retest it.
We have support from the lower boundary of the ascending channel, at 4040.
We have a downtrend on the RSI indicator that is about to break and retest, supporting the upside.
There is a major support area in green at 4000, which represents a strong basis for the upside.
Don't forget a simple thing: ease and capital.
When you reach the first target, save some money and then change your stop-loss order to an entry order.
For inquiries, please leave a comment.
We have a trend to hold above the 100 Moving Average.
Entry price: 4203.
First target: 4273.
Second target: 4383.
Third target: 4514.
Don't forget a simple thing: ease and capital.
When you reach the first target, save some money and then change your stop-loss order to an entry order.
For inquiries, please leave a comment.
Thank you.

ETH Short term & Leveraged traders; The 4273 fib needs to hold.This golden fib is important. ETH is rising in a bearish pennant / wedge which can attack the 4273 fib, unless 4400 & 4488 are retaken. I expect a possible sweep up to collect bullish orders and shake shorts, then down. Again - this is invalid and I may shift bullish if 4488 is retaken.

ETH ATH scalpTrade is simply, ETH is about to break ATH and draw in massive amounts of breakout traders, we buy here taking more risk to sell to them later.
Use stops, patience and good luck.
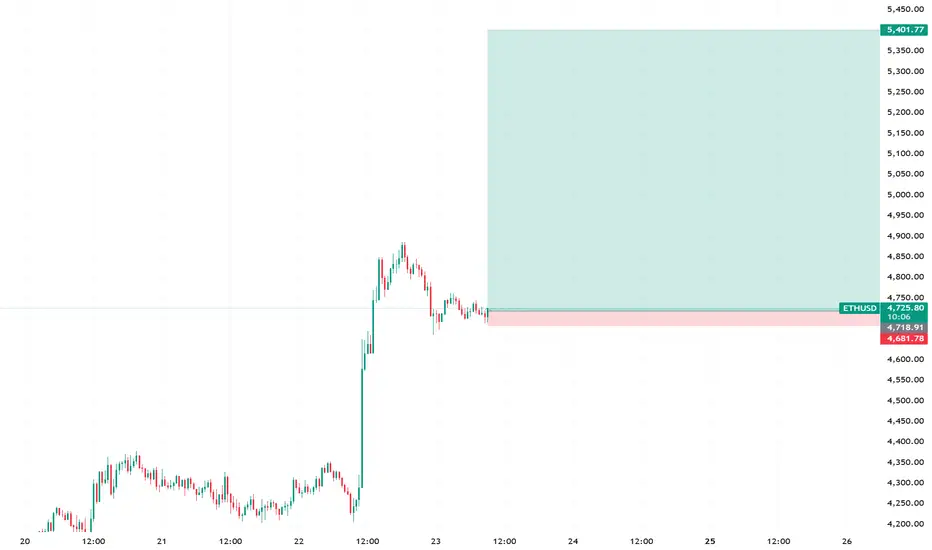
(ETH/USD): Bullish Breakout and Upside Target AnalysisThe Ethereum (ETH/USD) 15-minute chart shows a bullish breakout after the price broke above a descending trendline and a consolidation zone. This suggests upward momentum with a potential target near $4,845. Support levels around $4,755 serve as a stop-loss zone to manage risk. The setup indicates a favorable risk-to-reward trade opportunity for short-term gains.
Disclaimer: Trading cryptocurrencies involves significant risk and is not suitable for all investors. Past performance does not guarantee future results. Always conduct your own research and use risk management strategies before trading.

ETH BUY SETUP ,Bought From $4267ETH BUY SETUP
Currently $4267
Bought From $4267
Stop loss $3800
(Trading plan If ETH go down ,
to $4200 will add more longs)
Expecting target $4360 OR ABOVE
In the event of an early exit,
this analysis will be updated.
Its not a Financial advice

ETHUSD goes up today but...ETHUSD went up due to Powell's speech this morning, but i would go with the bigger picture, the weekly chart showed A-B-C correction up is done, also the strong movement failed to break previous top, so i could be determined as correction or consolidation.

S&P 500 on the Edge – Crypto Awaits the Signal📉📊 S&P 500 on the Edge – Crypto Awaits the Signal 🧠⚠️
Hey Traders! Quick note before we dive in — apologies for the audio quality in this update 🎙️. I had the wrong mic set up (classic move!), but the charts are what matter, and we’ve got some serious levels to respect.
🔙 Back from the Holidays – Still All In
Mid-August is a special time here in Cyprus and Greece, and I took a well-deserved breather with family and friends. But rest assured, I haven’t been idle — behind the scenes, I’ve been working intensely on indicators to elevate my TradingView game — and why not yours too, eventually? 😉
(Just to be clear: no advertising, no selling — just sharing my process and market views, as always.)
📌 The Big Picture – S&P 500
We’re back at that critical level: 6432 .
✅ Above = market stays optimistic
❌ Below = correction risk increases, likely toward 6223
Right now, the odds lean 41% upside / 59% downside , and considering we’re at all-time highs, caution is wise. Buying ATHs is never the best strategy unless confirmed by momentum.
🪙 Bitcoin – Caught Between Key Levels
BTC is sandwiched between two key zones:
🔺 Reclaiming 116,525 = bullish signal
🔻 Losing 115,000 = exposes downside to 110,000
This is a true 50/50 — stuck below a broken ascending channel and flirting with a violated S/R level. Stay reactive, not predictive.
💪 Ethereum – The Strongest Major
Ethereum continues to outperform. Today we didn’t catch the day-trade long, but the 4,210 level is major support.
ETH market dominance is rising steadily — the charts reflect it.
🧩 Altcoin Insights
- ARB : Reclaim 0.54 for possible move to 0.76
- XRP : Key support at 2.93 . Break higher? We could see 3.33+
- ADA : Watching 0.87 support. Below that? Caution.
Market-wide, TOTAL and altcoins are still sluggish. Until momentum returns, tactical plays > emotional ones.
🧠 Summary:
- 📍 S&P 500 is the key signal.
- 📉 BTC & ETH stuck, waiting on that SPX cue.
- 📊 ETH leads the pack — but patience is key.
- ⚖️ Altcoins are mixed, respect your levels.
This market is full of potential — but clarity comes from levels, not guessing. Let’s trade smart. 🔍
One Love,
The FXPROFESSOR 💙
Disclosure: I am happy to be part of the Trade Nation's Influencer program and receive a monthly fee for using their TradingView charts in my analysis. Awesome broker, where the trader really comes first! 🌟🤝📈

From Cold Calling to Whitepapers: Same Game, New ToolsRemember that legendary scene in "The Wolf of Wall Street"?
Jordan Belfort (DiCaprio) picks up the phone to pitch “Aerotyne International” — a company “poised to explode” — operating from… a garage.
The sales pitch is flawless. The story is strong. The potential? Unlimited.
Except it was nothing more than a fantasy designed to move shares from one set of hands to another — at a profit for the seller.
There is a Romanian saying: "Same Mary, different hat"...
________________________________________
Fast forward to crypto
Today, we don’t have cold calls and penny stock brochures.
We have:
• Whitepapers describing revolutionary technology with no working product.
• Influencer threads promising “undervalued gems” to millions of followers.
• Slick promo videos replacing the boiler room pitch.
• Discord AMAs instead of dinner seminars.
The garage is still there — it’s just virtual now, hidden behind a Twitter banner and a Telegram admin.
________________________________________
Human psychology hasn’t changed
The tools evolved, but the emotions stayed the same:
• Greed — “I don’t want to miss the next big thing.”
• Fear — “If I don’t buy now, it’ll be too late.”
• Trust in authority — “He has a big following, he must know.”
Belfort sold the dream of massive returns.
Modern-day devs and influencers sell the dream of “generational wealth” from coins that exist only as code on a blockchain.
________________________________________
The mechanics are identical
1. Create a story.
2. Amplify it through trusted voices.
3. Target an audience hungry for “the next big thing.”
4. Offload the asset onto those late to the party.
Whether it’s “Aerotyne” or “MoonPepeMooning,” the pattern is the same — transfer value from the hopeful to the prepared.
________________________________________
How to not be the exit liquidity
• Verify: A whitepaper is just words. Look for a product, adoption, and revenue.
• Ignore the hype cycle: By the time it reaches you, someone else is unloading.
• Follow the money: Who benefits if you buy right now?
• Remember history: Tools change, human nature doesn’t.
________________________________________
Bottom line:
Cold calling in the ’90s or a viral thread in 2025 — it’s still a sales pitch.
The sooner you recognize it, the less likely you are to fund someone else’s yacht. 🚀

ETH, what price target at the end of the cycle?1) Institutional investors have driven ETH/USD higher since the start of the summer via US spot ETFs
The price of ETH/USD has more than doubled since the start of the summer on the crypto-currency market, in a phase of powerful relative catch-up with the price of bitcoin and an Ether token that is now close to its all-time record. This catch-up phase of the Ether token relative to BTC has been forged on a very healthy fundamental factor: institutional demand.
In fact, it is institutional investors who have driven this sharp rise in the price of Ether, with an explosion in inflows to US spot ETFs on Ethereum. Indeed, it's a given that the bulk of demand via BTC and ETH spot ETFs comes from institutional investors.
Ethereum's underlying uptrend is therefore based on a sound fundamental foundation.
The table below, taken from the Coinglass website, shows inflows and outflows on US spot ETFs on ETH
2) The Ether token is outperforming the bitcoin price, as shown by the technical analysis of the ETH/BTC ratio, and this should continue until the end of the cycle
The second aspect in Ethereum's favor is the sequence of outperformance against ETH on BTC. This is the lesson of the bullish message from technical analysis applied to the ETH/BTC ratio. The latter has turned upwards from a major support level, and the technical upside potential remains significant for the coming months.
The chart below shows weekly Japanese candlesticks for the ratio between Ethereum and Bitcoin
3) ETH/USD will pause below its all-time high of $4900 (that of the previous cycle), but should be able to move beyond it by the end of the cycle
The price of ETH/USD has reached its all-time high of $4850 in autumn 2021, the peak of the previous cycle. It's only logical that the market should start to stall and retrace to consolidate the rise since early summer. The market could develop a range phase between support at $4,000 and resistance at $4,850, before later being able to resume its fundamental uptrend. Historically, the Ether token cycle ends two to three weeks after the end of the BTC bull cycle, so it's likely that ETH/USD will be able to exceed its all-time high in the fourth quarter of this year 2025. The chart below outlines theoretical targets if and only if the all-time high of $4850 is broken by the market. Invalidation if major support at $4,000 is broken.
The chart below shows weekly Japanese candlesticks for the ETH/USD rate
DISCLAIMER:
This content is intended for individuals who are familiar with financial markets and instruments and is for information purposes only. The presented idea (including market commentary, market data and observations) is not a work product of any research department of Swissquote or its affiliates. This material is intended to highlight market action and does not constitute investment, legal or tax advice. If you are a retail investor or lack experience in trading complex financial products, it is advisable to seek professional advice from licensed advisor before making any financial decisions.
This content is not intended to manipulate the market or encourage any specific financial behavior.
Swissquote makes no representation or warranty as to the quality, completeness, accuracy, comprehensiveness or non-infringement of such content. The views expressed are those of the consultant and are provided for educational purposes only. Any information provided relating to a product or market should not be construed as recommending an investment strategy or transaction. Past performance is not a guarantee of future results.
Swissquote and its employees and representatives shall in no event be held liable for any damages or losses arising directly or indirectly from decisions made on the basis of this content.
The use of any third-party brands or trademarks is for information only and does not imply endorsement by Swissquote, or that the trademark owner has authorised Swissquote to promote its products or services.
Swissquote is the marketing brand for the activities of Swissquote Bank Ltd (Switzerland) regulated by FINMA, Swissquote Capital Markets Limited regulated by CySEC (Cyprus), Swissquote Bank Europe SA (Luxembourg) regulated by the CSSF, Swissquote Ltd (UK) regulated by the FCA, Swissquote Financial Services (Malta) Ltd regulated by the Malta Financial Services Authority, Swissquote MEA Ltd. (UAE) regulated by the Dubai Financial Services Authority, Swissquote Pte Ltd (Singapore) regulated by the Monetary Authority of Singapore, Swissquote Asia Limited (Hong Kong) licensed by the Hong Kong Securities and Futures Commission (SFC) and Swissquote South Africa (Pty) Ltd supervised by the FSCA.
Products and services of Swissquote are only intended for those permitted to receive them under local law.
All investments carry a degree of risk. The risk of loss in trading or holding financial instruments can be substantial. The value of financial instruments, including but not limited to stocks, bonds, cryptocurrencies, and other assets, can fluctuate both upwards and downwards. There is a significant risk of financial loss when buying, selling, holding, staking, or investing in these instruments. SQBE makes no recommendations regarding any specific investment, transaction, or the use of any particular investment strategy.
CFDs are complex instruments and come with a high risk of losing money rapidly due to leverage. The vast majority of retail client accounts suffer capital losses when trading in CFDs. You should consider whether you understand how CFDs work and whether you can afford to take the high risk of losing your money.
Digital Assets are unregulated in most countries and consumer protection rules may not apply. As highly volatile speculative investments, Digital Assets are not suitable for investors without a high-risk tolerance. Make sure you understand each Digital Asset before you trade.
Cryptocurrencies are not considered legal tender in some jurisdictions and are subject to regulatory uncertainties.
The use of Internet-based systems can involve high risks, including, but not limited to, fraud, cyber-attacks, network and communication failures, as well as identity theft and phishing attacks related to crypto-assets.

Ethereum Price Prediction: $4,900 Breakout Could Target $6KETH is consolidating near $4,700 after a strong breakout. Support holds at $4,600, resistance at $4,900. Clearing $4,900 could fuel a rally to $5,300–$5,700, with $6,000 on the horizon.


Final TargetIt looks like Ethereum has reached the end of wave 3 of the bullish cycle and is likely heading for a correction into wave 4

ETH - If You Know ...... You Know whats Coming
NYSE:BLK $BUIDL tokenized U.S.-Treasury fund launched on COINBASE:ETHUSD in Mar 2024—Wall Street is already settling real dollars on-chain.
NYSE:JPM JPMD stablecoin just went live on Base (an COINBASE:ETHUSD L2), piping wholesale payments from a $4 T balance-sheet straight through COINBASE:ETHUSD rails.
COINBASE:ETHUSD isn’t just riding the next crypto cycle—it’s becoming Wall Street’s settlement layer. From BlackRock’s on-chain Treasury fund to JPMorgan’s and soon Bank of America’s dollar tokens, a tidal wave of institutional stable-coin flows is lining up behind ETH. Fewer coins, more real-world volume—if you know, you know what’s coming.
NYSE:BAC CEO says they’ll issue a dollar-backed token the moment regulators nod—another tier-1 bank boarding the Ethereum train.
Stablecoin cap has blasted past $230 B , with 80 %+ of all on-chain transfers riding Ethereum (plus BSC) blocks.
Corporate settlements via stablecoins grew 25 % YoY in 2024 as multinationals replaced SWIFT with instant on-chain clearing.
Daily stablecoin throughput averages $7 B—each hop burning ETH and tightening supply.
BCG projects tokenized real-world assets to exceed $16 T by 2030 , with EVM chains as the default plumbing.
Over 500 M wallets already interact with stablecoins , a 30 % YoY surge led by emerging-market demand.
L2s like BINANCE:ARBUSDT & BINANCE:OPUSDT cut transaction fees 35 % yet still settle back to mainnet—meaning ETH captures the fee stream and the burn.
Bottom line: a tidal wave of bank-grade stablecoins + tokenized assets is lining up behind ETH; supply shrinks, demand soars—if you know, you know what’s coming.
quote] Marty Boots | 17-Year Trader — smash that , hit LIKE & SUBSCRIBE, and share your views in the comments below so we can make better trades & grow together!
Medium-term analysis of ETH (Ethereum)1. Key Levels Identified
Strong Resistance Broken (~$4,100–$4,200):
ETH has successfully broken a multi-year resistance level, which historically acted as a ceiling. This breakout is significant, as it shows institutional participation and strong buying interest.
New Support Zone:
The same $4,100–$4,200 zone has now turned into support (classic "resistance becomes support"). Price has already tested it once after breakout.
Medium-Term Target:
The chart highlights a measured move projection toward $6,750 levels, aligning with Fibonacci extensions.
2. Technical Structure
Trend:
ETH is in a strong uptrend with higher highs and higher lows. The breakout confirms continuation after long consolidation.
Retest Behavior:
Current pullback is testing the breakout zone, which is healthy. As long as ETH holds above $4,000, bullish structure remains intact.
Fib Projection:
The chart marks the 0.618–1.0 Fibonacci zone (~$6,000–$6,750) as the expected upside target in this cycle.
3. Risk Considerations
False Breakout Note:
Your annotation mentions “10 out of 8 times it fails!” — highlighting how historically, ETH has had multiple failed breakouts. If ETH closes back below $4,000, it risks a deeper correction toward $3,200–$3,400.
Overextension Risk:
Recent move is vertical. Medium-term investors should expect volatile corrections even if the longer-term trend stays intact.
4. Outlook
Bullish Scenario (High Probability):
ETH holds above $4,000 → moves toward $5,500–$6,000 first, and then toward $6,750 target over the coming months.
Bearish Scenario (Lower Probability but Risk):
ETH breaks below $4,000 support → sharp decline possible toward $3,200–$3,400 before stabilizing.
✅ Conclusion (Medium-Term View):
ETH looks bullish after breaking multi-year resistance, with $6,750 as the expected target. As long as $4,000 holds as support, dips are opportunities for accumulation. Risk management is key since false breakouts are common in crypto.
Disclaimer:
This analysis is for educational and informational purposes only and should not be considered as financial advice. Trading and investing in cryptocurrencies involve significant risk, including the potential loss of capital. Please conduct your own research and consult with a qualified financial advisor before making any trading or investment decisions.

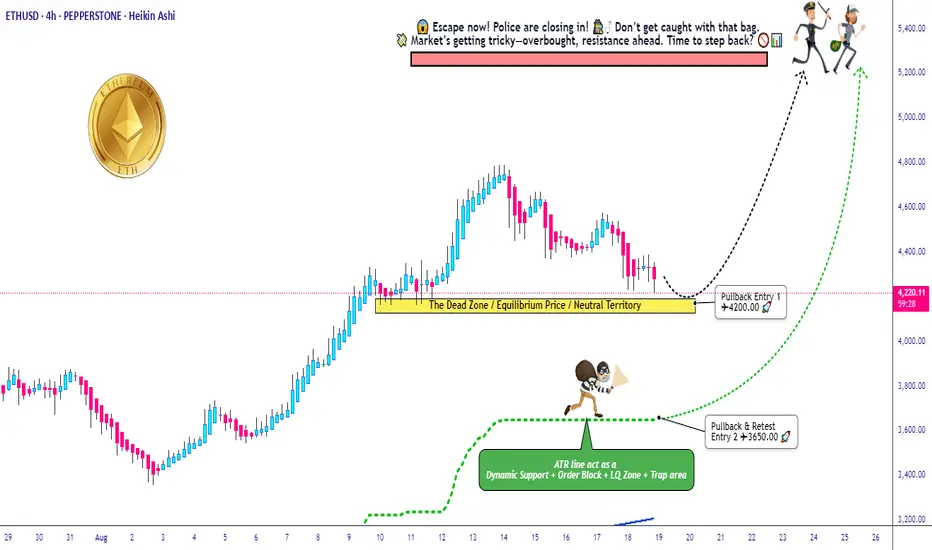
Big Crypto Heist: ETH/USD Swing Plan Targeting 5200 Exit!🚨💎ETH/USD “Ethereum vs U.S Dollar” Crypto Heist Plan (Swing Trade)💎🚨
Dear Ladies & Gentlemen… my Thief OG’s 🕶️💰, the vault is open and the police are distracted — time for the Ethereum Heist Plan!
Entry Plan (Pullback Loot Zones)
Pullback Entry 1: 💵 4200.00
Pullback Entry 2: 💵 3650.00
Load your bags in layers (Thief layering strategy – multiple buy limit orders). Patience is the key, we strike when guards are weakest.
🛑 Stop Loss (Escape Route)
Entry 1 SL: 3850.00
Entry 2 SL: 3300.00
👉 Adjust your SL according to your risk appetite & strategy — every thief has their own escape route.
🎯 Target (Cash-Out Point)
Police barricade ahead! 🚔💨 Secure your loot & exit before capture:
Take Profit @ 5200.00 🤑💸
📜 Thief Note:
This ETH/USD setup is a bullish robbery mission 🕵️♂️. Market guards (bears) are getting weaker, giving us the opening. Our layered pullback entries ensure we don’t rush the vault — we strike smart, not desperate.
⚡ Always remember: news releases = alarm triggers 🚨. Stay sharp, use trailing stops, and never get too greedy.
💖 If this plan helps your heist bag grow — Hit the Boost Button 💥 and power up our robbery crew. Together, we raid the markets daily with the Thief Trading Style. 🏆💪💰
🚀 Stay ready, stay sneaky… The next target is always around the corner.
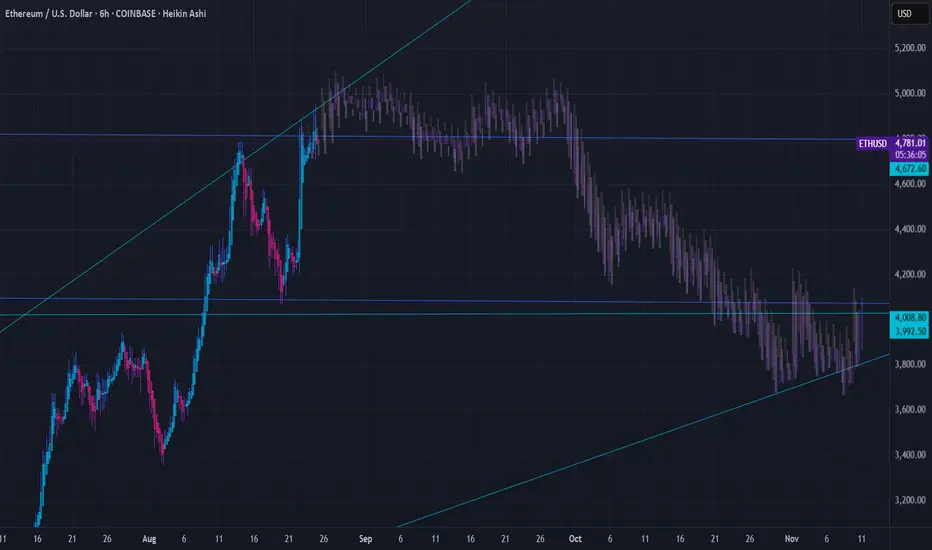
▒𖢻▒ ETHEREUM FORECAST | 6HR ▒𖢻▒COINBASE:ETHUSD
Here's my Forecast for Ethereum on the 6-hour chart. After an incredible run, ETH is now consolidating in a tight range, and the chart is giving us some very clear levels to watch.
Here's my breakdown of the current situation:
The Bullish Case (Consolidation):
ETH is currently holding strong above the key support level at $4,677. As long as we remain above this line, this sideways action looks like healthy consolidation before the next leg up.
The overall structure is still a clear uptrend, defined by the ascending trendline providing support from below.
The Bearish Case (Potential Pullback):
The price is currently below the recent High near $4,950. A failure to break this level could signal exhaustion and lead to a pullback.
The first major support to watch on any significant dip is the 0.382 Fibonacci retracement level around $4,300. This would be a logical area for buyers to step back in.
Key Levels to Watch:
Resistance: The recent high around $4,950. A clean break and hold above this level signals the next major move higher.
Immediate Support: $4,677. This is the line in the sand for the current consolidation range.
Major Support: The 0.618 Fib level and structural support at $4,000. This is the critical level that bulls absolutely must defend to maintain the larger bullish trend.
My Outlook:
For now, I'm leaning bearish on the 6HR, bullish in the immediate short-term but remaining cautious. I'm watching for a decisive break of $4,950 as confirmation for new highs. If the immediate support at $4,677 fails, I'll be looking for a potential dip-buying opportunity at $4,300.
DISCLAIMER
I AM NOT A FINACIAL ADVISOR, NOR AM I YOURS. THIS IS NOT FINANCIAL ADVICE. MEARLY DOODLINGS ON A MATHMATICALLY DRIVEN GRAPHICAL INTERFACE, TRACKING AN INVISIBLE 256BIT MILITARY-GRADE ENCRYPTED ASSET. . . FOR ENTERTAINMENT/AMUSEMENT PUROSES ONLY. ENJOY!