ETHUSD Long Idea: Bullish Break and Retest of Key ResistanceHello TradingView Community,
This post outlines a potential long trade setup on the Ethereum / U.S. Dollar (ETHUSD) pair, based on the 15-minute timeframe.
Technical Analysis:
The chart shows a significant horizontal price level at approximately $4,094.60. This level has acted as a key pivot, serving as both support and, more recently, as a strong resistance zone that capped the price.
We have now seen a decisive breakout above this resistance, which is a strong bullish signal suggesting a potential shift in market momentum. The trading idea is based on a classic "break and retest" pattern. The plan is to look for a long entry on a pullback to this former resistance level, with the expectation that it will now act as new support and provide a base for the next move higher.
Trade Setup:
The long position tool on the chart visualizes a potential trade plan based on this scenario:
Entry: Approximately $4,094.60 (at the retest of the new support).
Stop Loss: $4,007.15 (placed below the key support level to invalidate the idea if the level fails to hold).
Take Profit: $4,432.58 (targeting the next potential area of resistance or a new higher high).
This setup provides a structured plan with a favorable risk-to-reward ratio for a potential bullish continuation.
Disclaimer: This analysis is for educational and discussion purposes only and should not be considered financial advice. Trading cryptocurrencies involves significant risk. Please conduct your own due diligence and manage your risk appropriately.
Trade ideas

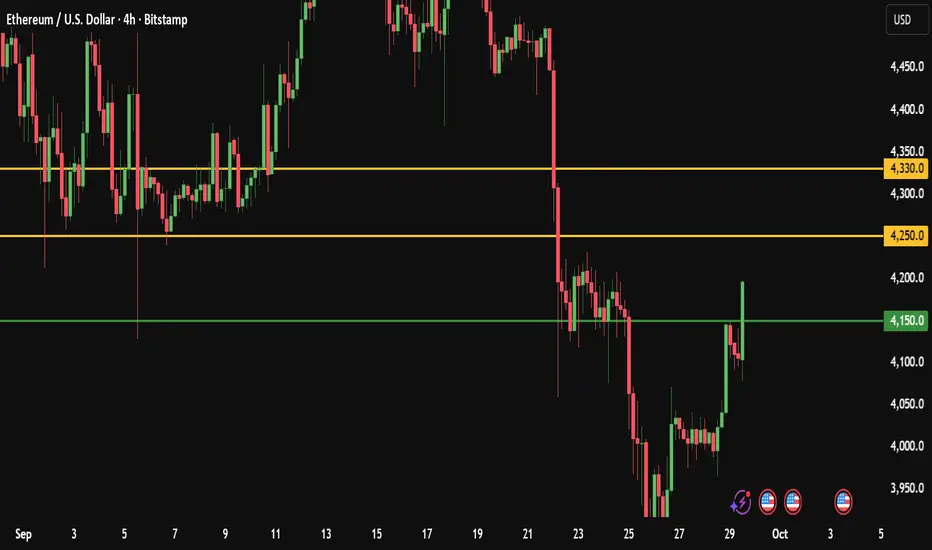
Ethereum Daily Technical Signal: Buy and Target 4330Ethereum Daily Technical Analysis
Ethereum is currently showing signs of strength as it tests the key resistance level around 4150.
A confirmed 4H candle breakout above this zone could trigger fresh bullish momentum, opening the door for higher targets in the short term.
My Personal Long Setup
If the price breaks and closes a 4H candle above 4150, I will enter a long position.
🎯 Target 1: 4250
🎯 Target 2: 4330
❌ Stop-loss: 4040
👍 Don’t forget to boost this trading idea if you found it helpful,
and follow me for more daily crypto insights and trade setups.
⚠️ Please note:
This is not financial advice – I’m only sharing my personal trades.
Always do your own research before taking action.
Best of luck 🌹
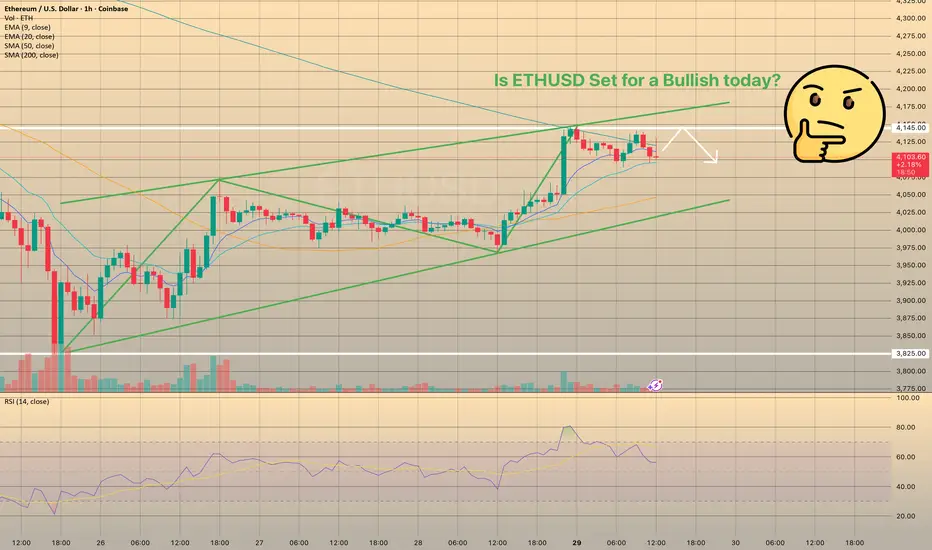
Ethereum outflows point to bullish setup above $4KEthereum outflows point to bullish setup above $4K
Altcoins are surging, and Ethereum has reclaimed the spotlight after crossing the key $4,000 mark. Trading volume is rising, and ETH is holding steady near $4,100 after a relatively calm weekend, suggesting stability following last week’s volatility. Analysts view $4,000 as a crucial support level—if bulls defend it, ETH could soon retest higher levels.
One factor supporting this outlook is a steady decline in Ethereum balances on spot exchanges. A CryptoQuant report shows coins are being withdrawn into self-custody and staking, reducing sell-side liquidity. Historically, such outflows have set the stage for rallies as demand absorbs limited supply.
Short positioning also adds fuel: more than $11 billion in shorts could be forced to cover if ETH breaks above $4,200, potentially accelerating gains.
Still, analysts warn that supply constraints alone aren’t enough—strong buyer inflows are needed to sustain momentum. The next few days will be key, with ETH’s ability to hold above $4,000 serving as a test for the next leg of the rally.
Weak Spot Demand Threatens $4,000 SupportETH/USD is showing signs of fragility as spot market participation weakens. Since September 12, the On-Balance Volume (OBV) indicator has trended downward, highlighting fading buyer demand in the market.
The OBV measures cumulative trading volume by adding volume on bullish days and subtracting it on bearish days. A rising OBV typically reflects strong buyer momentum driving prices higher, while a decline suggests that sellers are gaining the upper hand.
With ETH’s OBV steadily falling, it signals that selling pressure currently outweighs buying activity. This imbalance amplifies downside risks and raises concerns about whether Ethereum can maintain support above the critical $4,000 level in the coming weeks.

ETH Repeats the Pattern – $4800 Next Target?In my previous ETH analysis, I pointed out that while the price broke below the $4100 technical support and the $4000 psychological level, this move could represent a false break. But for this scenario to be valid, the market needed confirmation.
Since then, ETH has stabilized above $4000 and is now hovering around the $4100 level again.
📌 Looking back at the April rally (from $1400 upwards), we can already identify two similar cases of temporary breakdowns followed by strong recoveries.
• Each time, the market shook out weak hands before resuming the bullish leg.
• This repetition builds the case for another potential rebound, even if no outcome is ever guaranteed.
⚡ Trading Outlook:
• Bullish scenario: I expect ETH to rebound towards the $4400 zone, with the possibility of a retest of the $4800 resistance.
• Invalidation: A daily close back under $4000 would cancel this bullish setup and reopen the downside risk.
• Confirmation: A strong daily close near the highs of the day will add conviction to the bullish continuation.
👉 For now, the structure remains intact, and the bias stays bullish. The key levels to watch are $4000–4100 supports and $4400–4800 for resistance. 🚀
ETH TA 29.09On Thursday, we bounced well from the important zone with HTF divers and are already back above 4k. Now Ether desperately needs to break through the R1 zone of 4215-4250, and then there won't be any important resistances until 4600+. Currently, locally, we're trading sideways at 3980-4200+. Losing the lower boundary of the sideways range is undesirable and very dangerous for further growth, plus there's a good low there, albeit a Voskresensk one. And the nearest decent support is at 3500.

ETHUSD support at 3,810The ETHUSD remains in a bullish trend, with recent price action showing signs of a corrective pullback within the broader uptrend.
Support Zone: 3,810 – a key level from previous consolidation. Price is currently testing or approaching this level.
A bullish rebound from 3,810 would confirm ongoing upside momentum, with potential targets at:
4,115 – initial resistance
4,266 – psychological and structural level
4,356 – extended resistance on the longer-term chart
Bearish Scenario:
A confirmed break and daily close below 3,810 would weaken the bullish outlook and suggest deeper downside risk toward:
3,690 – minor support
3,570 – stronger support and potential demand zone
Outlook:
Bullish bias remains intact while the ETHUSD holds above 3,810. A sustained break below this level could shift momentum to the downside in the short term.
This communication is for informational purposes only and should not be viewed as any form of recommendation as to a particular course of action or as investment advice. It is not intended as an offer or solicitation for the purchase or sale of any financial instrument or as an official confirmation of any transaction. Opinions, estimates and assumptions expressed herein are made as of the date of this communication and are subject to change without notice. This communication has been prepared based upon information, including market prices, data and other information, believed to be reliable; however, Trade Nation does not warrant its completeness or accuracy. All market prices and market data contained in or attached to this communication are indicative and subject to change without notice.

ETHUSD - Logarithmic Trend D1Hello, dear traders. An interesting trend has formed on Ethereum in the logarithmic chart. Earlier, we clearly identified a double bottom on the second cryptocurrency. Now we can see that the price is close to rebounding from the support level.
The main thing is to find an upward reversal pattern on H1 or H4. The targets are the 1.382 and 1.618 Fibonacci levels. That's $8,000 and $11,000.
What do you think? Will Ethereum hold the support levels and will there be an altseason for this asset?

ETHUSD - Weekly Indicator ShiftWeekly chart for ETHUSD, it can be seen that the Gaussian Channel indicator has shifted from bearish to bullish or red to green on this timeframe.
Looking really good for Ethereum heading into a possible strong alt coin season.

$eth updateAs anticipated
CRYPTOCAP:ETH finally rolling out…
Last minute there and looks to be en route.
Targets remain, $4330 - $4400 crucial.
Really gonna be on closures here because we could see a potential high @$5600 OR a full blown roll over sending us back into the realms of $3200.
Month coming to a close, next 2weeks will play crucial to q4 pricing.
Let’s go Traders!!!! ✊🏾

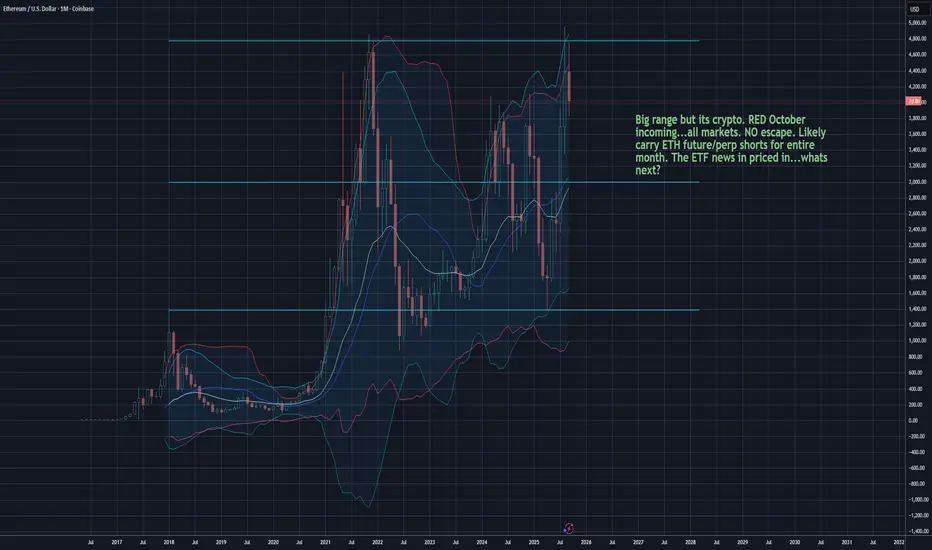
ETH so much good news baked into price...what now?Ethereum hit all time highs on many markets. Lots of excitement around wall-street adoption and staking craze. There are fewer available ETH on most exchanges. Scarcity brings astute collectors that play by different rules. Signs pointing toward a RED October for financial markets.
Rumors of a hard financial system reset continue. They have been around for 4+ years. I will short if we get back towards $4400. Expecting a hard yet short retreat.
Not financial advice & never take advice from anyone on the internet.
Eth one thing is clear follow me Short at the point of control of the volume profile
Sellers volume will depend that zone with heart

Ethereum at a Historical Crossroads: Breakout or Major Rejection
Based on the ETH/USD daily chart you shared, here’s a professional breakdown:
🔎 Technical Overview
Key Level: $4,000 – $4,100
This zone is a multi-year resistance (price was rejected here twice before → double top).
Currently, price is sitting just below this line — a true decision point.
Pattern Outlook
A confirmed breakout above $4,100 could open the way for a strong bullish rally.
A rejection here could trigger a deep correction, similar to the past two times.
100-Day Moving Average
Acting as dynamic mid-term support. A clean break below it would be a strong bearish signal.
📈 Short-Term Outlook (1–3 weeks)
Bullish Scenario:
Break and daily close above $4,100–$4,200 → Target 1: $4,500, Target 2: $4,850.
Stop-loss: Daily close below $3,900.
Bearish Scenario:
Rejection and breakdown below $3,850 → Target 1: $3,400, Target 2: $3,000.
Stop-loss: Daily close above $4,150.
📊 Long-Term Outlook (3–9 months)
Bullish (if resistance breaks):
Mid-term targets: $5,250 (next historical peak) → then potentially $6,000–$6,500 if momentum continues.
Stop-loss: Sustained close below $3,400.
Bearish (if resistance holds):
Likely correction towards $2,750–$3,000.
In a broader market downturn, a retest of $2,200–$2,400 is also possible.
⚠️ Key Takeaway: Price is sitting at a critical resistance zone. Risk management is crucial — trading without a stop-loss here could be dangerous.
Stop Blaming Market Manipulation: It’s Your Wrong InterpretationThe Excuse Factory
Recently, Bitcoin dropped from 118k to 108k. Suddenly, TikTokers, YouTubers, and X posters spiraled into paranoia, copy-pasting the same narrative: the “big masterminds,” reptilians, or aliens manipulated the market to liquidate 1.7 billion in buy orders.
Let’s pause for a second. A 10% pullback in Bitcoin is now considered a “market crash”?
If we look deeper... Ethereum fell about 20% from its top — but this same ETH had already grown 300% since April.
Was that also “manipulation”? Or does manipulation only happen when you are losing money?
How do you think markets work in general? Do they move only upward, just to make you richer?
The truth is simpler: there is no manipulation conspiracy here. There are no “false signals.” What exists are wrong interpretations.
The Market Is Neutral
The market doesn’t care about your position. It doesn’t send “false” signals; it simply moves. Price action reflects the sum of supply and demand in each moment.
When traders label a signal as “false,” what they really mean is:
• They misread the context.
• They didn’t account for a higher timeframe.
• Their stop placement wasn’t aligned with market structure or was too close.
The market doesn’t lie. It only reveals how much or how little you understand it.
Examples of Misinterpretation
• The “false breakout” myth – What you see as a false breakout on the 1H chart may be a perfect retest on the daily timeframe. The market wasn’t wrong—you were looking at it from the wrong lens.
• Stop hunting paranoia – Many traders cry “manipulation” when price takes out a cluster of stops. But think: stops are liquidity, and liquidity is where big players need to fill orders. That’s not manipulation—it’s how markets function.
• News volatility – Many traders call sudden spikes around economic releases “market tricks.” In reality, it’s about liquidity gaps. There aren’t buy and sell orders evenly distributed at every price level. When major news hits, price “rearranges” itself to include the new information and moves sharply until it finds liquidity — usually around strong support or resistance zones.
The Psychology Behind Blame
Blaming manipulation is easier than admitting error. It protects the ego. If the loss was due to some shadowy force, you don’t have to change. But this mindset locks traders into a cycle of frustration. Progress begins when you stop blaming the market and start analyzing your own decision-making.
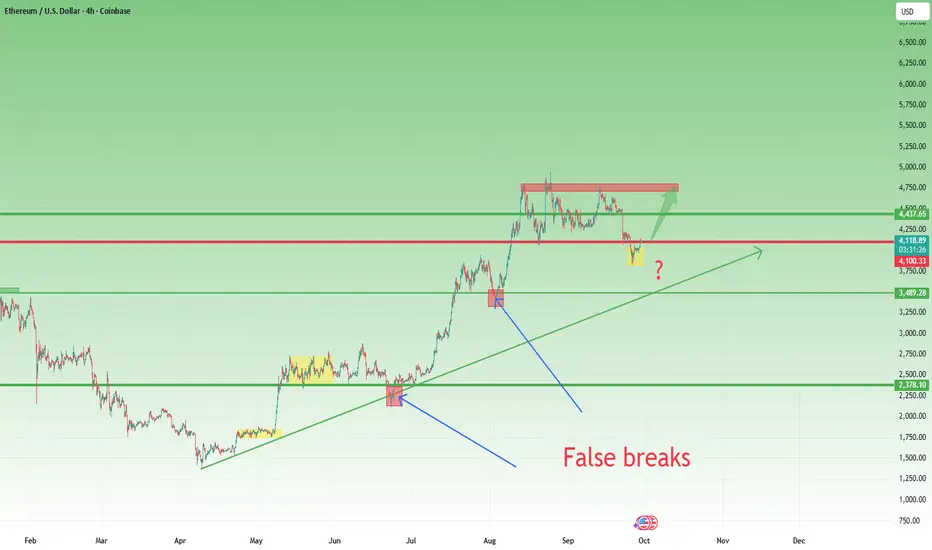
Case Study: Ethereum’s Current Setup
As the saying goes, a picture says more than a thousand words.
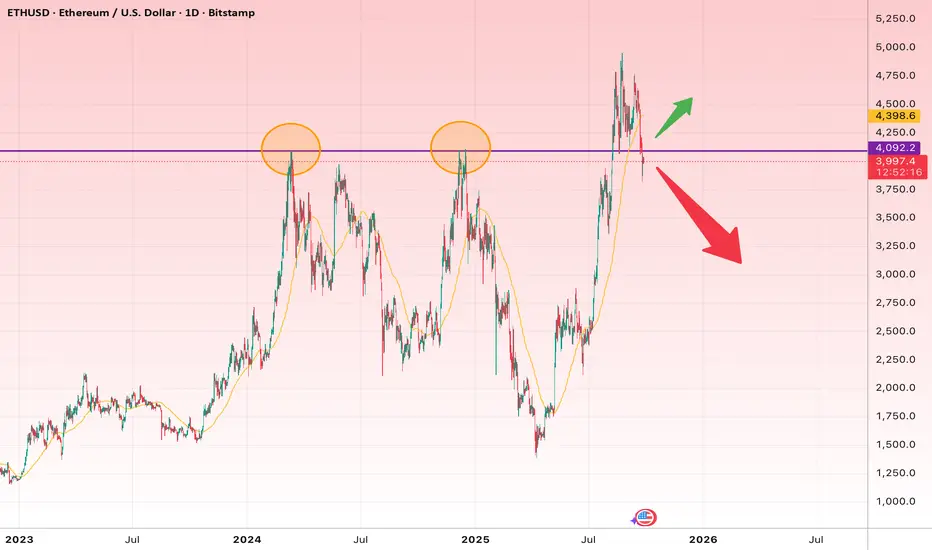
Since April, Ethereum has rallied over 300% in just six months. On this path upward, the chart shows two apparent “false breaks” of support.
The question now is: will the current move be the third “false break,” or the first real break? As I wrote in yesterday’s analysis, confirmation is key...
But even if ETH drops further, say to 3600, nothing truly changes in the broader picture. Such a move would only be a healthy correction of the trend that started in April — perfectly aligning the price with the 38% Fibonacci retracement and the rising trendline support.
Conclusion: The Trader’s Responsibility
There are no false signals. There is no hidden enemy in the market. There is only your interpretation.
ETHEREUMAfter the liquidation caused the price of the cryptocurrency to fall, Ethereum managed to break 4000 again, this is now a support region, following the upward trend line, Ethereum goes to 4100

$ethEth here in hot water.
$4400 demands respect and this handle has great potential to return it.
Giving a low end of $3900 which has recently come in and if is settled we will get this run.
So again, allow for $3900, track the closures and we’ll see how she goes.
🫣🫶🏽

Today I’m sharing my ETH/USD analysis.Ethereum is in a critical phase, so you should include it in your analysis.
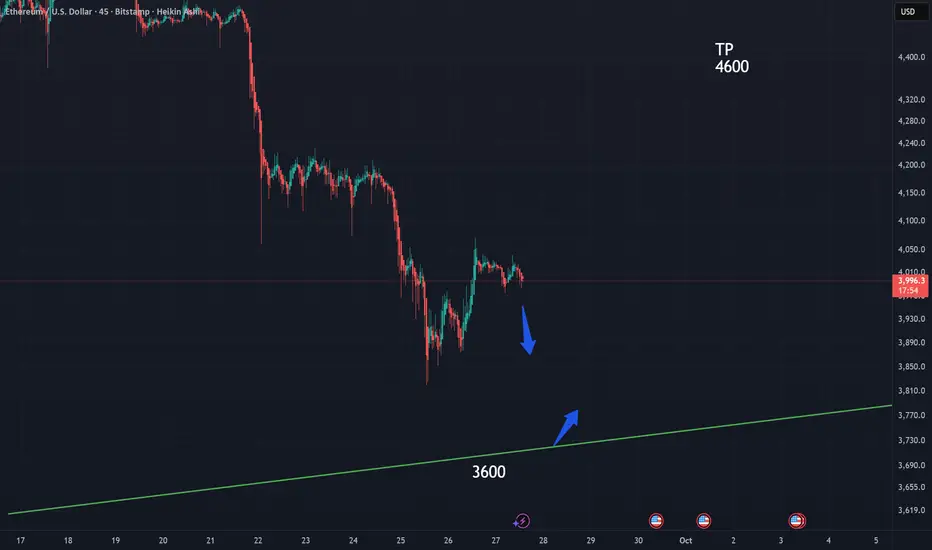
My expectation is that it will head toward 3600, with a target of 4600.
However, the trend can change at any time, so protect your capital and avoid taking big risks, because whales can shift the market and manipulate the chart.
Wishing you all a wonderful day!
ETHUSD Bearish Setup: Resistance at Former Support ZoneHello TradingView Community,
Here is a technical analysis of a potential short opportunity on the Ethereum / U.S. Dollar (ETHUSD) pair on the 15-minute chart.
Analysis:
The chart highlights a classic bearish price action pattern known as a "break and retest." We can observe a significant horizontal support level around $4,073.98 that held the price up on several occasions.
Recently, the price has broken down decisively below this support zone, indicating a shift in market sentiment. The price has now pulled back to retest this level from below. The expectation is that this former support will now act as new resistance, rejecting the price and leading to a continuation of the downward move.
Trade Setup:
The short position tool on the chart outlines a potential trade based on this analysis:
Entry: Approximately $4,073.98 (at the retest of the resistance line).
Stop Loss: $4,155.23 (placed above the resistance level to protect against a false breakdown).
Take Profit: $3,826.98 (targeting the next potential area of support).
This setup offers a defined risk management plan for a potential bearish continuation.
Disclaimer: This is purely a technical idea for educational purposes and should not be considered investment advice. Trading cryptocurrencies involves significant risk. Please perform your own due diligence and manage your risk accordingly.

ETHUSD Weekly Scenarios BullsWeekly Scenarios
Bulls
If ETH holds support at $4,200 and manages to rebound above the $4,500-4,600 resistance, we can expect a rally to $5,000 and beyond.
Sideways/Consolidation
The price may remain stuck in the $4,200-4,600 range until the market finds enough signal or volume to break out.
Bears
A breakout below $4,200 with volume confirmation will lead to a decline to $3,800 and below.

ETHEREUM HIGH PROBABILITY SETUP SOON!!!🚨 ETHER HIGH PROBABILITY BUY SETUP 🚨
* Here We Can See Clearly The Next Potential Moves For ETHUSD Coming Hours/Days.
* Keep Your Eyes Close On Your Trading Positions.
* Happy PIP Hunting Traders.
FXKILLA.

My only remaining hope for Ethereum !!!My only remaining hope for Ethereum is this PRZ. If the price holds this level, it could rise above $5000 otherwise, you know what will happen if this level breaked...

ETH Macro Picture, Pullback then $10k?CRYPTOCAP:ETH had a massive rally from the wave (II) bottom with a poke above all time high followed by extremely greedy sentiment on social and mainstream media of which I was warning should mark a local top and trap new investors.
Price has now pulled back to the first High Volume Node support target. I am expectinga deeper pullback over the next few weeks to complete wave (2) with an initial terminal target of the weekly pivot $3179 which is also the 0.382 Fibonacci retracement. That would be shallow for wave 2 which is expected in a wave III. However, the 0.5 Fibonacci retracement sits at the next major High Volume Node support where it is expected to meet the weekly 200EMA adding a lot of confluence to this are as the next bottom, $2660.
Any further downside bring up the S1 weekly pivot, golden pocket and high volume node, $2250.
There is weekly bearish divergence from the early 2024 highs.
I will play this trading plan point by point and look for longs at key levels to at least secure some bounce profits if not find a bottom.
Safe trading

ETHUSD SELL NOW 3990🔻 ETHUSD Short Setup – Entry: 3990
Ethereum is facing resistance near 3990, presenting a clean intraday short opportunity. Key bearish signals:
- 🔸 Price rejection at prior supply zone
- 🔸 Bearish divergence on RSI (1H)
- 🔸 Lower high structure forming below 4030
- 🔸 Volume fading on recent push
📉 Trade Plan:
- Entry: 3990
- Stop Loss: 4030
- Take Profit: 3910
Risk/reward ratio: 1:2 – ideal for disciplined scalpers and short-term swing traders. Watch BTC correlation and macro headlines for volatility spikes.
