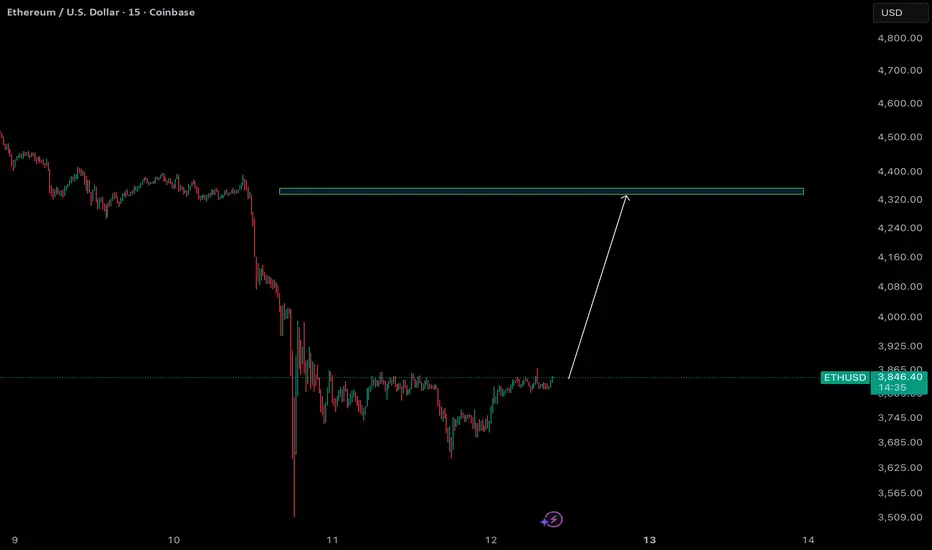
ETH UpdateBounced off support yesterday afternoon, probably goes up. That flat line is a weekend so it'll be in a different spot this time.
Market insights

EthereumETHUSD
- RSI - Divergence
- SSL
- Change of Characteristics
- Order Block
- Symmetrical Triangle as an corrective pattern in Short Time Frame

ETHUSD H1 | Possible Bearish Turn Ahead”ETH/USD is rising towards the sell entry, which is a pullback resistance that is slightly above the 50% Fibonacci retracement and could reverse from this levle to the downside.
Sell entry is at 3,936.30, which is a pullback resistance that is slightly above the 50% Fibonacci retracement.
Stop loss is at 4,079.07, which is a pullback resistance.
Take profit is at 3,703.89, which is a multi-swing low support.
Stratos Markets Limited (tradu.com ):
CFDs are complex instruments and come with a high risk of losing money rapidly due to leverage. 68% of retail investor accounts lose money when trading CFDs with this provider. You should consider whether you understand how CFDs work and whether you can afford to take the high risk of losing your money.
Stratos Europe Ltd (tradu.com ):
CFDs are complex instruments and come with a high risk of losing money rapidly due to leverage. 70% of retail investor accounts lose money when trading CFDs with this provider. You should consider whether you understand how CFDs work and whether you can afford to take the high risk of losing your money.

ETH 1h Triple Bottom – Eyes on 4200 BreakoutThe Ethereum 1-hour chart displays a textbook triple bottom formation, with clear support established around the 3700–3750 level (see attached chart). This pattern emerged after multiple retests, indicated by green lines marking three distinct lows. The triple bottom suggests sellers may be exhausted and buyers are defending this zone.
Bullish divergence is also visible in both RSI and MACD indicators. Both momentum oscillators show higher lows, adding strength to the reversal signal. Price action remains inside a descending channel, but the repeated rejection from the green support zone and visible volume buildup increases the probability of a breakout.
If momentum continues, a successful rally could challenge overhead resistance at 4200, which coincides with previous range highs and a significant volume profile cluster. The red resistance zone is defined as the primary target area for longs. Should this level be breached, further upside will depend on market conditions and macro sentiment.
Trade Plan
Entry: Around 3760–3800 upon confirmed bullish reversal or close above channel resistance.
Take Profit: Primary target at 4200; partials recommended between 4100–4200.
Stop Loss: Below 3700, upon invalidation of the triple bottom.
Notes
Watch for confirmation and volume spike before entering. A failure to hold the green support invalidates the setup.
NFA.

ETHUSD – 1H Long Setup (SMC | ICT | Bill Williams Confluence)
Bias remains **bullish** after a clean sweep of **sell-side liquidity** and strong rejection from the demand zone. Price has confirmed a **break of structure** and is now reacting off a **breaker block** aligned with an **inverted fair value gap (IFVG)** — solid confluence for continuation.
### 🧭 Technical Breakdown
1. **Liquidity Sweep:** Price cleared out **sell-side liquidity** under the 3,800 zone — engineered liquidity before reversal.
2. **Breaker Block (BB):** FOR our entry
3. **IFVG:** Price filled the IFVG inside the BB and respected it perfectly, showing balanced re-pricing.
4. **Bill Williams Confluence:**
* Alligator lines tightening, signaling end of corrective phase.
* Price starting to trade above the green (lips) and red (teeth) lines — early signs of bullish acceleration.
5. **Structure Context:** Market structure shifted bullish on the 1H following the sell-side sweep and last week low being run.
### 📈 Plan
* **Entry:** From breaker block / IFVG confluence (3,800–3,830 zone).
* **Stop:** Below 3,713 (beneath liquidity low).
* **Targets:**
* 🥇 3,900 → intraday liquidity pool
* 🥈 4,020 → FVG fill above
* 🥉 4,090+ → 4H supply / OB
### ⚡ Bias
As long as ETH holds above the breaker block and 3,820 zone, I maintain **long bias** expecting expansion toward 4K+.
Classic **SMC + ICT synergy**: *Sell-side sweep → Structure shift → Breaker block + IFVG → Expansion*.

Finally 5k? - ETH weekly update Oct 20 - 26thWelcome to my very shortterm analysis on Ethereum.
Currently, I think the most probable scenario is that we are in a wave 3 of the intermediate cycle and a wave 2 in the minor cycle. This structure is part of the first wave of the primary cycle. Alternatively, This structure could also potentially be a triple three pattern or a triple three with a triangle as the last pattern, as drawn into the chart. Those two alternatives are not my main scenario, because the structure of the X is clearly a five-parter and no valid pattern has this characteristics. Moving on, as you can see I expect the wave 2 of the minor cycle to be deeper than normal, because Liquidity is sitting just above the start of the minor wave 1 and as second waves in crypto often move a bit further, I do expect them to do that here to. It is only important to keep an eye on the chart, because as Ethereum breaks the low of the minor wave 1, the scenario will be invalidated. As price evolves it is also critical that Ethereum sustainably breaks the high of the minor wave 1. Indicators for the ending of the second wave could be negative or low funding rates, a low RSI and liquidity forming above the first wave's high because traders expect the price to drop further and open leveraged positions. Speaking of liquidity, the ETF shows more outflows than inflows and on-chain data is also showing large funds distributing they're Etehreum. This could also be a part of the fifth and last wave of the cycle, where institutionals sell and the retailers being the exit liquidity.
Till next update have a successful week, see ya✌️.

Ethereum Uptrend Under Pressure, Setup in PlayETH/USD is clinging to uptrend support, providing a level that can be used to build setups around. The first thing that stands out is the inability for the price to bounce meaningfully, differentiating it from last week, at least so far. Secondly, prior to Wednesday’s bearish candle, there was a string of dojis, indicating that while the recent price action has been bearish, there’s still plenty of indecision out there as to whether the move will extend.
As things stand, momentum signals favour downside with RSI (14) and MACD shifting from neutral to bearish territory. However, marginal bullish divergence between RSI (14) and price provides an early warning signal that downside pressure may be in the process of bottoming. As such, while selling rallies and downside breaks is preferred, until one of those eventuates, there’s still opportunity to look for short-term countertrend trades.
If we see a definitive break of the April uptrend and push below the October 17 low beneath $3700, shorts could be established with a stop above either level to protect against reversal. $3500 and $2930 screen as two potential targets.
However, if the trendline continues to be defended successfully, longs could be established with a stop beneath either today’s or the October 17 low for protection. $4100 or the 50-day moving average loom as possible targets.
Good luck!
DS

Ethereum Buying OpportunityGold has seen a massive decline, and capital often seeks new strongholds during such shifts. With investors moving away from metals, crypto — particularly Ethereum — looks like an attractive alternative.
From a technical standpoint, ETH has experienced a healthy correction and is now forming a bullish wedge pattern, hinting at potential upside momentum. The structure suggests that accumulation is taking place before a possible breakout.
If the price breaks and holds above the upper trendline, a strong rally could follow, offering a potential 25% upside from current levels.
📈 Target zone: Around $4,713
💡 Setup bias: Bullish continuation after consolidation
Ethereum’s blend of solid fundamentals, renewed investor attention, and technical setup could make it one of the top assets to watch in the coming days.

ETH long ideaETH long idea.
Taking into account November could be bullish. If not, we are about to have a deep bear market

ETH 30-Min – The 200MA Holds the Key
This is ETH on the 30-minute chart.
The 200MA has been the main pivot for price action lately — and it might decide the direction for the rest of the week.
Last Sunday around 08:00, price attempted to conquer the 200MA, leaving a small wick above it.
Shortly after, it flipped the 200MA into support and climbed higher into the weekly close.
Today at 00:00, ETH retested the same level, bounced again, and pushed higher until 15:30, when it lost the 50MA and started a short-term drop.
At 17:30, it found support again at the 200MA — and since then, every 30-minute candle has closed higher.
If ETH continues to hold above the 200MA, momentum could build for a move higher through the week.
Lose it, and the structure shifts back to consolidation.
Always take profits and manage risk.
Interaction is welcome.

$eth 15 min , new york setup 🧠 Session-Based Liquidity & Manipulation
Asia low was swept — liquidity grab confirmed.
Price is now stabilizing above the Alligator, signaling potential reversal.
🐊 Bill Williams Alligator Signal
Alligator is coiling and turning up — bullish awakening in progress.
Price holding above lips/teeth supports long bias.
🎯 Corrected ETHUSD Trade Plan – Long Setup
Entry Zone: 3,846 – 3,850 (retest of Alligator support)
Stop Loss: 3,777 (below recent swing low — as per chart)
TP1: 3,875 (first liquidity above)
TP2: 3,900 (next HTF level & Asia high)
✅ Confirmation Needed:
Bullish candle close above 3,850.
Hold above Alligator lips (~3,840–3,845).
Volume spike on the move up.
Bottom Line:
Asia low taken, manipulation complete.
Alligator supports bullish reversal.
Long above 3,846, stop below 3,777.
— origami_capita133 | TradingView
👉 Like & Follow if this helps your trading. Trade with discipline, not emotion.

$ETH Retest completed, now It's time to run.The downtrend from the November 2021 peak has broken and is in a retest phase.
Ethereum is no longer in a "rejection" phase, but in a "retest" phase.
Next page \ price discovery.

Eth long setup Asia Price swept sell-side liquidity, formed a Market Structure Shift (MSS), and is now reacting off a discount zone + FVG.
Bill Williams’ Alligator lines (green crossing red) show early trend shift confirmation.
🎯 Setup Details:
Entry: $3,863 (inside FVG discount zone)
Stop Loss: $3,823 (below MSS & liquidity sweep)
Take Profit: $3,982 (premium zone / next liquidity pool)
R:R: ≈ 3:1
📊 Expecting a continuation higher once price closes above $3,886.
Staying bullish unless we close below MSS low.
#ETH #SmartMoneyConcepts #ICT #BillWilliams #PriceAction #CryptoTradi

ETH PERPETUAL TRADE SELL SETUP Short from $3960ETH PERPETUAL TRADE
SELL SETUP
Short from $3960
Currently $3960
Targeting $3900 or Down
Stoploss $4300
(Trading plan IF ETH
go up to $4100 will add more shorts)
Follow the notes for updates
In the event of an early exit,
this analysis will be updated.
Its not a Financial advice

Ether is a buy between 1300-1500!!This price point is significant as it aligns with Ethereum's previous highs from 2018, suggesting a potential support level. The occurrence of a monthly divergence indicates that selling pressure may be diminishing, potentially paving the way for a bullish reversal.
Looking ahead, industry projections are optimistic about Ethereum's future performance. Analysts anticipate that Ethereum could reach new all-time highs, with some forecasts suggesting prices exceeding $5,000 in the coming year.
From a fundamental perspective, Ethereum's transition to a proof-of-stake consensus mechanism has significantly reduced its energy consumption and introduced deflationary pressures on its supply. This shift, along with ongoing network upgrades, enhances Ethereum's scalability and security, reinforcing its position as a leading platform for decentralized applications and finance.
Furthermore, the approval of Ethereum-focused exchange-traded funds (ETFs) has opened new avenues for institutional investment, contributing to increased demand and potential price appreciation.
In summary, the current price dip presents a favorable buying opportunity, supported by technical indicators and robust economic fundamentals. With continued network enhancements and growing institutional interest, Ethereum's outlook remains positive.
Please note alot of these things can take time to reflect in price. So although some of these news are a few years long it does not make it any less impactful! Buy when there is blood on the street.

Ethereum ETH Final Upside LegCRYPTO:ETHUSD found buyers at the equal legs support zone of $3629–$3363, triggering a bullish reaction from that area. As long as October low holds, then Price action now favors a move higher toward the next target to the upside at $5300 - $5880

Ethereum - The clear $20.000 target!🚀Ethereum ( CRYPTO:ETHUSD ) is breaking out:
🔎Analysis summary:
Despite the recent back and forth, Ethereum clearly remains bullish. We are still able to see the underlying triangle pattern, which Ethereum is attempting to break again. After a successful breakout, Ethereum will immediately start the next potential +350% rally.
📝Levels to watch:
$4,500 and $20,000
SwingTraderPhil
SwingTrading.Simplified. | Investing.Simplified. | #LONGTERMVISION

Has Life Sprung Back in ALTS?Quick ETH Trade Update — Market Showing Signs Of Life
Just a short update for everyone who’s been following my ETH long position — I’m still in, and we’re finally seeing some movement! There’s been a bit of news that brought life back into the market, especially across altcoins, and I wanted to share my quick thoughts on what this means.
I’ll also cover what I’m watching next, my invalidation levels, and what would make me either hold or scale out of the trade.
Stay patient, stay focused — the move could just be starting.
#Ethereum #ETH #Altcoins #CryptoMarket #CryptoTrading #Bitcoin #ICTStrategy

ETH/USD — Downtrend Persists as Global Tensions MountETH/USD continues to trade under pressure, extending its medium-term downtrend. After a brief weekend rebound to 4062.50 (Murray , 23.6% Fib), the pair failed to hold above that level and resumed its decline on Monday.
Investors remain cautious as the U.S.–China trade conflict escalates. With President Donald Trump threatening 100% tariffs on Chinese imports ahead of his October 31 APEC meeting with Xi Jinping, risk assets — including crypto — remain vulnerable.
Adding to bearish sentiment, White House economic advisor Kevin Hassett said that U.S. government operations could resume soon, strengthening the dollar and weighing on alternative assets. The Fear & Greed Index stands at 34, reflecting weak confidence. Outflows from Ethereum ETFs reached $434.8M over the past three sessions, highlighting continued investor caution.
Overall, the fundamental backdrop favors further downside in the medium term.
⸻
Technical Analysis
ETH/USD remains in a downward channel, correcting against the long-term bullish trend.
• A break below 3750.00 (Murray ) could extend losses toward 3437.50 (Murray ), 3125.00 (Murray , 50% Fib), and 2720.00 (61.8% Fib).
• On the upside, a breakout above 4375.00 (Murray , mid-Bollinger Band) would invalidate the bearish setup and open the path toward 5000.00 (Murray ) and 5312.50 (Murray ).
Indicators:
• Bollinger Bands: turning downward — confirming continued bearish momentum.
• MACD: expanding in negative territory — sellers maintain control.
• Stochastic: pointing upward — short-term corrective bounce possible but limited.
⸻
Trading Plan
📉 Sell Setup
• Entry: 3750.00
• Targets: 3437.50 → 3125.00 → 2720.00
• Stop: 3975.00
📈 Buy Setup (Reversal)
• Entry: 4375.00
• Targets: 5000.00 → 5312.50
• Stop: 3960.00
⸻
Key Levels
Support: 3750.00 · 3437.50 · 3125.00 · 2720.00
Resistance: 4375.00 · 5000.00 · 5312.50
⸻
💬 ETH continues to trade within a bearish structure. A daily close below 3750 would confirm a deeper correction, while only a breakout above 4375 could revive bullish momentum toward 5000.
⸻
#ETH #Ethereum #ETHUSD #Crypto #TechnicalAnalysis #TradingView #FORECKINFO

ETHEREUM (ETH/USD): Comeback? Eyes on $4300 Resistance.ETHEREUM appears to be showing some bullish signals following a test of a significant daily support level.
The price formed an inverted head and shoulders pattern on that, succeeded by a bullish breakout above its neckline, which is serving as a minor resistance, thereby confirming a local change of character.
Considering these factors, there is a possibility that the price of the coin could potentially rise to the $4300 level.

ReloadingWell, after the storm two nights ago, we should be ready for the Emperor to return to his throne. The green zone can be touched again. What do you think, friends?
ETHUSDT: Head And Shoulders Pattern, Price Targets! $3,676Hi everyone,
Lets grasp a sight on ETHUSDT, we can clearly notice that Ethereum have lately concluded the head and shoulders pattern setup. the price have been ranging for some few hours after touching the neckline region, presently we are expecting a breakdown below this region.
Meanwhile a confirmed breakout from the neckline region would activate a downside movement with momentum aim for $3,676.
Like and follow up,
Thanks for reading.

ETHUSD Is showing a great buy opportunity - low risk high rewardETHER - ETH/USD experienced a big drop to the downside like most other cryptocurrencies... but it nows has very clear signs of a major bullish movement ahead. There is currently a head and shoulders pattern forming which has given us high confidence that it will head to the upside. BUY NOW!
