ETH Correction Finally Underway!Local Analysis / Targets / Elliot Wave
I have been banging the drum about a deeper ETH pullback for a weeks and it appears to be finally underway with bearish market structure confirmed with the lower low from yesterday. Online sentiment, mainstream media attention, silly price targets from analysts, discussions of the ‘the flippening’ returned and Trumps son bragging on X were all major warning signs of a local top. The ETH validator exit queue is record breaking causing a delay of 40+ days if you want to un-stake your ETH. Wrapped Ethereum like stETH may be a good option if you really want out fast! Weather this supply hits the markets is still up in the air.
Price is in the High Volume Node support and below the daily pivot. This isn’t likely to break immediately but after a few attempts to weaken it first (4? lol). The first target for the end of the correction is the same as a few weeks ago - the S1 pivot, rising daily 200EMA and 0.382 Fibonacci retracement at $3500, followed by the S2 pivot, High Volume Node support and 0.786 ‘alt-coin golden pocket’ at $2700. This could present a great buy opportunity.
RSI is making its way to oversold which is a good sign when in a range.
Standard Deviation Band Analysis
Standard deviation bands tell a different story with price still only testing the fair value regression line as resistance after presenting a fantastic buy opportunity from the green zone earlier this year. Price rides this line most of the time as you can see by looking left. A significant breakout above would see the SD+2 threshold target around $7000, a blow off top could reach $10,000 at the SD+3 threshold.
Safe trading
Trade ideas

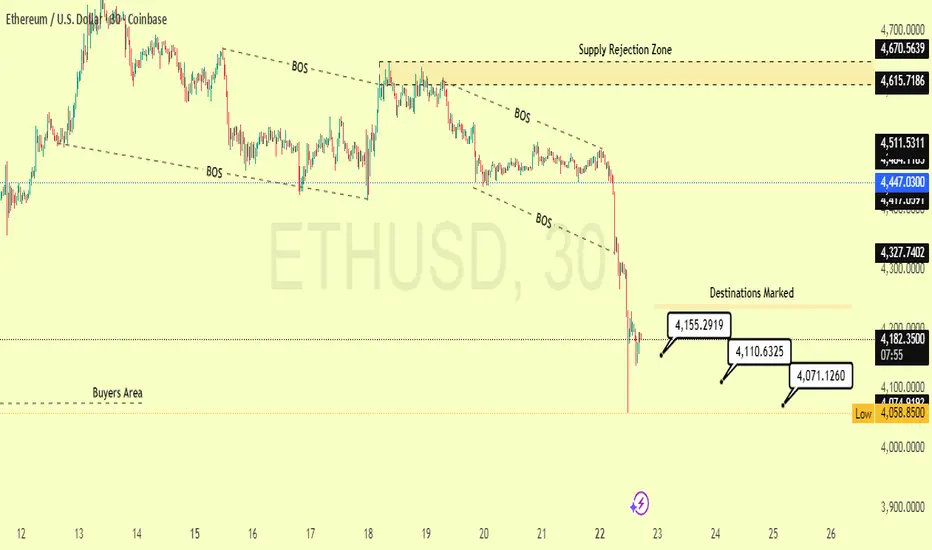
ETHUSD – Sharp Rejection from Supply Zone | Key Targets Mapped"Brief Description:
Ethereum faced a decisive rejection from the **Supply Rejection Zone near $4,615– $4,670**, where previous institutional sell-offs occurred. Price structure showed consistent signs of weakness leading up to this, including multiple Break of Structure (BOS) confirmations on lower highs. The rejection triggered aggressive selling pressure, causing a near 6% drop in a single session — a clear indication of supply absorption and lack of bullish momentum at the top. This move likely flushed leveraged longs, opening the door for liquidity grabs toward demand zones.
Following the sharp dump, ETH is now showing signs of a short-term relief move. The chart outlines a corrective bounce setup with clear intraday targets, acting as potential resistance levels on the way up:
Target 1: $4,155.29 – Strong reaction level, aligned with structural breakdown point.
Target 2: $4,110.63 – Mid-level reaction zone; watch for volume behavior here.
Target 3: $4,071.13 – Near-term resistance, potential pullback zone.
Traders should monitor lower timeframes for signs of reversal or continuation near these levels. The Buyers Area around \$4,000 remains critical if price continues lower.
This setup aligns with broader market weakness and reflects typical behavior following rejection from a strong supply zone — remain cautious and trade with discipline.
Best Way of Trade in Global Market1. Introduction to Global Market Trading
The global market is a vast network where nations, corporations, and individuals engage in the exchange of goods, services, and financial assets. It connects continents through trade flows, currency exchanges, stock markets, and commodities. In today’s era of globalization, no economy functions in isolation—an event in one corner of the world can ripple across markets everywhere.
Trading in the global market is not just about buying low and selling high. It is about understanding global dynamics, currencies, interest rates, political shifts, technological innovation, and cultural differences. The best way to trade in the global market is by adopting a strategic, informed, and risk-managed approach.
2. Why Trade in the Global Market?
Trading globally offers opportunities that local markets may not provide.
Diversification of Risk – By spreading investments across countries and asset classes, traders reduce dependence on a single economy.
Access to Growth Markets – Emerging economies like India, Brazil, and Vietnam are growing faster than developed economies, offering higher returns.
Currency Benefits – Forex markets allow traders to profit from exchange rate fluctuations.
Global Innovation Exposure – Investing globally provides access to new technologies, industries, and consumption trends.
Hedging Against Inflation – Commodities like gold, oil, and agricultural products offer protection against inflationary pressures.
Trading in the global market is both an opportunity and a responsibility, requiring awareness of risks and market structures.
3. Types of Global Market Trading
To find the best way to trade globally, one must first understand the different types of trading:
Stock Market Trading (Equities) – Buying and selling shares of global companies listed on exchanges like NYSE, NASDAQ, LSE, or NSE.
Forex Trading (Currencies) – The world’s largest market, where currencies like USD, EUR, JPY, and INR are traded 24/7.
Commodity Trading – Trading in gold, silver, crude oil, natural gas, coffee, wheat, and other resources.
Bond & Debt Market Trading – International investors trade government or corporate bonds for safer, fixed-income returns.
Derivatives Trading – Futures, options, swaps, and other contracts used for speculation or hedging.
Crypto & Digital Assets – Trading Bitcoin, Ethereum, and other digital currencies gaining global recognition.
Cross-Border Trade in Goods & Services – Physical movement of goods like electronics, automobiles, and textiles between nations.
Each type requires different skills, risk tolerance, and strategies.
4. Key Instruments in Global Trading
Stocks/Equities – Represent ownership in a company.
ETFs (Exchange-Traded Funds) – Allow access to a basket of global assets.
Futures Contracts – Agreements to buy/sell assets at a future date.
Options – Provide flexibility with rights (not obligations) to trade assets.
Currencies (Forex) – Driven by macroeconomic and geopolitical factors.
Commodities – Gold, crude, and agricultural goods as safe havens or growth bets.
Bonds – Government & corporate debt for stability.
Understanding which instruments fit your financial goals is crucial to finding the best global trading method.
5. Factors Influencing Global Trade & Markets
Economic Indicators – GDP growth, inflation, unemployment, interest rates.
Central Bank Policies – The US Federal Reserve, ECB, RBI, and BOJ decisions.
Geopolitical Events – Wars, sanctions, trade agreements.
Technology & Innovation – AI, fintech, e-commerce growth.
Natural Resources & Climate Change – Affect commodity supply and pricing.
Global Connectivity – Internet penetration, financial access, blockchain.
The best traders carefully study these factors to anticipate market shifts.
6. Best Ways / Strategies to Trade Globally
Here comes the most important part—the actual best practices for trading in global markets.
A. Fundamental Strategies
Study macroeconomics: inflation, interest rates, and trade balances.
Track earnings reports of multinational corporations.
Monitor commodity demand-supply balance.
Analyze political stability and trade agreements.
B. Technical Strategies
Use charting tools: candlesticks, moving averages, RSI, MACD.
Identify global price patterns and volume spikes.
Apply volume profile & market structure analysis for stronger entries/exits.
C. Risk Management
Always set stop-loss levels.
Use position sizing (never invest more than 1–2% of capital per trade).
Diversify across regions and asset classes.
Hedge with safe assets like gold or USD when markets are volatile.
D. Long-Term vs Short-Term Approaches
Long-Term Global Investing: Buy quality global stocks, ETFs, or bonds for steady growth.
Short-Term Global Trading: Focus on forex, futures, and options for quick profits with higher risks.
E. Leverage Technology
Use AI-powered trading platforms.
Apply algorithmic trading for efficiency.
Stay updated with real-time news feeds & data analytics.
7. Role of Technology, AI & Global Connectivity
Algorithmic Trading – High-frequency strategies based on programmed rules.
AI in Market Prediction – Predicting price movements using big data.
Blockchain & Crypto – Decentralized finance reshaping cross-border trade.
E-commerce Expansion – Global platforms like Amazon, Alibaba influencing logistics & currencies.
The future best way of trading globally will increasingly depend on data-driven decision-making.
8. Challenges in Global Trading
Currency Volatility – Fluctuating exchange rates affect profits.
Geopolitical Risks – Wars, trade wars, sanctions.
Regulatory Differences – Each country has unique tax, compliance, and trading rules.
Information Overload – Too much data can confuse decision-making.
High Competition – Global traders compete with hedge funds, institutions, and algorithms.
Understanding and preparing for these challenges is vital.
9. Practical Steps for Beginners to Start Global Trading
Education First – Learn basics of forex, stocks, commodities.
Choose a Reliable Broker – Ensure global access, regulation, and low fees.
Start Small – Begin with ETFs or paper trading before direct forex/derivatives.
Follow Global News Daily – Understand how events affect markets.
Practice Risk Management – Never trade emotionally.
Build a Global Portfolio – Mix equities, bonds, forex, and commodities.
10. Future Outlook of Global Market Trading
Digital Currencies & CBDCs will make cross-border trade faster.
AI-Powered Trading Bots will dominate short-term strategies.
Emerging Markets will drive growth opportunities.
Sustainable Trading (green energy, ESG assets) will attract capital.
Decentralized Finance (DeFi) will reduce dependency on traditional banks.
The future best way of trading globally will be a hybrid of human intelligence + AI-driven systems + sustainable investments.
11. Conclusion
The best way of trading in the global market is not a single fixed formula—it is a dynamic process combining education, analysis, technology, and discipline. Traders must blend fundamental understanding with technical tools, ensure risk management, and use AI-driven strategies to remain competitive.
Global trade is expanding rapidly, and with the right approach, even small traders can participate meaningfully in the world’s biggest financial opportunities.
In essence, the best way to trade in the global market is to stay informed, diversified, disciplined, and adaptive—while leveraging both technology and human judgment.

ETHUSD bull pennantA bull pennant on the 2h chart for ETH USD. I'm not sure how this will play out. The price has held very good so far. Today's sunday candle will be very indicative. If this goes up from here shorts will be cancelled and it will fly. If not then the future holds something different.

Updated ETH Chart. Bullish falling wedge extension past ATHUpdate to my previous idea, I think with the Fed rate cut upcoming after the weekend close, ETH will make a new ATH next week.
Ichimoku buy signal on ETH/USD DailySo there's an ichimoku buy signal on the ethereum daily chart. When the faster span crosses over the slower one, (doesn't let me use japanese words) and the current candles are over the cloud, this indicates a buy signal. The lagging span should ideally be above the corresponding price action. In this case it almost is.
Other than the indicators, we have a bull pennant looking shape. as well as a cup and handle looking pattern. The trade is to buy here targeting new all time highs for ethereum. This also depends on bitcoin. If bitcoin goes up, I am very certain this will happen.
Not telling you a stop loss or anything.
Not financial advice

ETH To 3,054$ coming to a theatre near you! please see linked ideas, I keep repeating myself just to warn you all.
if bitcoin breaks support at 109,368$ please expect all hell to break loose in the crypto and stock markets.

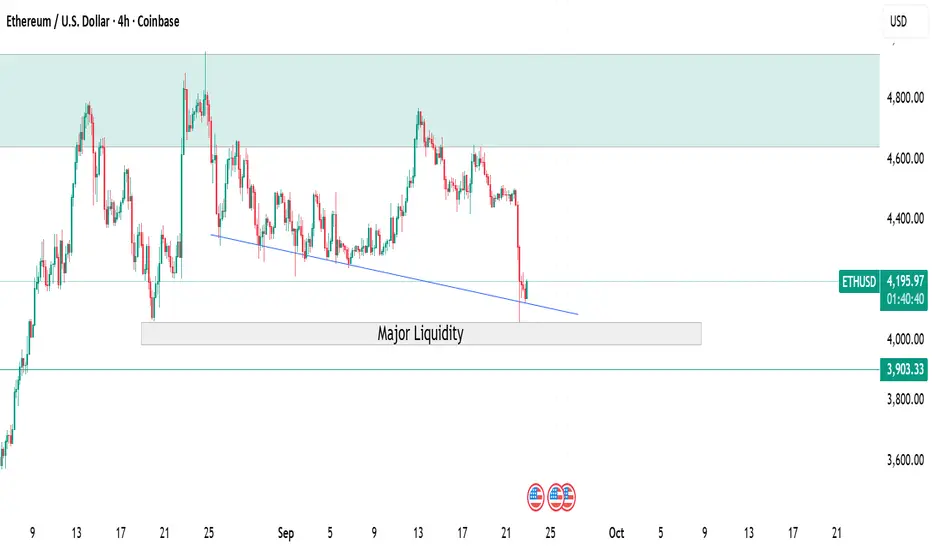
Ethereum next week:A huge amount of liquidity and SL orders await the Ethereum price to drop below $4,000.
What Next? www.cointrust.com
Buy Plan: ETH/USD (Monthly Timeframe)Buy Plan: ETH/USD (Monthly Timeframe)
1. Setup:
Price has formed a valid bullish monthly dealing range (DR Monthly).
Reaction observed from the lower part of the range (support area highlighted in red).
Trend shows recovery after the previous consolidation (green area).
2. Entry:
Buy at current price level near $4,126 – $4,140, after confirmation of bullish monthly momentum.
3. Stop Loss:
Below the lower wick of the recent monthly candle: $1,749.58.
4. Target:
Aggressive target around $35,534 (upper green zone on chart).
5. Risk-Reward:
High R:R potential due to large upward target compared to risk.
6. Notes:
Patience is key: Wait for monthly candle close confirmation.
Avoid entering if price closes below the red support zone.
Monitor for any reversal patterns forming at resistance levels.

ETHUSD NEW OUTLOOK According to H1 analysis ETHUSD market is running in selling pressure from last two day now market will be touch the RESISTANCE LEVEL then it will be falling more so be carefull use money management
TRADE AT YOUR OWN RISK
REGARD ALBERET

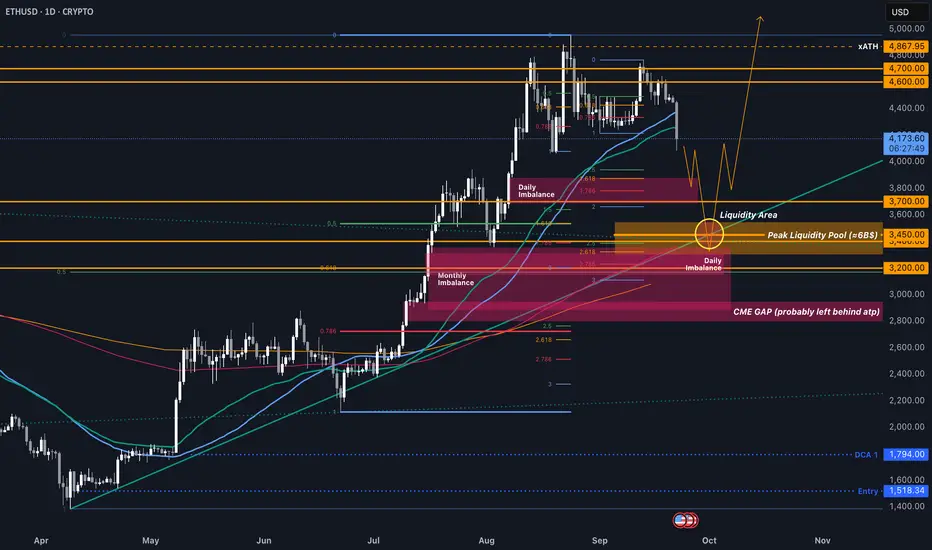
Possible Pre-Skyrocket ManipulationSince every soul on this earth knows that we will see huge bull-moves with given and upcoming rate cuts + october price action, its not unlikely that we COULD manipulate even lower after the Billion Dollar liquidation move overnight.
IF we do so, we would do it pretty fast and continue the displacement from the bearish head and shoulders pattern that broke the daily 50 EMA%SMA in the next few weeks.
On a technical site, there is still a huge amount of liquidity on CRYPTO:ETHUSD left (around 20B$), most accumulated at around 3.450$.
Strangely enough, that area matches the current ranges equilibrium, standard deviation levels of prior bearish manipulation moves, KEY SR Levels of 3400 and 3200, monthly and daily imbalances (which will get filled sooner or later), the 200D EMA and 50W EMA, AND the current htf bullish trendline and broken triangle resistance...
If we hit this before mid-October, these will be free longs, and I will DCA into my position, which sits at 1.794$ currently.
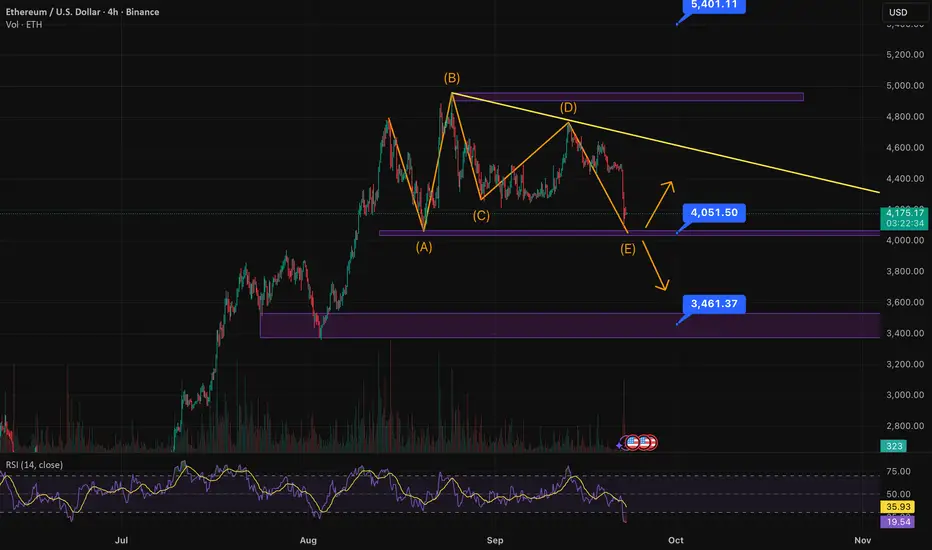
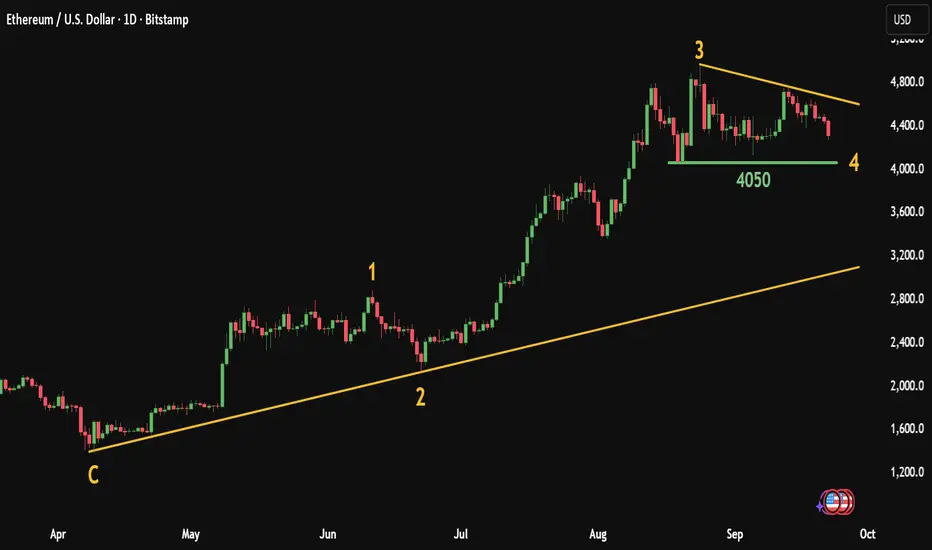
$ETH 09/22: New ATH or continue dumping?CRYPTOCAP:ETH is most likely in Wave 4 of an Elliott 5-wave structure. The ideal scenario is a Triangle Correction for Wave 4. If that plays out, we’ll see a breakout into Wave 5 after this consolidation.
Key level: $4,050. This is the crucial support to watch. A solid bounce here could launch ETH into Wave 5, targeting ~$5,400 (based on the 0.618–1.0 Fib extension of Waves 1–3).
Bearish case: If ETH breaks below $4,050 with strong volume, price could slide further toward the previous low near $3,460.
Signals to watch:
Volume is fading, which fits the triangle pattern.
RSI is oversold, hinting at a potential bounce.
Keep an eye on divergences in MACD/Stochastic for reversal confirmation.
Wave 4 is usually longer and more complex than Wave 2, so ETH may still chop sideways before the real breakout.
👉 Bottom line: ETH is at a key crossroads — hold $4,050 and aim for $5,400 on Wave 5, or lose support and revisit $3,460.
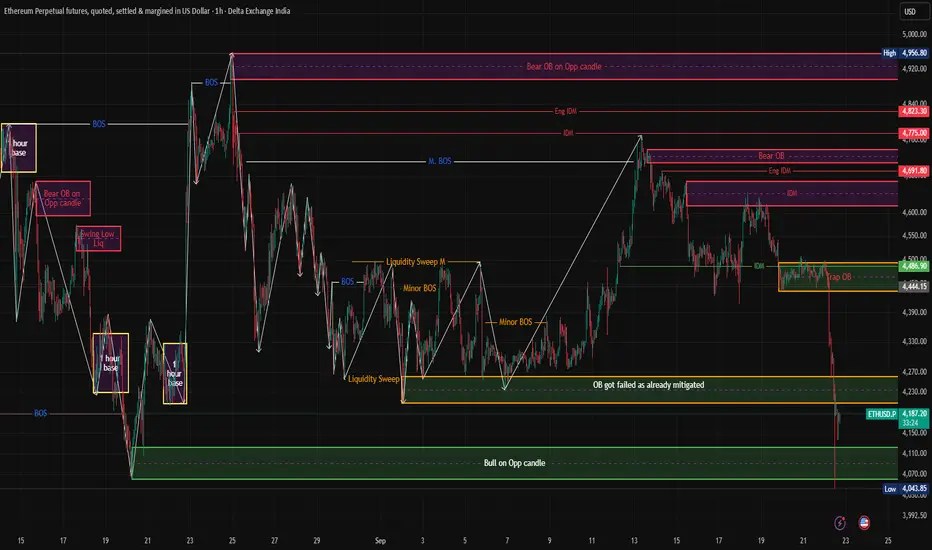
A Clear Bullish set up is getting ready in ETH ETH is showing a bullish setup after recent liquidity sweeps and reaction from the higher-timeframe demand zone.
🔑 Key Observations:
Price tapped into the Bullish Opposite Candle Order Block (4040–4100 zone) and reacted strongly.
A Liquidity Sweep & smart money is likely accumulating.
The Trap Bear OB around 4440–4480 acts as the first magnet for price.
If momentum continues, the next liquidity pool sits higher near 4690–4820, where multiple Bear OBs + IDM overlap.
📌 Trading Plan (Sniper Style):
Entry Zone: 4040–4100 (Bull OB)
Stop Loss: Below 4030 (invalidation)
Target 1: 4440–4480 (Trap OB)
Target 2: 4690–4820 (Major Supply / Bear OB cluster)
💡 Bias: Bullish as long as 4040 demand holds. A clean close below would invalidate the setup.
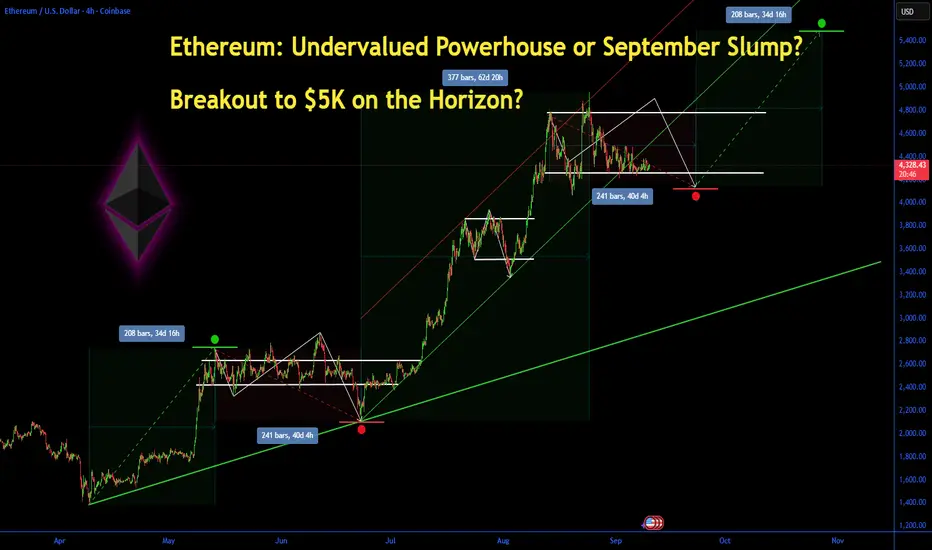
Ethereum: Undervalued Powerhouse or September Slump? Ethereum: Undervalued Powerhouse or September Slump? Breakout to $5K on the Horizon?
Ethereum (ETH) has held steady around $4,300 this month amid a choppy crypto market, down about 15% from its August all-time high but showing resilience with a modest 0.52% gain today to $4,328.5. Early September saw over $500 million in outflows from spot Ethereum ETFs, reversing summer inflows and fueling doubts about institutional appetite.
Yet, with analysts eyeing a potential rally to $9,000–$12,000 by year-end 2025 driven by ETF rotation and broader adoption, is ETH the undervalued blue-chip crypto ready for a rebound, or will seasonal weakness cap its upside? Let's dive into the fundamentals, charts, and key levels to navigate this pivotal moment.
Fundamental Analysis
Ethereum's core drivers remain tied to its ecosystem growth and macroeconomic tailwinds, but recent ETF flows have introduced volatility. As the backbone for DeFi, NFTs, and layer-2 scaling, ETH benefits from rising staking rewards and network upgrades like Dencun, which have boosted efficiency.
Analysts project ETH could hit $5,194 by late September, with long-term forecasts up to $12,000 in 2025 if institutional demand surges via ETFs. However, sticky inflation and Fed policy uncertainty could delay rate cuts, pressuring risk assets like crypto.
- **Positive:**
- Record ETF inflows in July–August signal growing institutional interest; recent positive territory returns hint at rotation back to ETH.
- Staking growth and adoption in DeFi (e.g., Aave, Uniswap) underscore undervaluation, with ETH's market cap at ~$520 billion versus Bitcoin's dominance.
- Broader trends like AI-blockchain integration and regulatory clarity (e.g., potential spot ETFs for challengers like Sui) bolster ETH's utility.
- **Negative:**
- $500M+ ETF outflows in early September reflect profit-taking and risk-off sentiment amid U.S. labor market weakness.
- Seasonal September weakness in crypto, compounded by geopolitical risks, could extend the correction if Bitcoin falters.
Technical Analysis
On the daily chart, ETH is coiling in a tight symmetrical triangle pattern after bouncing from the $4,320–$4,325 support base, with volume picking up on the upside. This consolidation follows a descending channel breakdown, but the hold above key EMAs suggests building momentum for a potential impulse wave higher. Current price: $4,328.5, with VWAP at $4,300 providing intraday support.
Key indicators:
- **RSI (14-day):** Hovering at 48, neutral but nearing oversold territory— a dip below 40 could signal a strong bounce. 📈
- **MACD:** Histogram in negative territory, but the signal line crossover is imminent, hinting at bullish divergence if volume confirms. ⚠️
- **Moving Averages:** Price above the 21-day EMA ($4,280) but testing the 50-day SMA ($4,350)—a sustained hold here avoids short-term bearish pressure.
Support/Resistance: Firm support at $4,320 (recent low and 200-day EMA), with major resistance at $4,500 (August high). Patterns/Momentum: The triangle apex nears; a bullish breakout above $4,500 could target $4,800–$4,952, while failure risks a retest of $4,200. 🟢 Bullish signals: Accumulation on hourly charts. 🔴 Bearish risks: Death cross if 50-day SMA flips below 200-day.
Scenarios and Risk Management
- **Bullish Scenario:** A clean break above $4,500 on ETF inflow news or positive macro data (e.g., softer PCE) targets $4,800 initially, then $5,000–$9,000 by Q4. Buy on pullbacks to $4,320 support for optimal entry.
- **Bearish Scenario:** Drop below $4,320 eyes $4,200 (psychological level); a full death cross could accelerate to $3,800. Avoid longs if Bitcoin slips under $60K.
- **Neutral/Goldilocks:** Range-bound $4,200–$4,500 if data remains mixed, ideal for scalping or options plays.
Risk Tips: Set stops 2–3% below support ($4,200) to cap losses. Risk no more than 1–2% of portfolio per trade. Diversify with BTC or stablecoins to hedge crypto correlations—avoid overexposure in this volatile September.
Conclusion/Outlook
Overall, a bullish bias emerges if ETH reclaims $4,500 and ETF flows reverse, positioning it as an undervalued play with 100%+ upside potential into 2025 amid institutional rotation.
But watch today's crypto volatility and upcoming Fed signals for confirmation—this fits the classic September Effect of weakness before Q4 rallies. What's your take? Bullish on ETH's rebound or sitting out the slump? Share in the comments!
ETH/USD – Major Breakdown, Heavy Sell Pressure🔴 SHORT under $4,200 – target $4,083
Ethereum trades at $4,171, deeply under SMA200 ($4,435). Resistance: $4,500, support: $4,083. RSI at 28, oversold, but sellers remain dominant.
📖 Keywords: #ETHUSD #Ethereum #CryptoCrash #AltcoinSelling

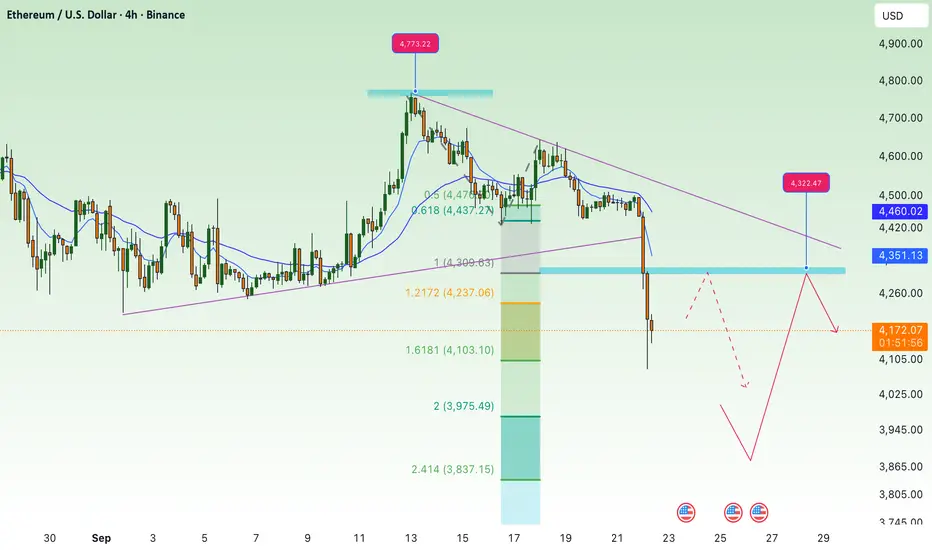
break support, continue to correct downETH 4H Chart Analysis
• Breakout Zone:
ETH has broken below the $4,360 – $4,330 zone (purple box), which previously served as strong support. This signals a shift in sentiment toward bearish momentum.
• Current Price Action:
After a sharp drop, ETH is consolidating around $4,170, hinting at a possible short-term rebound before continuing its downward structure.
• Resistance Levels:
• $4,360 – $4,330: Recently broken support, now acting as strong resistance.
• $4,505: Next resistance above, in line with prior range highs.
• Support Levels:
• $4,166: First Fib extension target, currently being tested.
• $3,880 – $3,900: Major support zone if price declines further (2.618 Fib extension + horizontal demand zone).
• Outlook:
ETH may retest the $4,330 – $4,360 resistance before continuing lower. If bearish pressure persists, the next downside target is around $3,880 – $3,900.
ETH: Short-Term Retracement, Long-Term BullishAfter a strong upward rally, ETH’s price is currently in a phase of retracement and consolidation. Short-term upward momentum has weakened somewhat, leaving it under pressure to pull back. However, the MA20 and MA60 continue to maintain a solid upward trend, providing medium-term support for the price. That said, the MACD histogram has shown short-term contraction, indicating a slowdown in the upward momentum.
Overall, ETH’s price action today is characterized by short-term retracement but sustained upward potential in the medium to long term.
Nevertheless, the cryptocurrency market is highly volatile, so investors should closely monitor market developments and relevant news to adjust their investment strategies in a timely manner

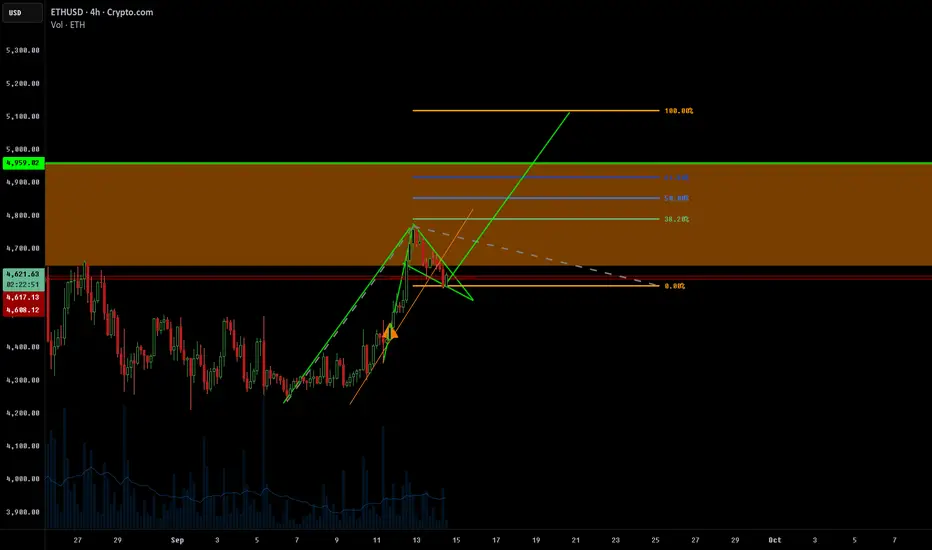
ETH | New all time highs in sight Strategy: Impulse Correction
Direction: Bullish
Moving Average: Blue above Red
Fib Retracement: 38.2 reached
MACD > 0
1st Target = 4955
2nd Target = 5350
3rd Target = 5859
Entry: 4614
SL: 4300
Trade 7/20

ETH and Crypto going for weekly correction levels?Everything explained in video, let me know if I missed anything 🙏🏾
Don't forget to like this if you would love to see more of these reviews!

ETH Elliott Wave Analysis: Key Support at $4,050, Targets $5,200The attached chart clearly illustrates that Ethereum’s current price action is following a classic Elliott Wave structure, with three major impulsive waves completed and the market currently consolidating within the fourth corrective wave.
Ⅰ. Completed Waves
Wave C (the bottom): Marked the starting point of the new bullish cycle, around the $1,700 – $1,800 levels.
Wave 1: The initial impulsive rally, reaching $2,900 – $3,000.
Wave 2: A sideways/ corrective decline, which respected the previous bottom and maintained the overall bullish structure.
Wave 3: The strongest and most extended impulsive wave, pushing price aggressively to $4,800 – $4,900, showing the typical momentum associated with third waves.
Ⅱ. Current Phase – Wave 4
Price is consolidating within a descending contracting triangle, which is typical of a fourth-wave correction.
The key support lies at $4,050, acting as the main level to preserve the bullish Elliott structure.
Wave 4 is usually more complex and sideways than Wave 2, which fits well with the current market behavior.
Ⅲ. Outlook – Wave 5
As long as $4,050 holds without a daily close below it, the most likely scenario is the start of the fifth impulsive wave upward.
This wave is expected to break above the Wave 3 peak at $4,800 and extend into new highs.
Potential upside targets: $5,200 – $5,500, with room for higher levels if institutional momentum drives further expansion.
Conclusion:
Ethereum is unfolding within a clear Elliott Wave bullish cycle. The ongoing Wave 4 correction is consolidating around the $4,050 support level, which is the key pivot to watch. Holding this zone increases the probability of a Wave 5 rally, potentially driving ETH to fresh all-time highs in the coming weeks.
Ethereum Finally Clears Path Towards $5,000+Should Ethereum maintain support above $4,245 over the next few days, it should solidify its intention for a run above $5,000 by mid-late October.
Plenty of bears await the arrival.

ETH – Symmetrical Triangle Compression📆 On the 6H timeframe, CRYPTOCAP:ETH is consolidating inside a symmetrical triangle 🛡️
This compression phase often precedes a sharp directional move — either a breakout to the upside or a breakdown if support gives way ⚡. Traders typically watch these setups closely as volatility tends to expand after the squeeze.
👀 Keep an eye on this structure — the next move could be significant.
Not financial advice.

Ascending channel, symmetrical triangleEthereum on the dayli chart is trading in a ascending channel and a symmetrical triangle.
Key support of the channel and symmetrical triangle is at 4400 when a break above 4750 would mean a confirmed breakout of the symmetrical triangle with a target around 5700
Ethereum is also still trading above the 50 rsi wich means there is still bullish momentum.
The massive insitutional investments and the rate cuts could send ethereum to $10.000 in Q4
