Ethereum: The Long Game, The Smart AccumulationEthereum Long-Term Bull Thesis with Accumulation Perspective
Ethereum remains at the core of the smart contract revolution, and the long-term structure continues to validate the bullish thesis. With scaling solutions gaining traction, institutional participation increasing, and ETH’s utility expanding across DeFi, gaming, tokenization, and beyond, the macro case for higher valuations over the coming years is undeniable.
From a price-structure perspective, ETH has broken above critical resistance and is sustaining momentum near multi-year highs, underscoring the strength of the current cycle. I remain firmly bullish on Ethereum’s long-term trajectory, viewing it not just as an asset, but as the backbone of the evolving decentralized economy.
That said, corrections are part of any healthy uptrend. Should the market provide a pullback, I’m eyeing the $3,200–$3,500 zone as a major accumulation area. This range is reinforced by strong confluence of historical support, key trendline intersections, and prior consolidation bases visible on both the daily and 4H charts. In my view, this zone represents where value buyers will reload in anticipation of Ethereum’s next leg higher.
In essence, my outlook does not change with short-term fluctuations: I am a long-term believer in ETH’s growth story. A correction into the $3,200–$3,500 accumulation zone would not be weakness — it would be opportunity.
Summary: Long-term bullish, unwavering conviction. Any dip toward the $3,200–$3,500 range is a gift for accumulation in an asset that I believe will continue to redefine digital finance.
Trade ideas

ETH/USD Rebounds from Support, Eyes 4,767ETH/USD bounced from a protected low at 4,464, showing early signs of recovery. If price holds above support, a move toward the previous swing high at 4,767 is likely. The setup favors buyers as long as the protected low is not broken.
This analysis is for educational purposes only and does not constitute financial advice.

The first step towards 5k - ETH weekly update Sep 15 - 21thDear investors and traders,
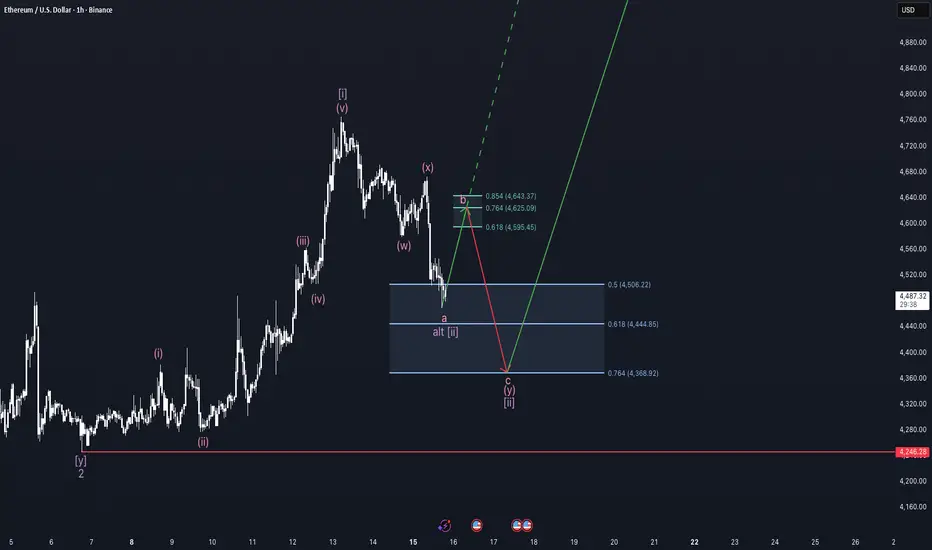
Ethereum is currently in the second wave of the minute cycle within the larger third wave unfolding in the minor cycle.Zooming into the fractal structure of the mentioned second wave, we can easily recognize the double three pattern as shown on the chart. My primary expactation therefore is a combination of a flat structure as a minuette wave w and a following zig zag a minuette wave y. I have chosen this scenario, because it's typical for altcoins to retrace their wave two a bit deeper then assets do normally. Also, the flat structure hasn't corrected this second wave too far, making a larger pullback likely. The zig zag probably made his subminuette wave a and should retrace now to levels of around 4.6k. The alternative scenario would be, that this second wave is already completed and with that we would be looking forward to 5k. For the alternative scenario to be completed, we need ETH to climb higher than the previous high of the minuette wave x.
Moving on to the liquidity analysis, we can see why this is my primary scenario: A massive amount of liquidity sitting just above the with the red line shown low of the minor wave two. I think we are going to drop again in the direction of this liquidity, but I hope it is going to melt down as people fear to get liquidated. The drawn in price target surely isn't where the liquidity sits, but it's where most fibonacci levels come together. The Orderbook is relatively empty in nearer space, but there is a large amount of short orders sitting at 5k.
Derivative data shows us turbulent funding rates because of people trying to catch this drop with large leverage market orders and getting liquidated, making the funding rate apparently to come back, maybe because they fear to loose more money now. Open interest stagnates, which is on the one hand positive because there are no more short positions adding up but this also means on the other hand that there are no long positions coming in. One thing I also noted in relation to people trying to catch the drop and burning themselves is that the liquidations are declining, which is indicating the leverage is decreasing.
Coming to exchange flows, the exchanges currently record an inflow of ethereum meaning that people are probably moving their coins from wallets to the exchange to sell them, which is a bearish signal. Also notable is that the exchange reserve is increasing, also indicating that people sell their ethereum.
The seasonality of ethereum shows us that the current Q3 was doing exceptionally well for ethereum and looking forward Q4 is also going to be green with a probability of 60%. September in the past was rather bearish then bullish, flipping the probabilities to a 40% probability to get a positive result. Nonetheless, the average return of September is 7%, which sparks hope.
Looking to Blackrock and other whales and entities, we can clearly see that Blackrock sold a part of it's ethereum (10k ETH) just slightly before the top and not buying again till now indicating the bottom is not in yet. The ETFs is still getting inflows, showing institutions accumulating ethereum.
All in all I am long and I think that the anticipated lows are optimal prices to establish swing long positions. Crucial for a impulsive move and the transition from a minute wave two to a minute wave 3 is the decline of liquidity at the low of the minor wave two.
Ethereum (ETHUSD) Technical OutlookEthereum remains in a critical yet bullish consolidation phase, trading sideways near all-time highs. This kind of price action often precedes major breakouts, especially with macro tailwinds building — the Fed is expected to cut rates this week, adding liquidity to the market.
🔍 Technical Setup
ETH is currently attempting a breakout from a symmetrical triangle — a bullish continuation pattern in trending markets.
✅ Uptrend confirmed by:
Higher highs
Higher lows
Strong support structure
🎯 Key Levels to Watch
Immediate target zone: $5,700 – $5,800
Macro rally potential: $7,000 – $8,000
Crucial support: $4,000 – $4,200
As long as ETH holds above $4,000, there’s no technical reason to be bearish.

HARD SHORTMy former analysis successfully landed to target zone. And now market wants a pull back.
1-Above there is low liqudation
2-Next week we will probably see a rate cut. thats why I am a little nervous abot open short
3-Till that day I think whales will chase cheap asset that is where my courage come from
4-Market wants to see a pull back
be careful about short you may just want to open long at the below
Always manage your own risks this is not a investment advise I am not responsible neither your loss nor profit.

This is the graph I showed stream of our 2 possible scenarios Tbh im pretty new to this whole thing, however certainly put in hours of research into all sorts of techniques. However 2 things interest me in these scenarios. 1. Where everyone makes money. And 2. Only the big market makers make money.
For the first one we would need that dump before tomorrow starts. Then a small pump late Monday early Tuesday. Then a drawback Tuesday night into Wednesday. Then providing space on rsi and macD for a wave 3. However theres the chance that all of unclesams friends aunts and uncles could come together and say, we'll here's your rate cuts but we're gonna dump it on you. Cause "fear of reccesion" after dropping a 50 pt rate cuts. So it's anyone's game. But food for thought.
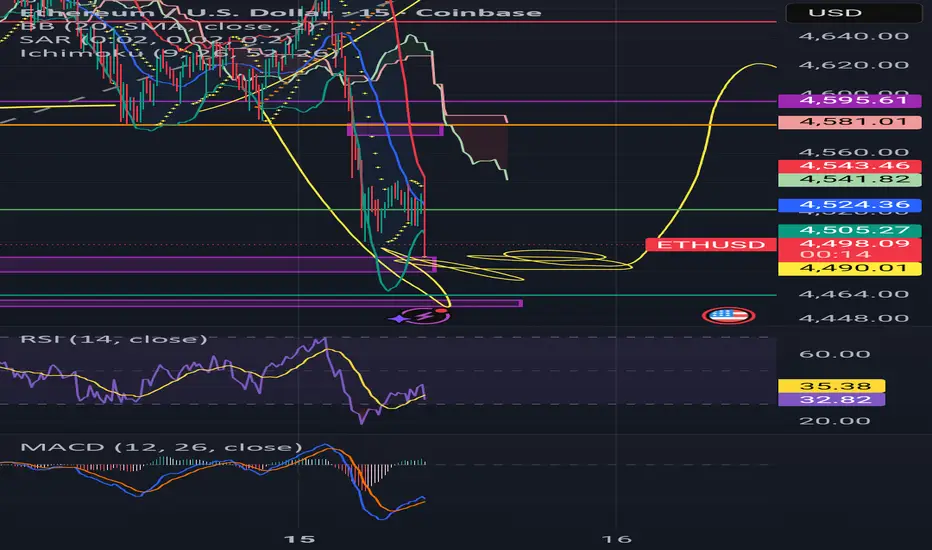
#ETH/USDT Testing Wedge Breakout Amid Key Support#ETH
The price is moving within a descending channel on the 1-hour frame, adhering well to it, and is heading for a strong breakout and retest.
We have a bearish trend on the RSI indicator that is about to be broken and retested, which supports the upward move.
There is a major support area in green at 4480, which represents a strong support point.
For inquiries, please leave a comment.
We are in a consolidation trend above the 100 Moving Average.
Entry price: 4524
First target: 4585
Second target: 4645
Third target: 4715
Don't forget a simple matter: capital management.
When you reach the first target, save some money and then change your stop-loss order to an entry order.
For inquiries, please leave a comment.
Thank you.

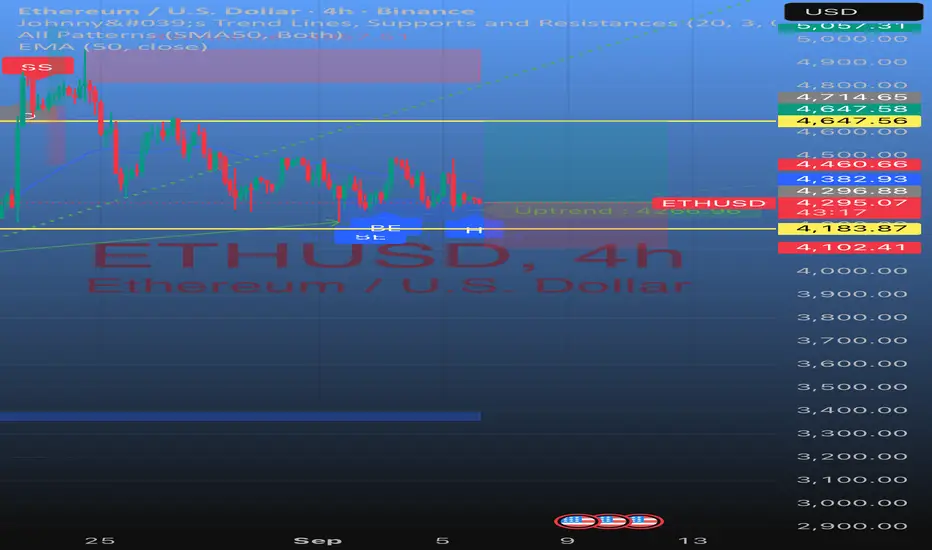
ETH/USD 2h chart with Ichimoku cloud.ETH/USD 2h chart with Ichimoku cloud, resistance zone, and two marked "Target Points."
Based on the chart I have shared:
Immediate resistance: Around $4,650 – $4,750 (yellow zone).
Breakdown confirmed (BOS): Price rejected from resistance and broke down through the cloud.
Targets marked on chart:
1. First target zone: Around $4,440 – $4,450
2. Second target zone: Around $4,230 – $4,250
🔻 So, if bearish momentum continues, ETH has downside targets near $4,450 first, then possibly $4,250.

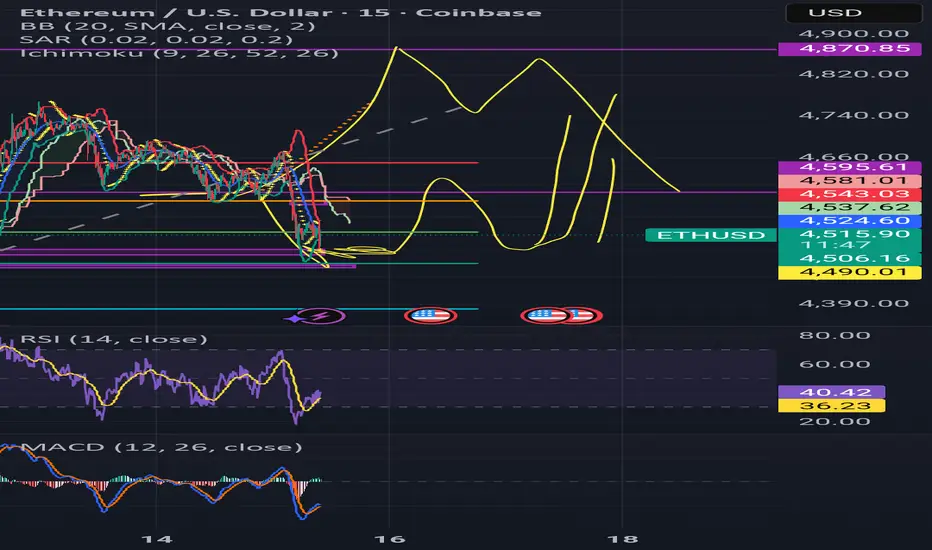
ETH/USD (1H timeframe, Coinbase):ETH/USD (1H timeframe, Coinbase):
Price has broken out above the descending trendline.
It has cleared the resistance zone around 4,365 – 4,380 (yellow box).
Ichimoku cloud is supportive of a bullish move i have already marked two "Target Points" on your chart.
📍 Targets shown on my chart:
1. First Target Zone: around 4,680 – 4,690
2. Second Target Zone: around 4,720 – 4,730
⚠ Notes:
Watch for a retest of the breakout zone (4,365 – 4,380) for confirmation.
If price fails to hold above 4,365, momentum may weaken.

Where Is ETH Going This Cycle? (Educational Perspective)
Every cycle brings the same question:
Where is Ethereum heading next? Most look for price guesses, but that’s a distraction. The real advantage comes from knowing what factors will drive ETH’s direction. Understanding the drivers doesn’t require prediction, it requires planning.
A Look Back: ETH in Previous Cycles
Ethereum has repeatedly proven its resilience and innovation leadership:
2016–2017: Breakout fueled by ICO boom—ETH became the token-launch backbone.
2018–2019: Bear market and ICO collapse—but builders persisted.
2020–2021: DeFi and NFT surge—Ethereum powered the blockchain economy as “digital oil.”
2022–2023: Post-Merge era—transition to PoS and reduced issuance amid regulatory uncertainty.
Through every phase, ETH stayed central to crypto’s evolution.
On-Chain Metrics to Watch
Ethereum’s transparency lets us monitor structural strength in real time:
Active addresses gauge real network use.
Staking levels shrink available supply—over 35M ETH (≈30%) staked by mid-2025.
ETH locked in DeFi reflects collateral demand.
Gas fee burn continues to tighten supply post-EIP-1559.
Macro & Narrative Drivers (2024–2025 Upgrades & ETF Momentum)
Stories move markets, and Ethereum has some strong ones now:
Spot ETH ETF Launch: Nearly $500M in institutional inflows since mid-2024.
Staking Supply Constraint: Record ETH locked → tighter supply.
Technical Enhancements: Dencun (2024) and Pectra (2025) improving scalability and validator usability.
Regulatory & Macro Tailwinds: GENIUS Act, institutional adoption, favorable policies.
The Real Question Traders Should Ask
Price targets are clickbait. The real question is:
“Which factors will move ETH this cycle?”
By tracking ETF flows, staking ratios, upgrades, and macro conditions, traders avoid being surprised.

ETH Bullish Trend The chart shows a potential "ABC" corrective wave pattern, often seen as part of a larger bullish trend.
Wave (A): The initial strong upward move from around $3,000 to over $4,800.
Wave (B): A subsequent correction or consolidation phase, where the price pulled back and appears to be finding support around the $4,200 - $4,300 area (highlighted by the yellow line and the brown box). This area seems to have acted as both previous resistance and now potential support.
Wave (C): If the bullish trend continues, the expectation is for a new impulse wave upward, potentially targeting the area between $5,600 and $6,000, as indicated by the white box and the projected line. This would represent a breakout above the previous high of Wave (A).
In essence, the idea is: The recent pullback (Wave B) has found support, and if this support holds, the cryptocurrency could be poised for another significant upward move (Wave C) towards new highs.
Please note that this is a technical analysis interpretation based on the provided chart and is not financial advice.

ETH/USD – Sharp Breakdown🔴 SHORT below $4,650 – target $4,500
Ethereum trades at $4,520, plunging below SMA200 ($4,651). Resistance at $4,680–4,650, support at $4,500. RSI collapsed to 21, oversold but trend sharply bearish.

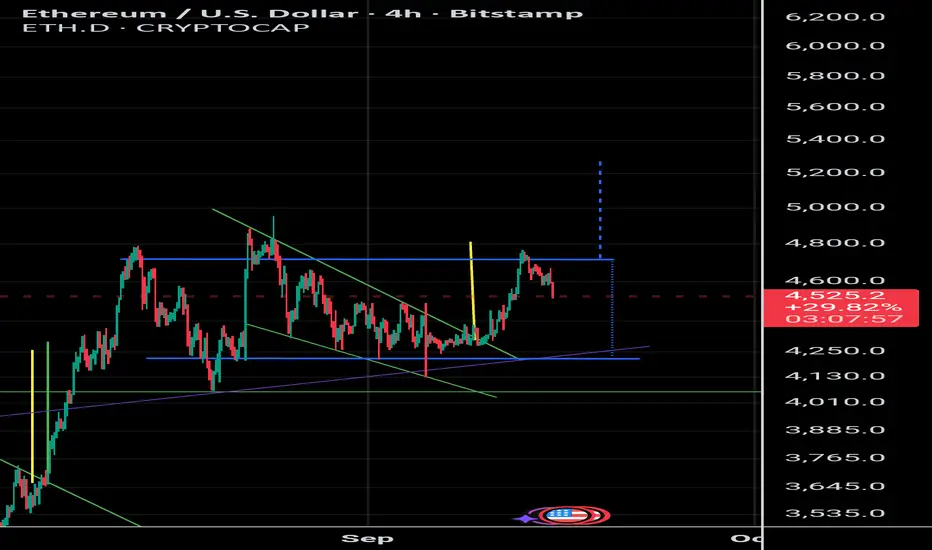
Adam&Eve pattern $5200 target!!ETH still bullish ling term.
Thus 4hr chart shows and adam and eve pattern, target to reach $5200....imo
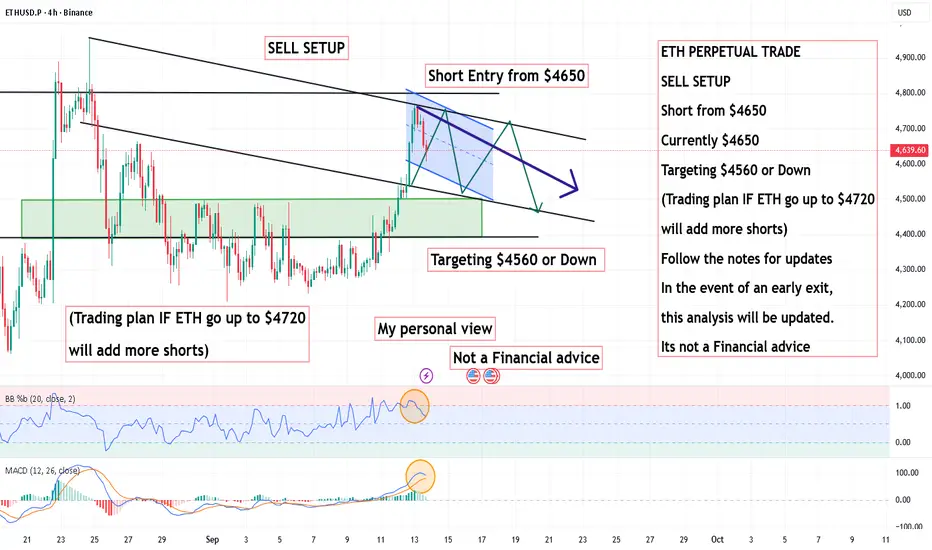
ETH PERPETUAL TRADE SELL SETUP Short from $4650ETH PERPETUAL TRADE
SELL SETUP
Short from $4650
Currently $4650
Targeting $4560 or Down
(Trading plan IF ETH go up to $4720
will add more shorts)
Follow the notes for updates
In the event of an early exit,
this analysis will be updated.
Its not a Financial advice
ETH head and shoulders?I hope I am wrong but it looks like ETH is forming a head and shoulders pattern. This coming week is decisive in determining if ETH will break out past $5k and reach new ATH's or if it will decline into a bear market.
The supply zone appears to begin at $4.6k and the nearest real demand zone is down at $2.5k.
I will be price watching closely this week as it is a decisive one. Best of luck, be careful.
Thoughts?

ETHUSD SELL 4870On the daily chart, ETHUDS stabilized and rebounded in the short term. Currently, we can pay attention to the resistance near 4870 above. This position is a potential short-selling position for the bearish bat pattern, and this position is in the previous supply area.

$ETHUSD: A Breath in the Thin AirGreetings, fellow navigators of the chart.
We find ourselves observing BITSTAMP:ETHUSD in the high altitudes, a territory where the air is thin and the next step must be taken with intention. After a powerful ascent that shattered the old structural ceiling around $3,800, price now pauses. This is not a moment for prophecy, but for observation. This is the market's breath —the exhale after a mighty inhale. Our task is to listen to its rhythm.
The Technical Landscape
The primary trend, like a great river, still flows upwards, defined by the long-term ascending trendlines. The immediate question, however, concerns the former resistance near $3,800. Will this old ceiling now become the new floor? A structure's true strength is only revealed when it is tested. A retest and hold of this level would be a powerful statement of acceptance by the market, paving the way for the next phase of the ascent.
The Philosophy: Two Paths from the Summit
In trading, we do not force a direction; we merely align with the path of least resistance as it reveals itself. Both the bull and the bear are part of the same ecosystem.
The Bullish Path: The patient bull waits for price to return to the ~$3,800 zone. They watch for signs of accumulation, for the market to build a new foundation upon the rubble of old resistance. This is the path of trend continuation. To fight a confirmed hold here would be to play the role of the salmon , exhausting oneself against a powerful current.
The Bearish Path: The tactical bear understands that even the strongest climb requires rest. A deeper correction allows for the bears to be " fattening up for winter ," a necessary phase to gather energy for a sustainable move higher. A return to a stronger base isn't a sign of failure, but of a healthy, functioning market. It is simply one piece of a much larger puzzle .
An Illustrative Setup
To illustrate how one might approach the bearish hypothesis, consider the following structure. This is not a prediction, but a plan—a way to engage with the market with defined risk.
Hypothesis: Short-term exhaustion prompts a corrective move towards a prior area of high activity.
Entry: ~$4,590.33
Invalidation: A close above ~$4,800 signals the immediate trend is resuming, and the corrective thesis is wrong.
Objective: ~$2,854.61, an area of prior structural significance.
This setup provides a logical framework for testing the bearish thesis. If invalidated, we simply listen to what the market told us and move on. The process is the goal.
Disclaimer: This is not financial advice. It is for educational and informational purposes only. Please conduct your own research and manage your risk accordingly.

Eth microLooking up to a reaction on the 5 min breaker block. Target is the big order block on H1, published on my last idea. These are my thoughts, based on my knowledge on technical analysis, this is not financial advice.

Target updated on ETHBig order block there. If it breaks, maybe we'll have a bigger push talking macro. These are my thoughts, based on my knowledge on technical analysis, this is not financial advice.
They deleted some of the last publications because my settings language was Spanish.
Is Crypto About To Explode: New Highs? The total crypto market cap is retesting $4 trillion.
We are now looking much more bullish on a technical basis across Ethereum & Bitcoin.
We may have had a failed breakdown in the Total Crypto market cap, which could provide the additional liquidity for another surge.
Recapturing Key Daily 7 & 20 MA's is a very positive sign.
Although still being net short BTC & ETH - I now have breakeven stop losses in place.
Ethereum chart is looking very explosive like it could have a move to $5500
ETH recently has defended a massive volume shelf which is a very bullish sign.
Keep on your radar: BMNR / SBET / MSTR / COIN / MARA

Lets lock in, this BearMarket(ETH)Here we have a classic wyckoff distribution on Ethereum. I'm predicting that we see at least $2600 ETH by October maybe the 15th. Great scalping opportunities will be had in these next four years.
I'm thinking this may be the longest bear market crypto has seen in quite some time.
This is where greatness is born only in a bear market true traders and believers survive.
