15 R:R setup for EthereumWe assume that this marks the beginning of a new uptrend for BTC. This setup offers an easy 15:1 risk-to-reward ratio.
Entry: 2534
Stop Loss: 2373.33
Target: 5000
This is for educational purposes only.
ETHUSD trade ideas

Ethereum is still bullish!#ETH
The price is moving within a descending channel on the 30-minute frame and is expected to break and continue upward.
We have a trend to stabilize above the 100 moving average once again.
We have a downtrend on the RSI indicator that supports the upward move with a breakout.
We have a support area at the lower boundary of the channel at 2450, acting as strong support from which the price can rebound.
We have a major support area in green that pushed the price upward at 2400.
Entry price: 2460.
First target: 2485.
Second target: 2510.
Third target: 2543.
To manage risk, don't forget stop loss and capital management.
When you reach the first target, save some profits and then change your stop order to an entry order.
For inquiries, please comment.
Thank you.

#ETH/USDT#ETH
The price is moving within a descending channel on the 1-hour frame, adhering well to it, and is on its way to breaking it strongly upwards and retesting it.
We are seeing a rebound from the lower boundary of the descending channel, which is support at 2427.
We have a downtrend on the RSI indicator that is about to break and retest, which supports the upward trend.
We are looking for stability above the 100 moving average.
Entry price: 2447
First target: 2476
Second target: 2500
Third target: 2533

Significant level in play on ETH/USDI intend to keep the following post concise and to the point.
As exhibited on the daily timeframe of ETH/USD (Ethereum versus the US dollar), price recently shook hands with support from US$2,332. Not only does this base serve as a historically significant barrier, but it also coincides with the 50-day simple moving average at US$2,305 and a trendline support, extended from the low of US$1,381.
Given the current support in play, I am closely monitoring the overhead decision point zone at US$2,571 – US$2,450. It was within this area that a ‘decision’ was made to whipsaw through the noted support area. Consequently, if price engulfs the said decision point, this could unearth a short-term bullish scenario towards resistance at US$2,813.
Written by FP Markets Chief Market Analyst Aaron Hill

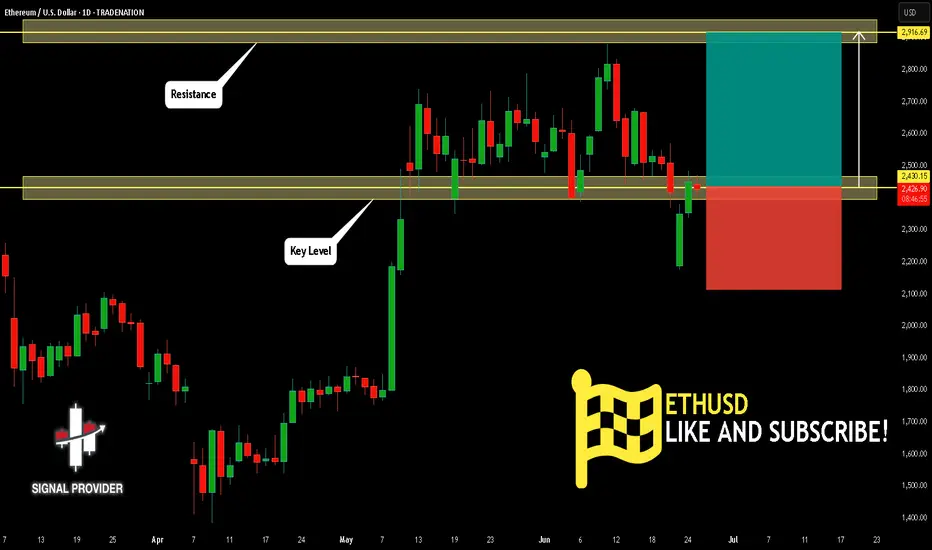
ETHUSD Is Going Up! Long!
Please, check our technical outlook for ETHUSD.
Time Frame: 1D
Current Trend: Bullish
Sentiment: Oversold (based on 7-period RSI)
Forecast: Bullish
The market is approaching a key horizontal level 2,430.15.
Considering the today's price action, probabilities will be high to see a movement to 2,916.69.
P.S
We determine oversold/overbought condition with RSI indicator.
When it drops below 30 - the market is considered to be oversold.
When it bounces above 70 - the market is considered to be overbought.
Disclosure: I am part of Trade Nation's Influencer program and receive a monthly fee for using their TradingView charts in my analysis.
Like and subscribe and comment my ideas if you enjoy them!
ETHUSD Breakout possible to reach 27000ETHUSD has Broken the trend and is likely to go 2700 after the liquidity.

ETHUSD selling momentum head and shoulder 📉 ETH/USD Technical Breakdown Alert 📉
🚨 Pattern Formation: Head & Shoulders + Descending Triangle 🚨
On the 4H time frame, ETH/USD has confirmed a Head and Shoulders pattern, with a strong descending triangle breakdown from the neckline at $2,450.
🔻 Bearish Momentum Building
The market structure is signaling further downside pressure. A clean break below the neckline has triggered a strong sell signal.
🎯 Technical Target
1st Support Zone: $1,765
(Watch this level for potential bounce or further continuation)
💡 This setup aligns with classic bearish continuation patterns — risk management is key as always.
📊 Stay sharp, trade smart.
👉 Like, Follow, Comment & Join our community for more real-time updates and technical setups.
— Livia 😜

ETH - Most Important LinesHere we have the most important lines drawn for ETH's current short term structure.
In terms of price we have a red and a green line.
The red line represents the strongest level for current sellers to offload. This level is right around $2,850. It was a strong level for old buyers and since price has been trading below it has been flipped into resistance and continues to be a level for sellers. Once price can start closing daily candles above this level it will be flipped back into an important demand zone and price can move higher.
The green line represents the strongest level for current buyers to accumulate. This level is right around $2,150 and has been defended by buyers for the past year with many tests.
If you go back and look at our tradingview posts for the past year you will see how we have been pointing out these levels as extremely important. Current day, not only did the recent top come in at $2,879 but the recent low also came in at $2,111 giving validity to these levels mentioned above.
In addition to these price levels we have also added important trendlines that stretch back many months. A white trendline and two orange trendlines. The white trendline is what we are currently watching to see if it continues to act as resistance. If price is able to break above somewhere within those 2 orange trendlines is where we could see ETH's price top out again. If price is able to break above both orange trendlines that is when we will finally see this bearish momentum flip and start the climb back towards the critical $4,100 level.

ETH BUY BIASEthereum (ETH/USD) – Weekly Chart Summary
• Current Price: ~$2,250
• Trend: Bearish structure with lower highs and lower lows
• Key Zones:
• Support (Demand): $1,800–$2,000 and $1,400–$1,700
• Resistance: $2,800–$3,600 (liquidity zone)
• 200-Week MA: Acting as dynamic support near current levels
• Outlook: Potential drop into demand zones, followed by a strong bullish reversal targeting the $3,200–$3,600 region
• Risk: Failure to hold $1,800 could trigger deeper losses
📈 Bias: Wait for price to reach key demand zones before entering long positions.

Bullish bounce off 50% Fibonacci support?The Ethereum (ETH/USD) is reacting off the pivot which has been identified as an overlap support and could bounce to the 1st resistance.
Pivot: 2,089.45
1st Support: 1,669.20
1st Resistance: 2,687.43
Risk Warning:
Trading Forex and CFDs carries a high level of risk to your capital and you should only trade with money you can afford to lose. Trading Forex and CFDs may not be suitable for all investors, so please ensure that you fully understand the risks involved and seek independent advice if necessary.
Disclaimer:
The above opinions given constitute general market commentary, and do not constitute the opinion or advice of IC Markets or any form of personal or investment advice.
Any opinions, news, research, analyses, prices, other information, or links to third-party sites contained on this website are provided on an "as-is" basis, are intended only to be informative, is not an advice nor a recommendation, nor research, or a record of our trading prices, or an offer of, or solicitation for a transaction in any financial instrument and thus should not be treated as such. The information provided does not involve any specific investment objectives, financial situation and needs of any specific person who may receive it. Please be aware, that past performance is not a reliable indicator of future performance and/or results. Past Performance or Forward-looking scenarios based upon the reasonable beliefs of the third-party provider are not a guarantee of future performance. Actual results may differ materially from those anticipated in forward-looking or past performance statements. IC Markets makes no representation or warranty and assumes no liability as to the accuracy or completeness of the information provided, nor any loss arising from any investment based on a recommendation, forecast or any information supplied by any third-party.

Ethereum/US Dollar 4-Hour Chart (BINANCE)4-hour price movement of Ethereum (ETH) against the US Dollar (USD) on the BINANCE exchange. The current price is $2,211.36, reflecting a decrease of $85.21 (-3.71%). The chart highlights a recent downward trend with a potential support zone between approximately $2,100 and $2,200, followed by a possible upward movement as indicated by the shaded area. The data is captured as of June 23, 2025.

Ethusd buy setup H4Hello! Friends,
Greetings. Please leave a Like if you like the idea.
Before start talking about technical Let's share your LOVE by giving me LIKES to support this work. Thanks in advance.

ETHMOnthly down,weekly UP , daily Down ..once weekly down (sure drop), wait confirmation to enter in OTE Sell


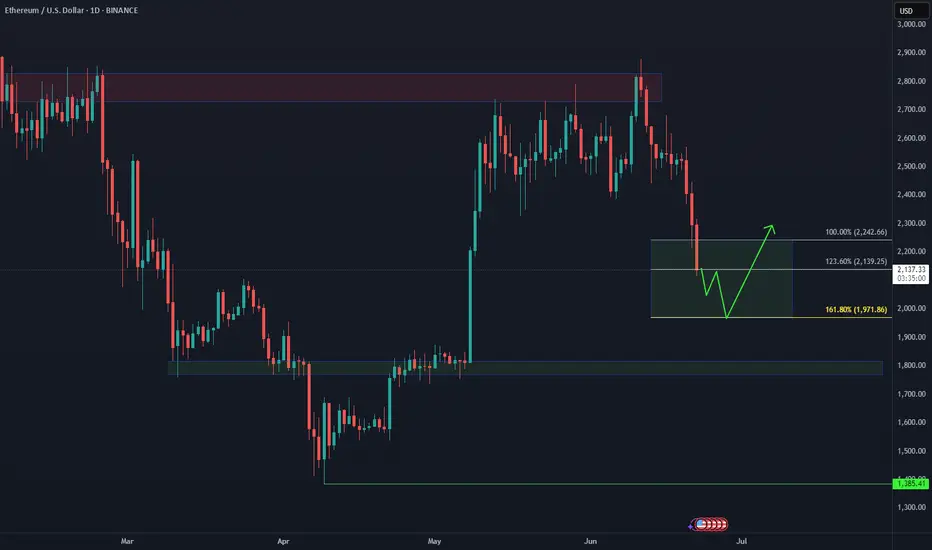
Ethereum: How Deep Into the Buying Area?📉 CRYPTO:ETHUSD is currently testing the extreme buying zone $2140–$1970 — a key area where a bullish reaction is anticipated. But if the bounce fails to materialize next week, eyes shift to the next potential demand zone near $1800.
This level aligns with prior structure and could offer a stronger base for the next leg higher — as long as the broader structure remains intact.
ETHUSD Break- Test- GO!!! Nothing Changed! 3rd EditionI have been warning about this for some time. Please visit my previous two posts for more info and updates.
Magic!
Click boost, follow, and subscribe for more. Let's get to 5,000 followers ))

ETH UPDATE Eth is at a major strong support of 2200.
But i dont think this gonna hold much longer and we will go for the blue box,
Reason is bitcoin, btc broke the major major support of 100k and gave a 4h closing below 100k which is a breakdown of a sentimental support too.
Look for short, dont long right now until market cools down from the war.
If iran retaliates and a war officially breaks then were going to 90k or below, we also have a cme gap around that point
Stay safe everyone

Et herino getting rejected - bigger correction likely- several strong wicks to the upside
- yellow stripe signal on the 2D time-frame (comments)
- Bitcoin looking like it wants lower as well
Best case scenario for ETH here would be a correction that leads to a HIGHER LOW above 2000$. Potential surge above 3000$ and 4000$ later this year.

ETHUSD: Will Go Up! Long!
My dear friends,
Today we will analyse ETHUSD together☺️
The price is near a wide key level
and the pair is approaching a significant decision level of 2,270.9 Therefore, a strong bullish reaction here could determine the next move up.We will watch for a confirmation candle, and then target the next key level of 2,290.8.Recommend Stop-loss is beyond the current level.
❤️Sending you lots of Love and Hugs❤️

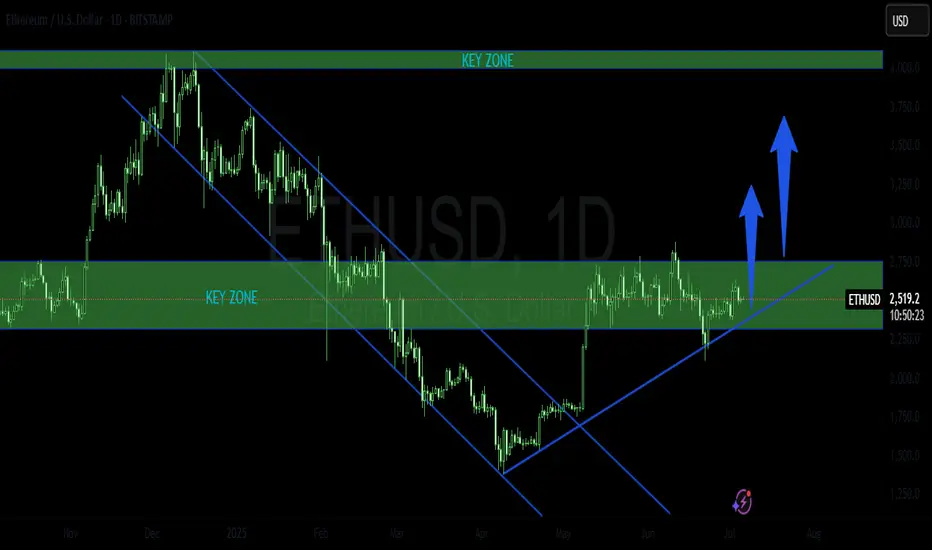
Ethereum setup with a 14 R:R.Let’s see if this time marks the beginning of bullish momentum.
This setup offers a 14:1 risk-to-reward ratio
Entry at 2560
Stop loss 2457
Target at 4000.

ETHUSD LONG TRADE PLANThe instrument recently broke out of a bearish channel and recently formed what seem like a bullish trend. It is currently trading within an accumulation phase. I will be monitoring this zone for a breakout.
Please do your own analysis before placing any trades.
Cheers and Happy Trading !!!!
ETHUSD: Next Move Is Down! Short!
My dear friends,
Today we will analyse ETHUSD together☺️
The in-trend continuation seems likely as the current long-term trend appears to be strong, and price is holding below a key level of 2,514.4 So a bearish continuation seems plausible, targeting the next low. We should enter on confirmation, and place a stop-loss beyond the recent swing level.
❤️Sending you lots of Love and Hugs❤️

ETH / USDC Liquidity Pool RangeTightening up the range a little. Looking good with horizontal lines setting the new range.
