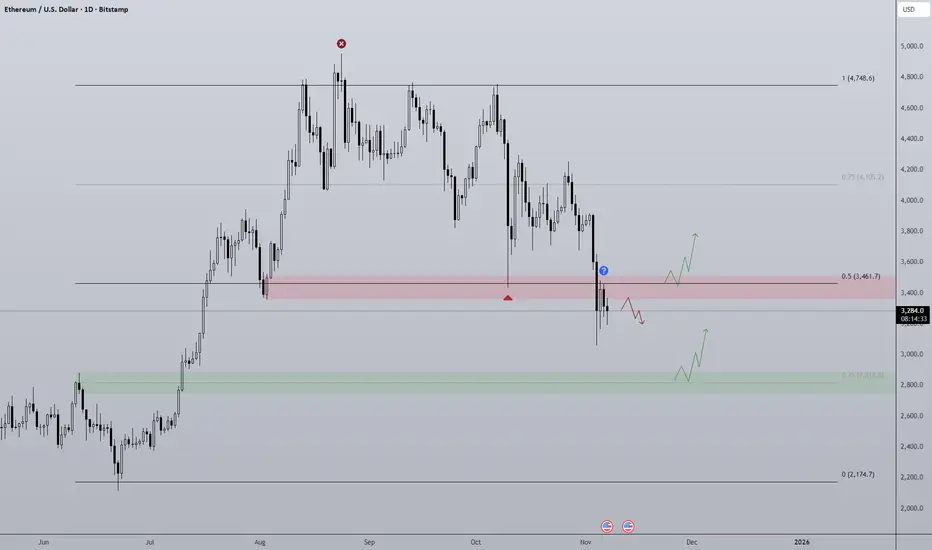
Ethereum at a CrossroadsThe chart shows ETH/USD on the daily timeframe, illustrating a clear Cup & Handle pattern formation. This structure typically signals a continuation of a long-term uptrend, but a short-term correction remains possible before any major breakout.
Short-Term Outlook (next 2–3 months)
Ethereum is currently trading around $3,500, having faced strong resistance near $4,800. The 50-day SMA around $4,000 is acting as a resistance level as well.
Likely short-term scenario: Continued correction toward the $3,200–$2,800 support zone
If $3,200 breaks: The next major support sits near $2,400
If $3,200 holds and ETH reclaims $4,000: A retest of $4,800 becomes likely
Target (bullish): $4,500–$4,800
Stop-loss: Below $3,000
Long-Term Outlook (late 2025 to 2026)
The broader cup pattern suggests that once ETH breaks above $4,800 and confirms it as support, a powerful long-term rally could begin. That level coincides with the previous all-time high from 2021, making it a critical breakout zone.
If $4,800 is broken and held: Upside targets are $5,800 and $6,400
If $2,400 fails: The bullish structure breaks down, opening the way for a deeper decline toward $1,800–$1,600
Target (bullish): $5,800–$6,400
Stop-loss: Below $2,400
Summary
Market is at a decision point:
Break above $4,800 → strong bullish continuation to new highs
Drop below $3,200 → deeper correction toward $2,400
Trade ideas

The ETH Problem - 11/11/25The ETH Problem:
Here is where we are overall with ETH. This is the same ETH outlook we've looked at over the last few weeks... The MAIN problem with ETH right now is that we have had no qualified weekly "Demand Zone" since the one created the week of June 16th. Since then, these pushes up to ATH have not had any support to sustain them. It's been like a large Jenga tower stacked high but with a narrow bottom....it can't hold up! We almost HAVE to go to that Weekly Demand Zone....the market basically demands it.
How we got here:
When we hit ATH near $5,000, we had a daily Break of Structure down, which returned to the "source" as expected. But, that got rejected twice and failed to make a new high. Now...80% of the time this is going to take the market to either the Daily Source (3520) or the Weekly Demand Zone (2672). Since then, we've been falling daily and last week, we had a Daily Break of Structure below the previous daily "source" zone. This zone was retested and we had a break above it, but the next daily candle from yesterday failed to hold the zone and rejected, forming an Evening Star pattern.
What's Next:
This current Daily Source Zone identified here is a MUST HOLD to stay bullish - the bottom of this zone is around 3360. We HAVE to continue to close above this zone to hold any bullish support. IF this zone fails again with a daily close below 3360, it just verifies that we are falling to the Weekly Demand Zone.
The lower Weekly Demand zone is what the Market overall is seeking. That's the large zone way down at 2100 -2700. SOOOOO...IF this current daily zone does not hold...we ARE going to at least 2700!
The only Way Up from here:
We can only go up from here IF and ONLY IF we break back above with a Daily Close above 3526, and a retest of that level, with a bullish rejection.

Ethereum: Slipped belowEthereum recently slipped back below support at $3,357 and is currently struggling to reclaim this level. In line with our primary scenario, we expect further downside below this threshold to complete magenta wave within the lower magenta Target Zone ($2,749 – $2,149). From there, a significant corrective rally is likely, targeting the high of magenta wave (B) in the upper magenta Target Zone ($5,805 – $7,326).

$ETH: Correction has ended?BITSTAMP:ETHUSD : certainly possible that the very last leg of correct ended in three waves. ChatGPT kept telling me a C wave should have 5 waves -- let's see.
If C has ended and therefore II has ended and therefore the correction has ended, then we are now in Wave 1 of a lower degree. This wave itself has 3 subwaves. Wave (4) of 3 backtested resistance and is still in progress.
Looks like this Wave 1 can end at the downsloping trendline and Wave 2 correction will ensue.

ETHUSD 1H | Bullish Continuation Setup🟢 Market Structure
Price holding above key support at 3,600
4H sell-side liquidity taken below
Bullish structure intact with higher lows
🔵 Key Support Levels
Immediate Support: 3,600 - 3,610 (current zone)
Primary Support: 3,583 - 3,594 (consolidation base)
Strong Support: 3,549 (momentum defense)
🎯 Entry Zones & Targets
🟡 Primary Entry: 3,605 - 3,615 (current retest)
🟠 Secondary Entry: 3,583 - 3,594 (deeper retest)
🔴 Stop Loss: Below 3,548 (support break)
💰 Take Profit Targets
TP1: 3,637 - 3,650 (immediate resistance)
TP2: 3,700 - 3,720 (momentum extension)
TP3: 3,800 - 3,856 (liquidity zone)
⚡ Trade Management
Scale entries on support retests
Move SL to breakeven at TP1
Partial profits at each target
Bullish continuation expected - buying dips toward support
#ETH #Ethereum #TradingView #Bullish #Crypto

$ETH Before the parabolic expansion.ETH is once again in a similar technical structure to that seen before its parabolic run in 2020.
As was the case then, the falling trend breakout and subsequent retest phase are now complete.
As seen previously, the RSI is still holding above the 50 level, clearly indicating that momentum continues in a positive direction.
The structure is clear in both linear and stick bar charts.
The trend has broken, the retest is happening, and Ethereum is on the verge of a major expansion movement.

ETHUSDMultiple options, same ledge.
I'm thinking short term top is in and ETH to $1000 or less. Good luck.

ETH Losing Range Midpoint? Similarly to Bitcoin, Ethereum finds itself around the midpoint of the high time frame range, only ETH has already lost the level and has rejected when retesting. Such a lack of strength is concerning for the project as well as the broader altcoin market.
So there are a few actionable moves I'm looking out for:
Bullish scenario is we maybe chop for a while around/under the midpoint then with high volume the midpoint gets flipped with conviction. That would open the door for the top half of the range to be accessible again. I think this scenario relies on the US Government shutdown coming to an end and QT also ending. Right now there just isn't the liquidity needed to prop up prices hence the slow bleed.
Bearish scenario is a simple continuation of the local bearish trend where 0.25 ($2,800) is the target. This area signaled the break in structure responsible for the previous rally and so I believe it will provide support but is also the target for the bears to reach.
ETHUSDAs shown by my other posts, I've been anticipating a second black swan event, similar to 2020. I believe this will be the final one of its kind for our generation...
I will not be shorting anything other than Ethereum. I think everyone that has a crypto as an investment, has ETH. Nobody knows why they have ETH, other than that it's good. I'm not saying ETH isn't good, it is, but almost nobody hold ETH actually knows why, other than they've heard that it's good.
For this reason, I believe when the selling begins, Ethereum will be one of the hardest hit assets, but have the most smooth selloff (minimal wicks). I have concentrated my efforts here, for a continuous trigger-short strategy.

Eth/Usd - Rejection Setup Targeting $3,250Ethereum is currently trading around the $3,435 zone, testing a strong resistance area between $3,450–$3,500. Price has previously rejected this zone multiple times, forming a clear double-top pattern.
The support zone sits near $3,220–$3,260, where buyers have stepped in several times before. Unless ETH breaks above resistance with strong volume, a pullback toward the support zone remains likely.
Bias: Bearish below $3,450
Target: $3,250
Invalidation: Break and close above $3,500

#ETHUSD can see one more leg lower?BINANCE:ETHUSD We believe ETHUSD can see one more push lower to complete pending move in #BTCUSD, it looks risky as crypto on high bullish trend. Can play small quantity and see if it could turn out. Or Safe traders can accumulate ETHUSD if it makes one more push lower.

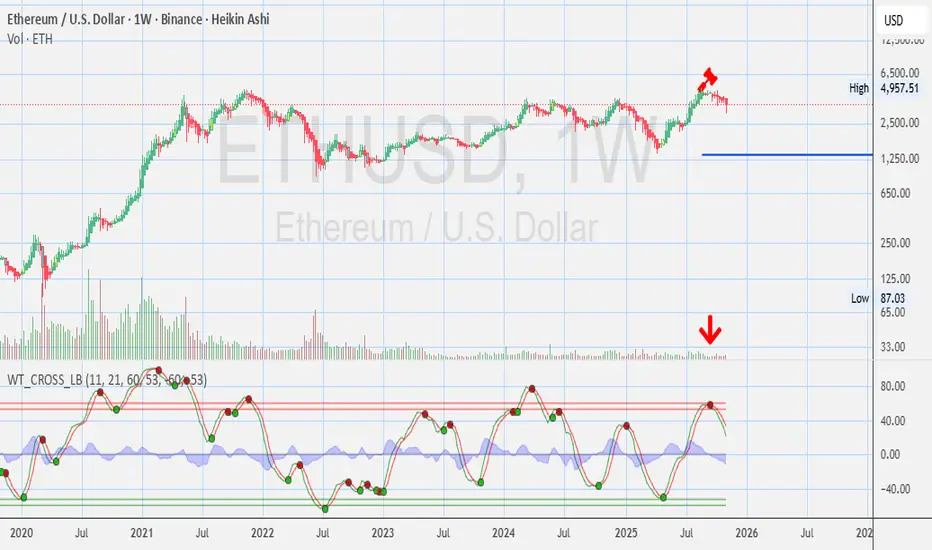
ETH - Ethereum Weekly Chart - Opinions? Disclosures :
This analysis is for informational purposes only and is not financial advice. It does not constitute a recommendation to buy, sell, or trade any securities, cryptocurrencies, or stocks. Trading involves significant risk, and you should consult with a qualified financial advisor before making any investment decisions. Past performance is not indicative of future results. Always DYOR
$ETHUSD: Bearish Wave C in progressBITSTAMP:ETHUSD has been in an ABC correction. B has retraced 78.6% of A. C has reached 1.786% of B, or 1.5% of A. If prices don't break above $3510 soon, then it's increasing likely that it's a 5-wave impulse: we have completed 1, 2, i, ii, iii of 3, and we're in iv of 3. v of 3 will revisit the low and mostly likely go beyond. After wave 4, there will be wave 5, taking us down all the way to below $2800.
This is very bearish short term. If prices can break above 3510, we would end up having an ending diagonal, which would mean 3 has completed and we're in wave 4. Then Wave 5 may revisit the low but may be truncated.
So far, the less bearish scenario (ending diagonal) is less likely.

ETHUSD📉 Double Top – Strong Sell Opportunity
Pattern Overview
A Double Top is a bearish reversal chart pattern that typically forms after an extended uptrend. It signals that the buying pressure is weakening and that sellers are preparing to take control. This setup consists of two distinct peaks (tops) at approximately the same price level, separated by a moderate trough (the neckline).
When the price breaks below the neckline after forming the second top, it confirms the pattern completion and presents a strong sell opportunity.
Pattern Structure
First Top:
Forms after a prolonged bullish trend.
Marks the first significant resistance where price fails to advance further.
Volume typically starts to decline as buying pressure weakens.
Pullback / Neckline Formation:
Price retraces from the first top to find temporary support — this level forms the neckline.
The neckline acts as a critical level for confirmation.
Second Top:
Price rises again but struggles to break above the first top.
Often accompanied by lower volume, indicating reduced buyer interest.
A potential bearish divergence may appear on oscillators (like RSI or MACD).
Breakdown / Confirmation:
The sell signal is confirmed when the price breaks below the neckline with strong bearish momentum and increased volume.
This breakdown signals a trend reversal from bullish to bearish.
Trading Strategy
Entry (Sell Setup)
Entry Point: Enter a short position when the price closes below the neckline with strong bearish confirmation (candle body close below support).
Aggressive traders may enter slightly before the break if other indicators (divergence, bearish candlesticks) support the setup.
Stop Loss Placement
Place the stop loss just above the second top (or slightly above recent resistance).
This protects against false breakouts or pattern invalidation.
Take Profit Targets
Target 1: Equal to the height of the pattern (distance between the tops and neckline), projected downward from the neckline.
Target 2: Use support zones or Fibonacci levels as secondary targets for extended moves.
Risk–Reward Ratio
The ideal setup should offer at least 1:2 or better risk-to-reward ratio.
Wait for volume confirmation to avoid premature entries.
Technical Indicators Confirmation
Volume: Decreasing on second top, increasing on breakdown.
RSI: Bearish divergence (lower high on RSI while price makes equal highs).
MACD: Bearish crossover or divergence supports the sell bias.
Moving Averages: Price crossing below key moving averages (e.g., 20- or 50-period) adds confirmation.
Example Market Context
Suppose EUR/USD has been trending upward and forms two peaks near 1.1200 with a neckline near 1.1100.
After failing twice to break above 1.1200, price drops below 1.1100 with high volume — this confirms the Double Top.
Sell Entry: 1.1085
Stop Loss: 1.1215
Take Profit: 1.0965 (pattern height = 120 pips)
Key Takeaways
The Double Top pattern marks a transition from bullish to bearish momentum.
Wait for neckline confirmation to avoid false signals.
Combine pattern analysis with volume, oscillators, and market context for stronger confirmation.
Discipline in execution (entry, stop, and target) ensures effective risk management.

Mad bullsPotential wave 3 move
From the characteristics of wave theory wave 3 are always swift and strong
Let's watch and try not to miss out if this is a wave 3 move

ETHEREUM FREE SIGNAL|SHORT|
✅ETHUSD is reacting from a premium supply level after internal liquidity sweep and mitigation of an old imbalance. Expect bearish delivery toward the sell-side liquidity below.
—————————
Entry: 3,457.5$
Stop Loss: 3,502$
Take Profit: 3,400$
Time Frame: 2H
—————————
SHORT🔥
✅Like and subscribe to never miss a new idea!✅

Heading into key resistance?The Ethereum (ETH/USD) is rising towards the pivot which is a pullback resistance and could reverse to the 1st support.
Pivot: 3,691.29
1st Support: 2,954.96
1st Resistance: 3,919.62
Disclaimer:
The above opinions given constitute general market commentary, and do not constitute the opinion or advice of IC Markets or any form of personal or investment advice.
Any opinions, news, research, analyses, prices, other information, or links to third-party sites contained on this website are provided on an "as-is" basis, are intended only to be informative, is not an advice nor a recommendation, nor research, or a record of our trading prices, or an offer of, or solicitation for a transaction in any financial instrument and thus should not be treated as such. The information provided does not involve any specific investment objectives, financial situation and needs of any specific person who may receive it. Please be aware, that past performance is not a reliable indicator of future performance and/or results. Past Performance or Forward-looking scenarios based upon the reasonable beliefs of the third-party provider are not a guarantee of future performance. Actual results may differ materially from those anticipated in forward-looking or past performance statements. IC Markets makes no representation or warranty and assumes no liability as to the accuracy or completeness of the information provided, nor any loss arising from any investment based on a recommendation, forecast or any information supplied by any third-party.

ETHT.A explained -
BackSide (BS)
FrontSide (FS)
Inverse BS (Inv.BS)
Inverse FS (Inv.FS)
BS & FS levels are expected support when dashed lines, tested when dotted and resistance when solid lines.
The inverse is true for the Inv. BS Inv. FS levels, they are resistance as dashed lines, tested as dotted and support as solid lines.
Monthly timeframe is color pink
weekly grey
daily is red
4hr is orange
1hr is yellow
15min is blue
5min is green if they are shown.
strength favors the higher timeframe.
2x dotted levels are origin levels where trends have or will originate. When trends break, price will target the origin of the trend. its math, when the trend breaks, the vertex breaks too so the higher timeframe level/trend that breaks, the more volatility there could be as strength in the orders flow in to fuel the move.

Ethereum (ETH/USD)Asset: Ethereum (ETH/USD) on Bitstamp.
Timeframe: 1D (daily).
Current Price: $3,336 (down 2.58%).
Ascending channel marked in blue, with dynamic support in the red zone and a white line as additional support.
Key Fibonacci level: 0.641 around $1,519.
RSI indicator with divergences and marked “Bull” and “Bear” signals.
Technical Analysis
Main Trend
The price has remained within a broad ascending channel since mid-2022. Despite the recent correction, it continues to respect the structure.
Support and Resistance Levels
Strong Support: $3,200 (near the lower edge of the blue channel).
Critical Support: $1,519 (0.641 Fibonacci level, historical zone).
Resistance: $4,000 (recent highs within the channel). RSI
Currently in the middle zone (not overbought), indicating room for a rebound if the bullish structure holds.
Bullish Forecast
Optimistic Scenario:
If the price respects the channel support ($3,200) and rebounds, it could retest the upper channel line at $4,200-$4,500 around Q1 2026.
Conservative Scenario:
Consolidation between $3,000 and $3,800 over the next few weeks before resuming the upward trend.
Invalidation Scenario:
If it breaks the white line and the red channel, it could fall to $2,500 or even $1,500 (Fibonacci retracement).


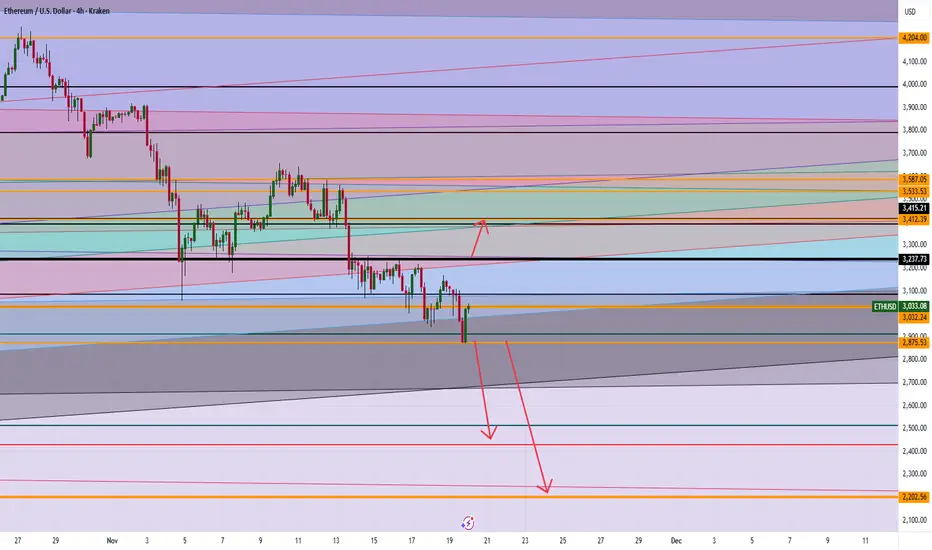
ETH Breakout Levels: Is $3,600 Next or Will Ethereum Crash to $2If ETH holds above 3237, clear momentum targets the 3400 range, with further upside potential toward 3500–3600 if buyers keep control.
A sustained break below 2875 opens the path to 2500, and possibly deeper toward 2200 on heavy selling pressure.
Any questions send me a DM
ETH BUY?Market Overview:
The overall trend remains bullish on both the daily and weekly timeframes.
Daily Outlook:
On the Daily timeframe, the market appears to be forming a potential reversal pattern, indicating a possible continuation of the broader bullish move. Should the current support level hold, we could see buyers gaining momentum and pushing prices higher.
Disclaimer:
Please be advised that the information presented on TradingView is solely intended for educational and informational purposes only.The analysis provided is based on my own view of the market. Please be reminded that you are solely responsible for the trading decisions on your account.
High-Risk Warning
Trading in foreign exchange on margin entails high risk and is not suitable for all investors. Past performance does not guarantee future results. In this case, the high degree of leverage can act both against you and in your favor

#ETH ONE BIF BEAUTIFUL WAVE (2)#ETH wave 2 in the making?
make #eth great again and spring it up to 12K
COINBASE:ETHUSD
