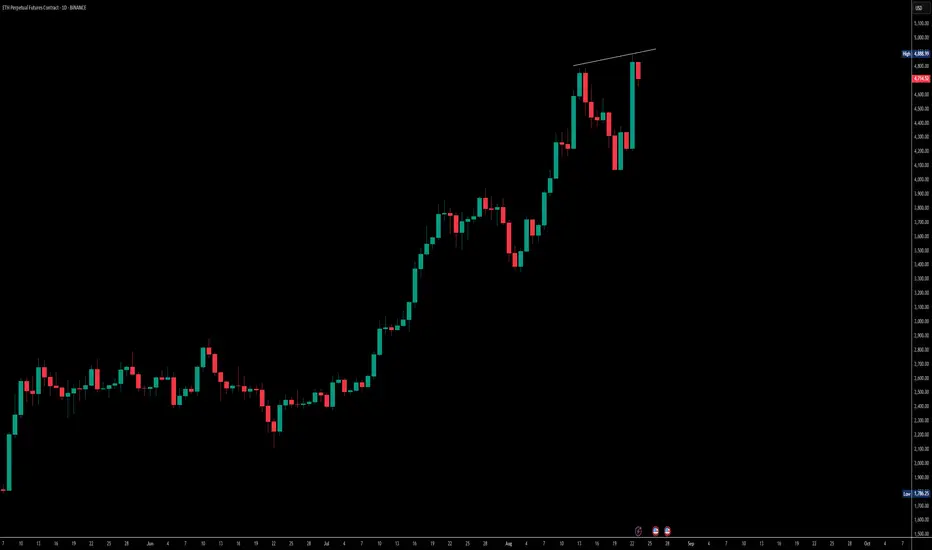
$Eth daily chart shows higher highs but RSI hints at pullbackLooking at ETH on the daily timeframe, price action is pushing higher highs, but RSI isn’t fully aligned — it’s only forming a higher low. That usually tells us this move could just be a pullback rather than a strong bullish divergence.
ETH already retested the May 2021 levels, and from here a correction toward $4,450 seems likely. If it holds and rebounds there, momentum can continue, but if it fails, we should be ready for deeper downside. The key support to watch is $4,000 — losing that would open doors for another correction.
On the other side, the stochastic RSI is near the bottom, which suggests a possible bounce. But weekends often come with fake pumps and dumps, so patience is important. Monday evening or Tuesday morning looks like a better window to see whether ETH attempts a proper correction or not.
ETHUSD trade ideas
Ethereum holds support and looks for a reboundEthereum Analysis
Despite a rapid short-term decline, the price has retraced to key support levels between 4260 and 4280 and is showing signs of stabilization, indicating a solid upward trend.
This pullback is a benign market correction. From a technical perspective, the support level is strong. If this support level holds, a rebound is expected.
I recommend establishing a long position in the 4260-4280 range and anticipating a market rally, with a target around 4330-4350.

Breakout, Backtest in session.ETH needs to show strength because we all know it ALTCOIN SEASON!!!!!!
PUMP the markets, then a backtest to kick off ALTSEASON!!!
Short the pump, BUY THE DIP!!
GOOD LUCK ALL!
ETH cuts through the 4488 Minor Genesis Fib - Retest of highs?Good morning bulls! The larger macro (blue) bull channel held. I was expecting a bit more pressure but my longs are happy. 4488 minor genesis fib was cut through like butter, and there's now a shot at retesting the semi-major genesis fib (4737) & golden major fib (4790) at local highs. Lots of work to do, and NY futures will likely help with direction at 6pm (EDT)

ETH up and downETH trade idea.. Up and down. Just chance.
Market might do this, might not. We'll have to see. But this is what I expect. Peace.

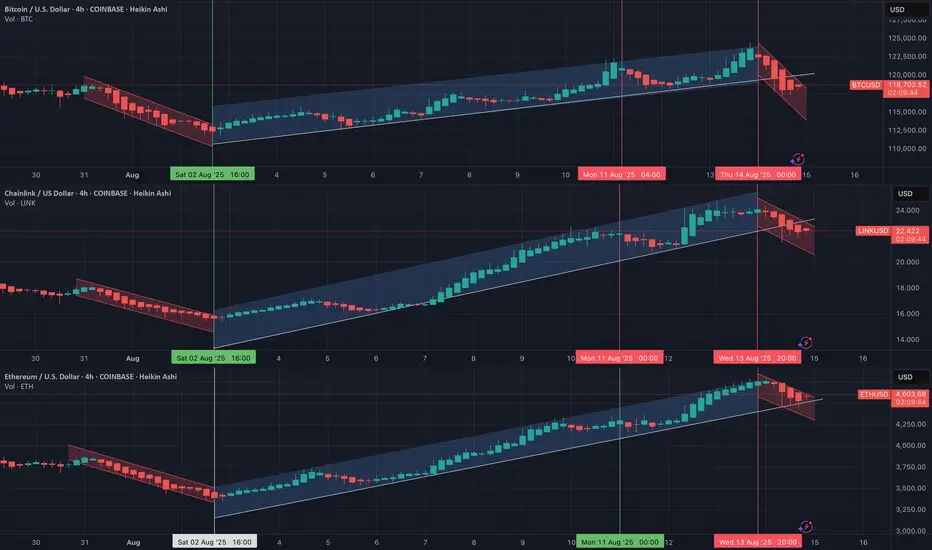
Do you ever wonder why most cryptos are doing the same thing?I've been a student of Bitcoin full time for 5 years. Once you learn Btc you know where the rest of the market is going.
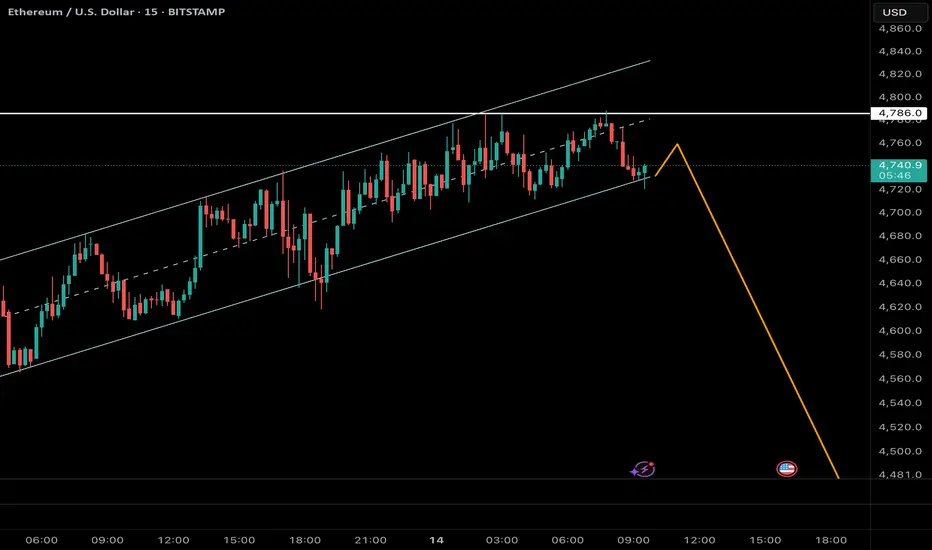
Ethereum on the Edge – The Breakdown Could Start Any Moment!Following yesterday’s analysis, where we identified Ethereum in the final stages of wave 5 of 5 at the upper boundary of its ascending channel, the 15-minute chart now reveals a contracting Neutral Triangle structure. This pattern typically forms as the final subdivision of wave 5, often preceding a sharp and decisive reversal.
Currently, price is testing the upper boundary of the B–D trendline. A confirmed breakdown from the E-wave low (≈ $4,590) would mark the completion of the triangle and signal the start of the anticipated decline.
Key Observations:
• Pattern: Neutral Triangle inside wave 5 of 5 (final stage of advance)
• Reversal Trigger: Break below E-wave low (~$4,590) on strong volume

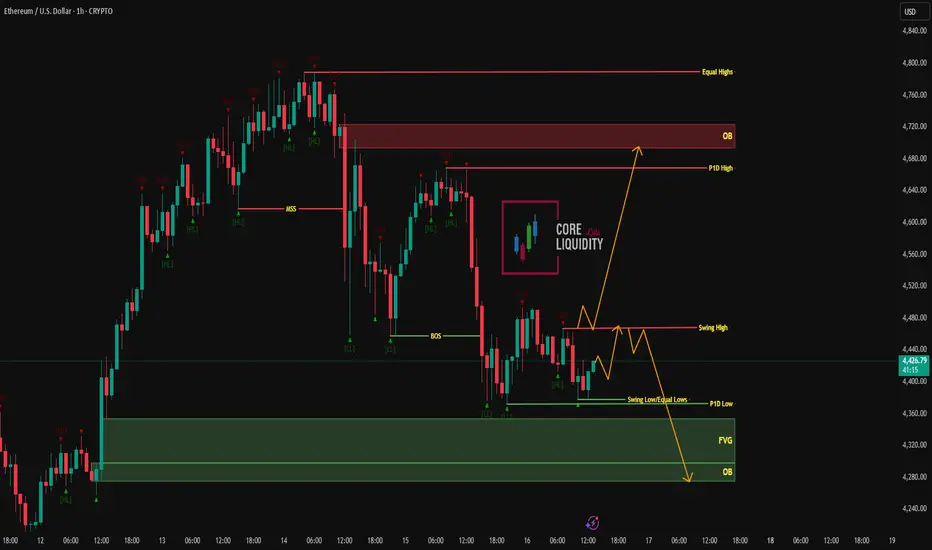
ETH/USD – 1H OB Reaction | Key Decision Zone AheadEthereum is consolidating between equal lows and the recent swing high, building pressure for the next big move. The reaction from this zone will guide whether we see a bullish breakout or a bearish continuation.
Bullish Scenario:
Hold above P1D Low (~4,360)
Break swing high (~4,480) → Push into OB (~4,720)
Target liquidity at Equal Highs (~4,800)
Bearish Scenario:
Fail to reclaim swing high (~4,480)
Break equal lows/P1D Low (~4,360) → Drop into FVG & OB (~4,280–4,300)
Deeper continuation possible if sellers hold momentum
Key Levels:
🟢 P1D Low / Equal Lows: 4,360
🔴 Swing High: 4,480
🟢 OB Target: 4,720
🔴 Equal Highs: 4,800
💬 Will ETH bounce into the OB or break down to the FVG? Share your view below.
ETH 4H – Watching Demand Zone, Bounce Projection in PlayEthereum is approaching a critical demand zone around 4,093 (Fib 0.5 + trendline confluence). The ghost candles illustrate a possible bounce scenario if buyers defend this level.
Support levels: 4,093 (Fib 0.5), 3,924 (Fib 0.618), 3,683 (Fib 0.786)
Resistance: 4,500–4,700 zone
Stoch RSI: Cooling, suggesting short-term caution before a decisive move
If bulls step in here, ETH could reclaim 4,500+ toward 4,700. A breakdown, however, would expose 3,924 and possibly 3,683.

ETHUSD big bada bing is going to the endI was expecting ending diagonal in my latest post, but that never worked out. It's clear impulse wave, and unfortunately it's last in the current bigger wave. There are some rules applying which we can highlight the target zone of the last impulse, it's on the chart. I believe there will be strong resistance at +-5k. It's not the end for ETH though, there must be some flat or triangle much longer in time after which the ascending move will continue. Good luck!

#ETH/USDT Long after pull-back #ETH
The price is moving within a descending channel on the 1-hour frame and is expected to break and continue upward.
We have a trend to stabilize above the 100 moving average once again.
We have a downtrend on the RSI indicator that supports the upward move with a breakout.
We have a support area at the lower limit of the channel at 4465, acting as strong support from which the price can rebound.
We have a major support area in green that pushed the price upward at 4400.
Entry price: 4530.
First target: 4666.
Second target: 4797.
Third target: 4992.
To manage risk, don't forget stop loss and capital management.
When you reach the first target, save some profits and then change your stop order to an entry order.
For inquiries, please comment.
Thank you.

ETH Path to 5k playing out nicely!Played out nicely since last update.
Ethereum has held near the level highlighted in the last update and, after a correction, pushed into the wave 3 most likely target. Price rejected from that area without yet breaking the all-time high.
If this wave 3 has completed, which isn’t confirmed yet, the Elliott Wave count suggests caution. A wave 4 at the higher degree could be next. To gain clarity, we’ll need to see a few key pivots broken.
The completion of a smaller 5-wave move lining up with the higher-degree wave 3 target is a clue this may be the spot to pause and evaluate. The way this retracement unfolds will help decide which degree it belongs to and set expectations for what comes next.

ETH/USD 1H TIME FRAME OVERVIEWSmart ICT Follow-Up and Smart Money Concept
Ethereum is currently trading between 4460 – 4480, at a critical decision zone.
🔑 Key Points / Signals:
✅ Bullish case: If ETH holds above 4460–4480, price may push towards 4650 first, and if momentum sustains, a retest of 4790 phase is possible.
🔻 Bearish case: If rejection occurs at this range, ETH could decline towards 4300, with an extended move down to 4160 support.
📌 Traders should monitor this consolidation zone closely as it will decide the next swing move.
⚡ Price is currently coiling in a make-or-break range, awaiting confirmation for the next impulsive leg.
Disclaimer: This analysis is for educational purposes only and does not represent financial advice.

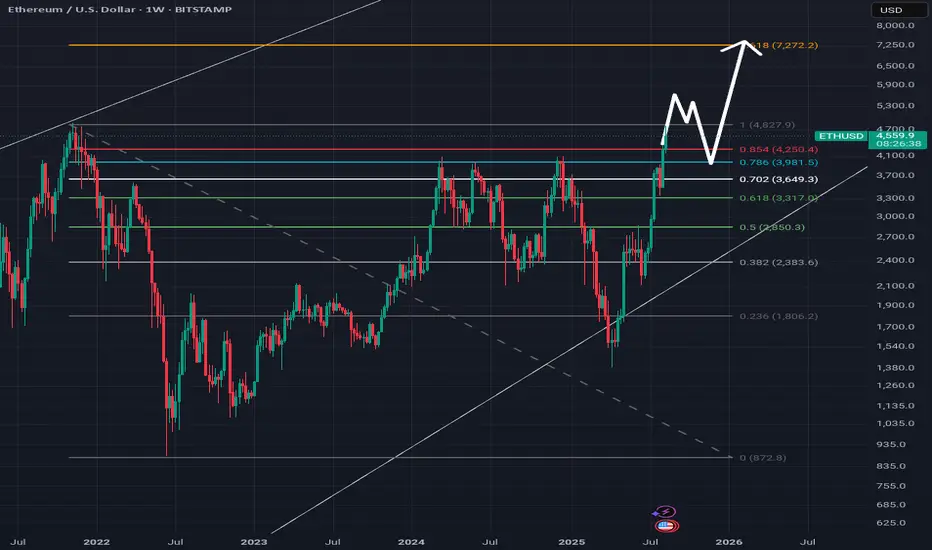
$Eth Ethereum nearing critical resistance....All Time High soon!This is a weekly candlestick chart of ETHUSD
Current price: 3800
CRYPTOCAP:ETH Ethereum recently broke out of a long-term downtrend, indicated by the red diagonal trendline. Price action has shifted from bearish to bullish. This is also a show of strong Momentum as recent candles are large and green, showing aggressive buying (strong bullish pressure).
If #eth continues in this uptrend then here are the resistance above to watch: 4000, 4800 and possibly new all time highs at 5600, 6400
Note worthy to know that the areas between 3800-4000 is very critical resistance.
Assuming a retracement from this resistance, Ethereum remain bullish above 2900
Invalidation of this idea is under 2900


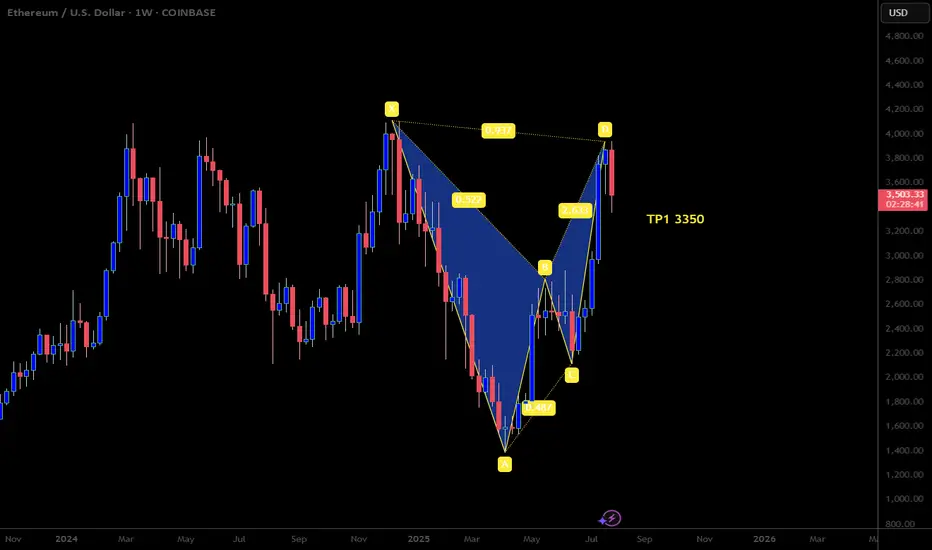
Bearish Bat Pattern on ETHUSDLooking to continue selling here with this beautiful harmonic bat pattern that just formed. We also got a bearish candle close on the weekly timeframe which gives us solid sells confirmation. Happy Trading
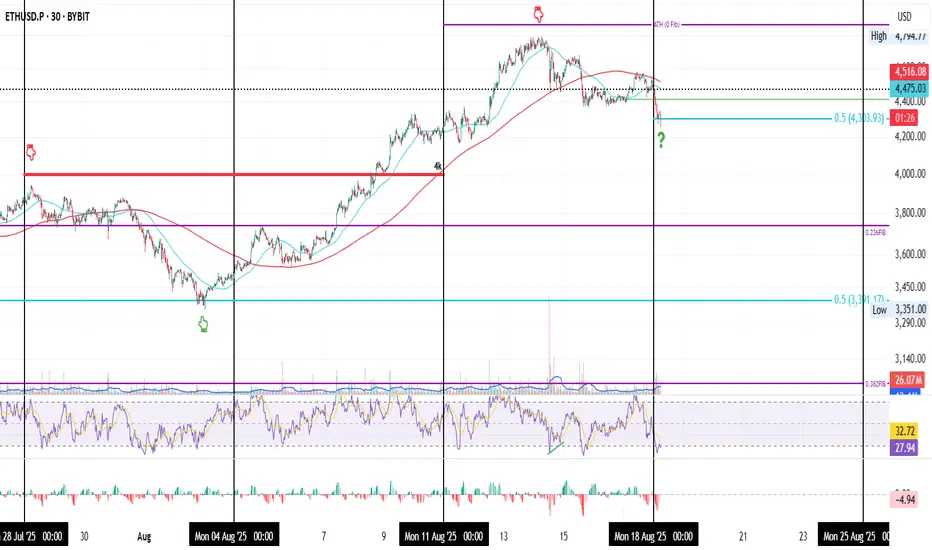
ETH’s Predator Move on the 30min time rame
This is ETH on the 30min timeframe over the past 3 weeks.
It started on Monday, July 28, when price was rejected at the $4K resistance after a Sunday night pump. What followed was nearly half a week of chop, then a drop that found support at the 0.5 Fib = $3391 (the midpoint between the 0.382 and 0.236 levels). From there, ETH rallied +43% to its ATH.
Last week, the same scenario repeated: price rejected from ATH (0 Fib), chopped half a week, then fell Sunday night, this time finding support at the 0.5 Fib = $4303 (the midpoint between the 0.236 and 0 levels).
Now the question is: will this 10% drop be enough to reload for another attempt at ATH, or will price need to retrace deeper to gather the liquidity needed?
One thing is certain: this is a leverage flush. If you’re riding high leverage, understand that you are the prey, and price is the predator. To survive, you need to shed some leverage weight before it catches you.
Always take profits and manage risk.
Interaction is welcome.
#ETH FIRST TP = 20,000 $ (OMG)Strong fundamentals, billion-dollar purchases, unprecedented volume, and a perfectly valid pattern with confirmations that promise to reach $20,000 on the weekly timeframe.

Ethereum Parabolic Season Coded! The major down trend breakout in Ethereum, which also occurred in terms of RSI, will trigger a transition to a major upward phase.
Major trend breakout in CRYPTOCAP:ETH after 1570 days!

ETHUSD Bounce Zone: Watch $4,400 Demand for a Quick Long MoveThis chart on the 1-hour timeframe, there’s a highlighted fair value gap and an order block demand zone around $4,420-$4,400, which could act as support if the price pulls back.
If ETH retraces into these zones, watch for bullish price action such as strong candles or higher lows forming, indicating potential buyers stepping in. However, if price breaks below the protected low near $4,360, this would confirm continued bearish momentum, so selling (short) could be considered for further downside targets.
Always manage risk by placing stop-losses below the protected low or support area to limit downside if the chart breaks bearish. In summary, wait for ETH to retest the fair value or order block zones, then consider entering a long position if bullish reversal signs appear. —just follow the zones and watch how price reacts, trade what you see, and keep your risk under control.

is this wave count correcttrying to figure out elliot wave. If you all could give me any feedback if this count is correct and how to find a wave. This was drawn after wave 5 was extended.
Thank You

Ethereum (ETH/USD) – Elliott Wave AnalysisThe current price structure suggests that Ethereum is completing the final stages of a 5-wave impulsive advance, with the market now positioned in wave 5 of 5. Price action has reached the upper boundary of the ascending channel, coinciding with a key Fibonacci projection zone (green resistance area), which aligns with typical wave 5 termination points.
Given this confluence, the probability of a medium-to-long-term top forming here is elevated. Once wave 5 completes, a corrective phase is expected, potentially retracing towards the midline or lower boundary of the channel. The projected path (blue arrows) anticipates a significant decline, consistent with the completion of a full impulsive cycle.
Key Points:
• Structure: Impulse wave (5 of 5) nearing completion
• Confluence: Channel resistance + Fibonacci projection zone
• Outlook: High probability of reversal and corrective decline
• Targets: First support near $3,650, with deeper retracements possible toward $3,000–$2,800 if bearish momentum accelerates
This suggests caution for late long entries, as risk/reward now favors a corrective move.
