ARKK: The Calm Before the Innovation Storm -ALTSEASON Is COMING🚀 ARKK: The Calm Before the Innovation Storm 🌪️
The markets are shifting, and disruption is about to go vertical. ARK Innovation ETF (ARKK) is quietly positioning itself for what could be the most explosive move of this decade. With high-conviction bets in AI, Bitcoin, genomics, and next-gen tech, this isn’t just a fund—it’s a launchpad for exponential growth.
This post breaks down exactly why ARKK could go parabolic—and why the smart money is already moving in. 👇
Explosive upside in 2026
ARKK is already up over 24% YTD , showing strong momentum compared to broader markets and signaling early stages of a potential parabolic move .
High-conviction concentration in game-changers
Top 10 holdings include Tesla, Roku, Zoom, Coinbase, UiPath, Block, Crispr Therapeutics, DraftKings, Shopify, and Exact Sciences. These are leaders in innovation sectors with massive upside potential .
Deep exposure to Bitcoin and digital assets
Heavy allocation to Coinbase and Block gives indirect exposure to Bitcoin . If BTC breaks into a new cycle high , ARKK stands to benefit significantly.
Positioned in exponential growth sectors
Focus on AI, genomics, EVs, fintech, robotics, and blockchain , all of which are entering accelerating adoption phases globally.
Aggressive smart-money accumulation
Cathie Wood’s team continues buying aggressively during dips, reinforcing institutional confidence in the fund’s long-term trajectory.
Technical breakout structures forming
Ascending triangle and multi-month consolidation breakouts suggest a technical setup primed for explosive upside .
Innovation supercycle aligning
ARKK's themes are aligned with major global shifts like de-dollarization, decentralized finance, and AI convergence .
High beta = massive upside leverage
With a beta above 2 , ARKK tends to outperform in bull runs , offering leveraged exposure to innovation without the need for margin.
Resurgence of top holdings
Names like Coinbase, Tesla, Shopify, and Roku are up 50%–100% YTD , driving ARKK’s NAV growth and fueling bullish sentiment .
Long-term vision with short-term catalysts
The fund projects 5x returns over the next five years , while Bitcoin halving cycles, tech innovation, and regulatory clarity serve as short-term ignition points .
Marty Boots | 17-Year Trader — smash that 👍👍, hit LIKE & SUBSCRIBE, and share your views in the comments below so we can make better trades & grow together!
ETHUSD trade ideas

ETHUSD - CURRENT OUTLOOK ON ETHEREUMI am currently expecting the dollar to slowly regain strength, and while this is happen, I expect institutions/large funds to begin profit taking from these price ranges.
"May fortune attend thee, and thy trade prosper." .......L2Earned

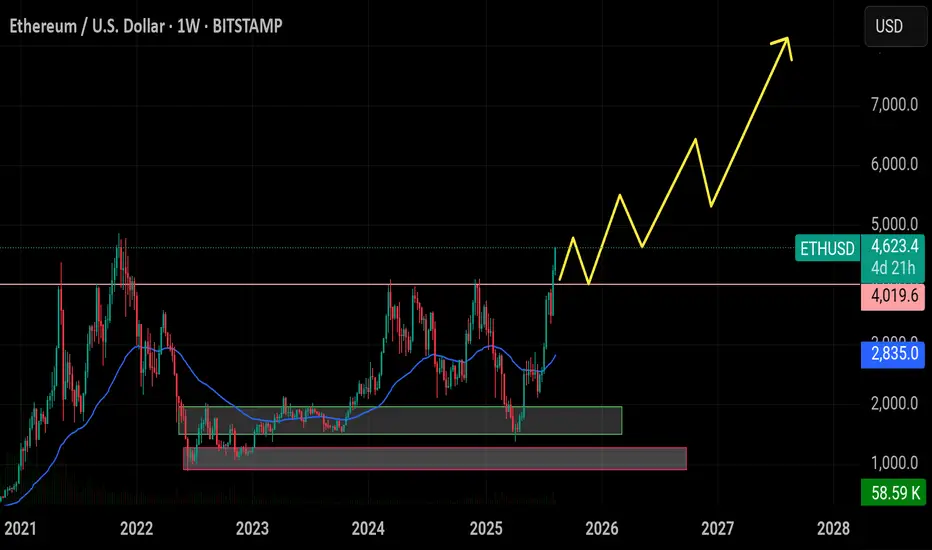
$ETH has broken above the $4,000 resistance, CRYPTOCAP:ETH has broken above the $4,000 resistance, with short-term targets at $4,800–$5,000, and a potential retest zone around $4,050 for continuation.
ETH BUYETH has being moving upwards, had a retest and its currently forming a structure that it similar to a W formation on the support level.
A BUY would be ideal after the closing of the current candle and at the price level of 4435.65 and your take profit at 5025.52.
If the current candle doesnt close bullish then you leave it and wait for another opportunity.

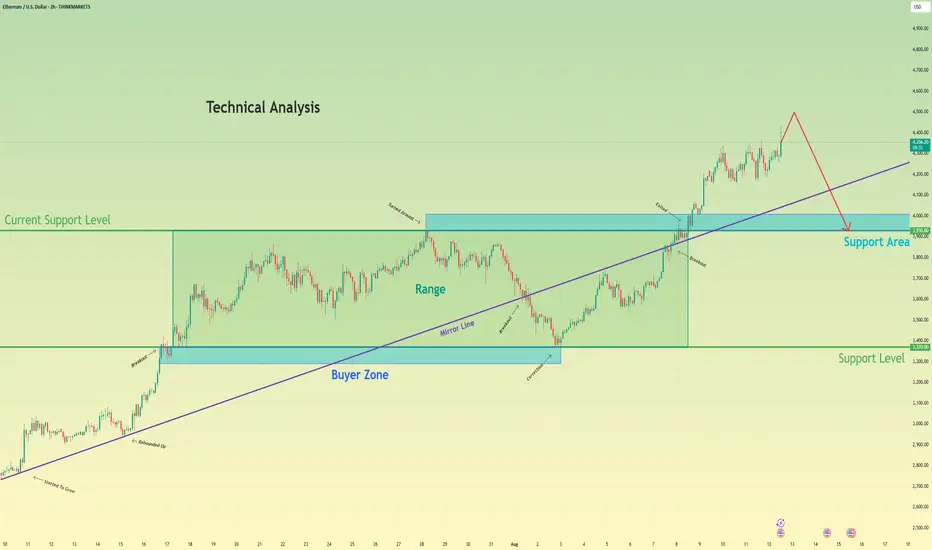
Ethereum will rise a little and then drop to support levelHello traders, I want share with you my opinion about Ethereum. Following a sustained upward trend, Ethereum entered a prolonged consolidation phase, forming a wide range between the buyer zone near 3370 and local resistance. Throughout this period, a key ascending mirror line provided consistent support, underpinning the bullish market structure and allowing for accumulation before the next major move. Recently, a decisive breakout from the top of this range occurred, propelling the asset to a new local extremum and confirming the strength of the buyers. However, the price action following this breakout has shown signs of potential exhaustion, with momentum appearing to wane at these elevated levels. The primary working hypothesis is a short, corrective scenario, which anticipates that after a potential final push to a new high, the price will undergo a sharp reversal. A key component of this thesis is the expected break of the main ascending mirror line, an event that would signal a significant shift in short-term market dynamics and confirm that sellers are taking control. Therefore, the tp for this anticipated downward move is logically placed at the 3930 level. Please share this idea with your friends and click Boost 🚀
Disclaimer: As part of ThinkMarkets’ Influencer Program, I am sponsored to share and publish their charts in my analysis.
ETH Long after pull-backEthereum (ETH) price action in August 2025 shows a recent price around $4,567, with a decline of about 3.87% on the day. The price has ranged between roughly $4,450 and $4,790, close to its yearly high for the current year. Market activity suggests volatility with occasional pullbacks and consolidations near key levels around $4,600 to $4,800. Technical outlook indicates bullish momentum is somewhat challenged by periods of consolidation and minor corrections, with resistance levels near $4,800-$5,000 and support around $4,500 and below.

Ethereum Wave Analysis – 15 August 2025
- Ethereum reversed from the long-term resistance level 4755.00
- Likely to fall to support level 4115.00
Ethereum cryptocurrency recently reversed from the major long-term resistance level 4755.00 (which stopped the earlier sharp weekly uptrend at the end of 2021).
The downward reversal from the resistance level 4755.00 stopped the previous sharp weekly upward impulse sequence 1 from the start of this year.
Given the strength of the resistance level 4755.00 and the still overbought weekly Stochastic, Ethereum cryptocurrency can be expected to fall to the next support level 4115.00 (former yearly top from 2024).

ETH/USD – 15M Market OutlookPrice is currently sitting near the OB at the Strong Low / Equal Low zone around 4,650 after a rejection from the Rejection Block just below the Swing High.
Possible Scenarios:
1️⃣ Bullish Reaction:
Hold above OB → push toward Swing High at 4,700 and potentially break higher.
2️⃣ Bearish Break:
Break below OB → drop toward Equal Low at 4,400, with extended targets at the P1D Low / Rejection Block near 4,200.
Key Levels:
Resistance: Rejection Block (4,690–4,700)
Support: OB at 4,650, Equal Low (4,400), P1D Low (4,200)
📌 Plan: Watch OB reaction closely — it’s the key decision area for the next move.

ETH 1H – Supply Test Before DropPrice is approaching the 1H Order Block (OB) after a clean BOS & MSS. Expecting a liquidity grab into the supply zone before a potential reversal targeting the P1D Low / swing low area.
Key Zones:
🔴 Supply OB: 4755–4760
🟢 Demand: 4300 zone
Trade Idea:
Wait for confirmation inside OB → Short entry → Target swing low
Strict risk management & patience required.

eth longbottom of that wick seems quite strong, deals still on going, we just had PPI bad news for crypto and stocks, but we still on uptrend, this is first real retest on eth. think got chance.
if pumps up then fails ot go up, just close it. or sl BE

ETHUSD Faces Resistance – Potential Pullback AheadEthereum has reached a major resistance zone near the 4,950–5,000 area after a strong rally from the May breakout. Price is currently showing signs of rejection around this level, forming a weak high. A correction could target the first demand zone near 3,500, and if selling pressure increases, the next key support lies around 2,500, aligning with the strong low.
Key levels to watch:
Resistance: 4,950–5,000
Support Zones: 3,500 and 2,500
Trend: Upward momentum remains intact unless price breaks below the 3,500 demand zone.
This analysis is for educational purposes only and not financial advice

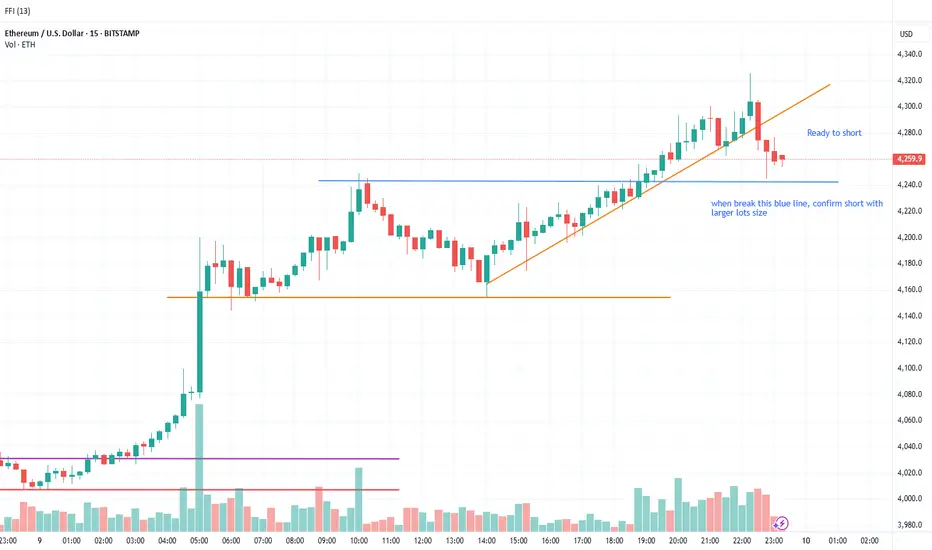
Shorting Ethereum using 15min TFConfirmation for Ethereum Short on 15min TF. This is my first publish to share my analysis of the Ethereum price action on 15min TF and how i use confluence confirmation to nail the short
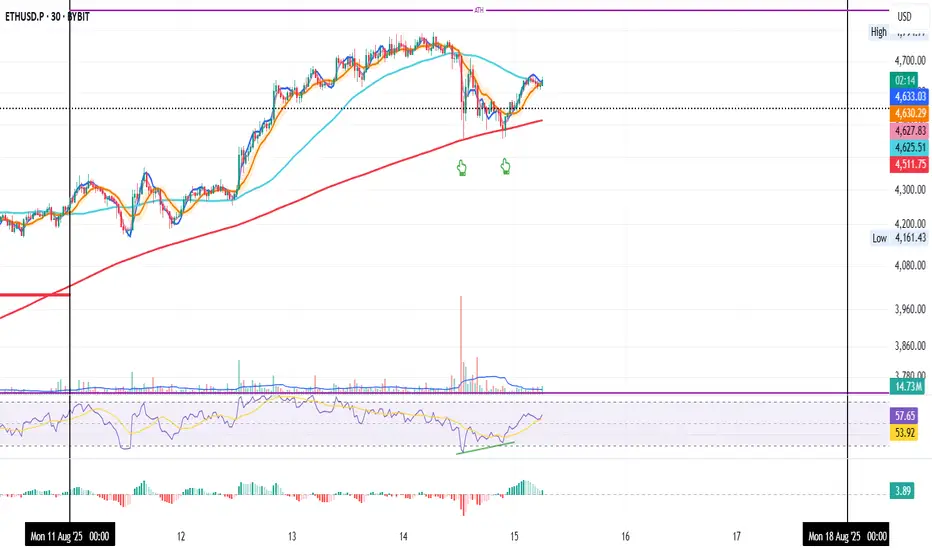
ETH 30min: Double Bottom Setting Up Another ATH Test
ETH on the 30-Min
Yesterday, ETH printed a clean double bottom right on the 200MA.
RSI showed bullish divergence at the same time, a strong reversal signal.
Now, price is holding support at the BB center and 50MA.
If these two levels hold, we could see another push toward the ATH.
Always take profits and manage risk.
Interaction is welcome.
ETH heads up at $4488 then $4737: Minor + SemiMajor Genesis fibsShown here is a single fib series in 3 different time-frames.
The "Genesis Sequence" (from birth) has the highest gravity fibs.
Each strand can reflect the wave or capture into orbit.
$4488.38 is a "minor" fib ratio in this series.
$4737.93 is a "semi-major" ratio, stronger.
"IF" there is to be a top anywhere near here,
then one of THESE barriers are perfect options.
Expecting a couple orbits around minor,
then sling-shot to semi-major for "a" top?

ETHEREUM (ETHUSD): Road to ATH
Breakout of a key weekly resistance cluster on Ethereum clearly
indicates a dominance of the buyers.
I do believe that the market will reach the All-Time High soon.
Get ready for a growth to 4700 after a pullback.
❤️Please, support my work with like, thank you!❤️

ETH USD - is it time to go short?
Is it time to go short on the eth usd?
i see that a movement from june 2019 might be being repeated in real time.
Let us wait for two weeks to decide.

ETHUSD : Blow-offIn accordance with the harmonic pattern, the price is at the tip of the blow-off stage now.
By the pattern, it is UNLIKELY to surpass the previous ATH.
Wait for a reaction on a 1W chart, trade once the price weakens.
GOOD LUCK.

ETHUSD: Bulls Are Winning! Long!
My dear friends,
Today we will analyse ETHUSD together☺️
The price is near a wide key level
and the pair is approaching a significant decision level of 4,541.3 Therefore, a strong bullish reaction here could determine the next move up.We will watch for a confirmation candle, and then target the next key level of 4,602.2.Recommend Stop-loss is beyond the current level.
❤️Sending you lots of Love and Hugs❤️

$4,794 Barrier in Sight: ETH’s Next Stop $5,200?ETH has been in a strong upward channel since August 6, with the price consistently respecting the rising trendline. The structure remains firmly bullish, showing a series of higher highs and higher lows. Every dip over the past week has been met with strong buying pressure, suggesting that bulls remain in control.
Currently, ETH is hovering just under the $4,794 resistance zone, which is the last major hurdle before the psychological $5,000 level. Above this, the chart shows a target zone at $5,200, which aligns with the upper projection from the recent bullish swing. On the downside, the immediate support is at $4,331, with a deeper cushion around $3,941 in case of a pullback.
The buy and sell markers on the chart show that most recent buy signals occurred during shallow retracements, while the clustered sell signals in earlier phases have been invalidated by continued upward momentum. The risk/reward setup is clearly favorable for bulls, with the stop placed well below the current price action and the profit target extending into fresh highs.
Trade Setup 📊
• Entry: $4,735.99
• Stop Loss: $4,538.41
• Take Profit: $5,200
• R:R Ratio: 2.35
• Bias: Bullish
As long as ETH holds above $4,538 and the ascending trendline remains intact, the probability favors a push through $4,794 toward $5,000 and eventually $5,200. A clean breakout with volume would confirm continuation, while a failure to hold the support could invite a short-term retracement. Booking partial gains near $5,000 and trailing stops is recommended to protect profits.


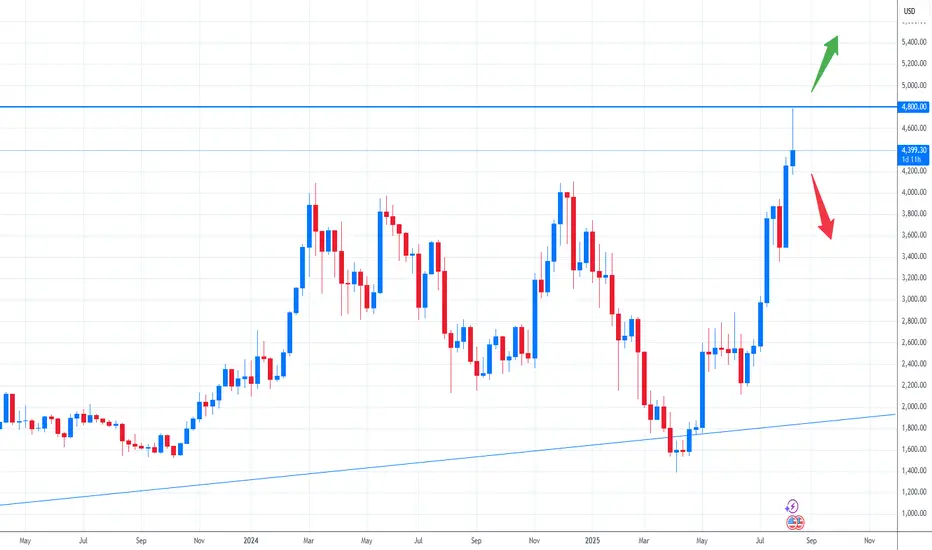
Ethereum Faces Correction After Retesting All-Time HighEthereum (ETH) is currently trading around USD 4,391 after testing its all-time high from November 2021. The rejection at that level mirrors Bitcoin’s pullback on the same trading day last week, suggesting broader weakness across the crypto market.
The weekly chart shows a bearish pinbar candlestick, signaling potential continuation of the correction. This setup reinforces the risk of further downside, with the double top formation adding negative momentum. The USD 4,000 zone remains the first key support, as it previously acted as a major resistance. A decisive break below could pave the way toward USD 3,400, a deeper but technically significant support area.
Other factors also point to caution. Rising U.S. Treasury yields and ongoing dollar strength weigh on crypto sentiment, while profit-taking after a sharp rally is adding to pressure. On-chain data shows a slowdown in active wallet growth, which may indicate waning short-term demand.
Still, medium-term fundamentals remain supportive, with strong interest in Ethereum’s DeFi and staking ecosystem. However, in the short run, technical signals favor a correction. Traders should watch whether 4,000 holds—failure could open the door to a deeper retracement before the uptrend resumes.
Ethereum: A Crucial Retracement After Reaching New HighsThe Ethereum chart paints a clear picture of a market in a state of consolidation after a significant rally. Following a strong surge that carried the price to a new "Ext Resistance" zone, we are now observing a potential retracement. 📉 This pullback is a healthy development, allowing the market to find a new equilibrium before any further attempt at upward momentum.
Currently, Ethereum is poised to test a critical "Breaker Block" and "Minor Fib Golden Zone." 🧐 This area, spanning between the 61.8% ($3,883) and 78.6% ($3,652) Fibonacci retracement levels, is a high-probability zone for buyers to step in and defend the price. A successful defense of this zone would signal continued bullish momentum.
[*
Just below this golden zone lies an "Order Block," which can act as a secondary layer of support. 🧱 This area represents a concentration of institutional buying interest and could provide a robust floor if the first support level is breached.
A more substantial test for the bulls would be a retracement to the "Major Fib Golden Zone" and the lower "Breaker Block." 🎯 This confluence of technical support levels, stretching from around $2,760 to $2,099, represents a strong demand area. A drop to this zone would likely be met with significant buying pressure, presenting a potential entry point for long-term investors.
Should the price fail to hold the major support zones and break down, the next target for the bears would be the "Ext Support" zone, near the $1,500 level. 💥 Such a move would invalidate the current bullish structure and suggest a broader market shift.
Disclaimer
The information provided in this chart is for educational and informational purposes only and should not be considered as investment advice. Trading and investing involve substantial risk and are not suitable for every investor. You should carefully consider your financial situation and consult with a financial advisor before making any investment decisions. The creator of this chart does not guarantee any specific outcome or profit and is not responsible for any losses incurred as a result of using this information. Past performance is not indicative of future results. Use this information at your own risk. This chart has been created for my own improvement in Trading and Investment Analysis. Please do your own analysis before any investments.

ETH/USD can be predicted by ETH/BTCYou can anticipate the peak of ETH/USD trends based on ETH/BTC.
Simple and Effective!
