Ethrium:next what!4-hour Ethereum (ETH/USDC)
**Resistance zones** sit around **$3,588**, **$3,805**, and **$3,886**, while a stronger barrier lies near **$4,112** — the upper edge of the channel. On the downside, **$3,167** is the key support being tested right now, and if it breaks, ETH could slide toward **$2,745*
Related pairs

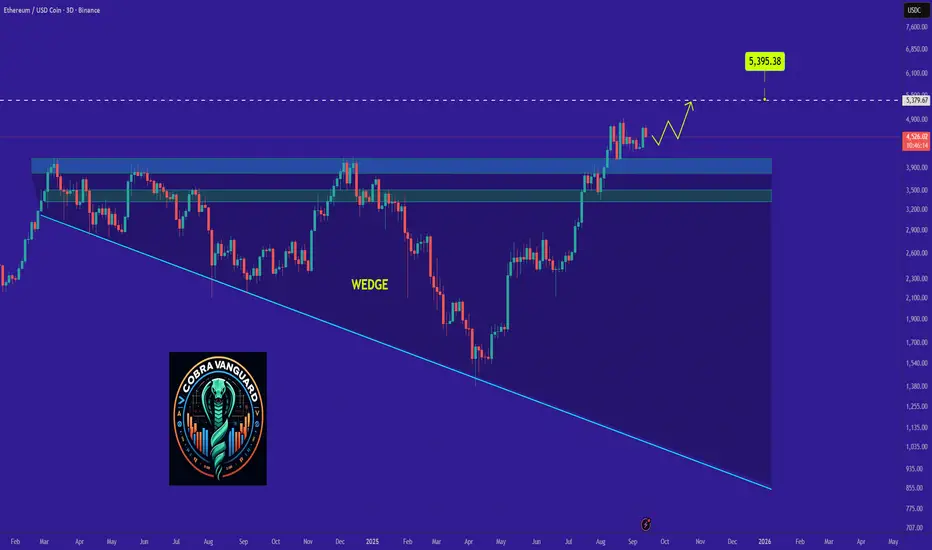
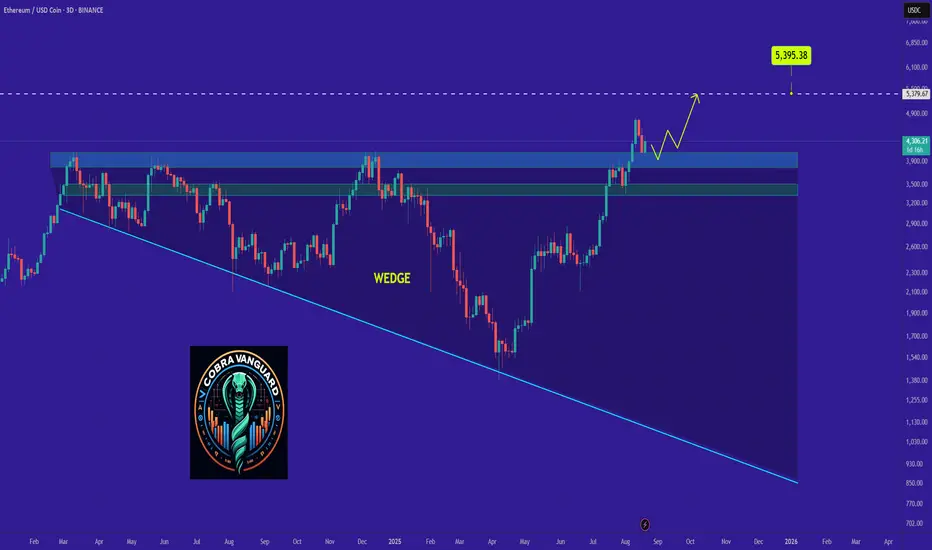
"ETH - Time to buy again!" (Update)The ETH will increase $2K and reach to the top of the wedge in the coming weeks .
Best regards CobraVanguard.💚

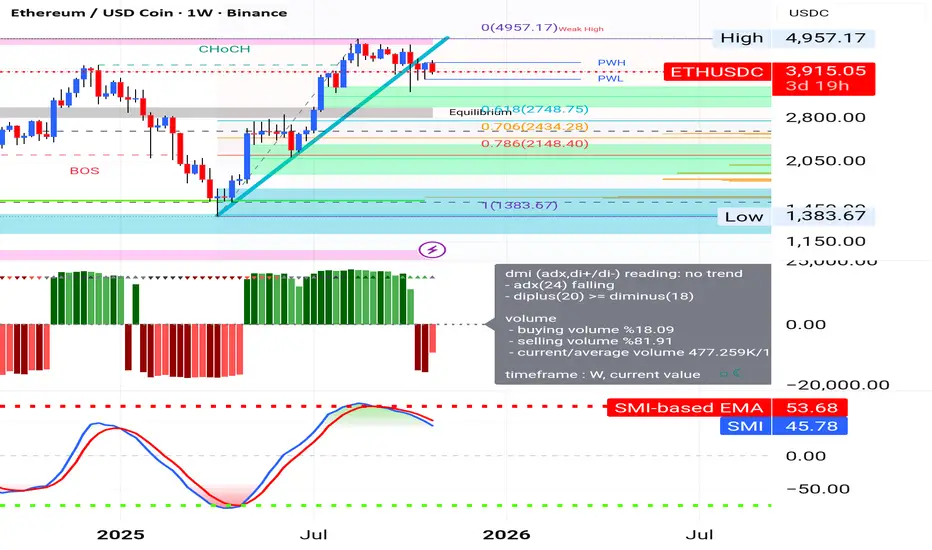
Ethereum Short on Weekly? ETH broke the weekly support. Bear 🐻 around?
🔮 Ethereum (ETH) Short-Term Market Overview
* Recent Trend: Ethereum has shown a degree of volatility recently but has generally been in a consolidation phase. In the past week, some sources indicate the price has seen a slight increase (around +1.69
Ethereum-Game start nowtechnical analysis with key support and resistance
The Ethereum/USDC daily chart shows a recent breakdown from its rising channel, with clear Fibonacci retracement levels providing important support and resistance zones. The latest price action suggests a bearish move, making these levels crucial f

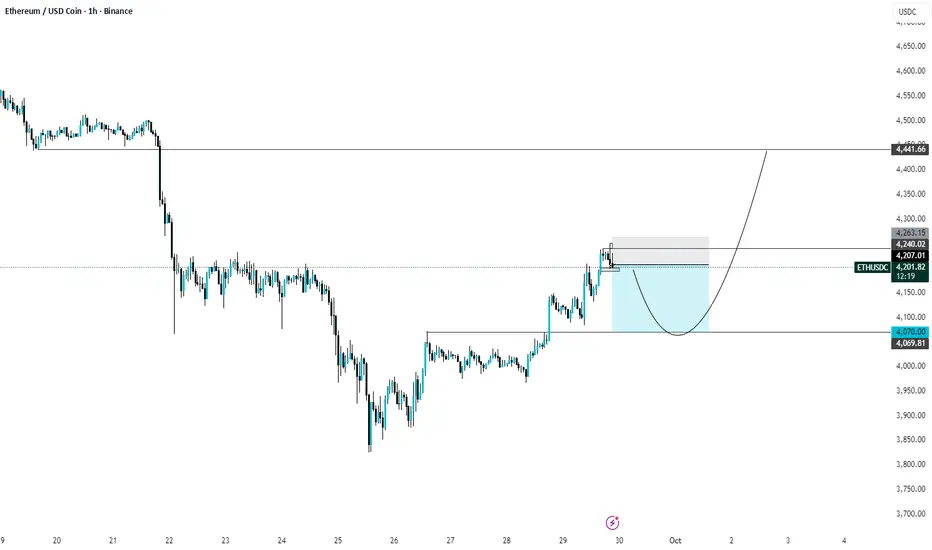
ETH - Pull and pushLooking up for a pullback to 4.070. Then, a rush to 4.440. These are just my thoughts, based on my knowledge on technical analysis, this is not financial advice.
ETH's Situation, A Comprehensive Analysis !!!As discussed in the previous analysis, the price has finally broken the wedge, and now, with a slight pullback, it could reach above $5k.
PREVIOUS ANALYSIS
ETH Long PositionETH stucked between 4,500 and 4,250. In my opinion this is a very good opportunity for a long position 1:3 RR. MM's are resting, retail - like me, will push it to ~4430-4450.

ETH's Situation, A Comprehensive Analysis !!!As discussed in the previous analysis, the price has finally broken the wedge, and now, with a slight pullback, it could reach above $5k.
PREVIOUS ANALYSIS

Why ETH Remains Bullish and Its Next Potential Move !As discussed in the previous analysis, the price has finally broken the wedge, and now, with a slight pullback, it could reach above $5k.
PREVIOUS ANALYSIS
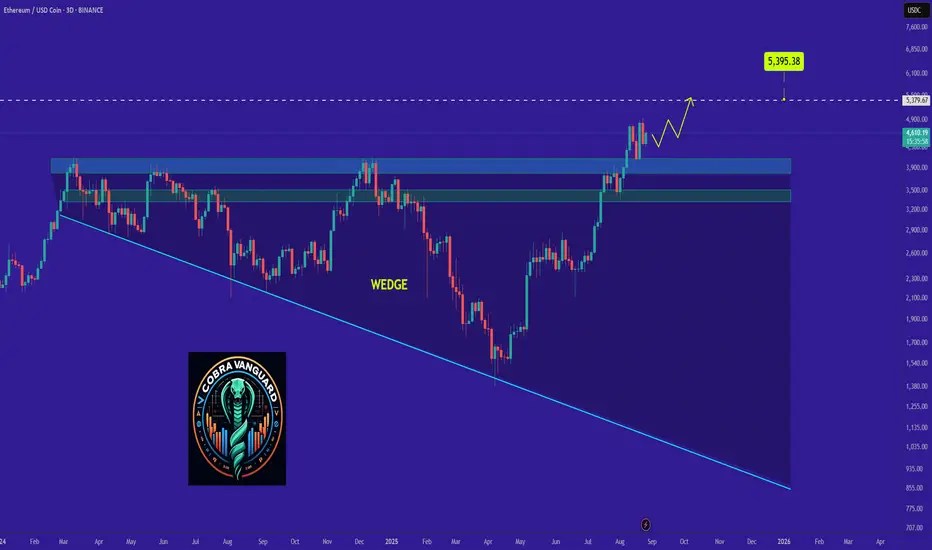
Why ETH Remains Bullish and Its Next Potential Move !It appears that the pullback is nearing its end, which could potentially lead to a price increase of up to $5000.
PREVIOUS ANALYSIS
See all ideas
Summarizing what the indicators are suggesting.
Oscillators
Neutral
SellBuy
Strong sellStrong buy
Strong sellSellNeutralBuyStrong buy
Oscillators
Neutral
SellBuy
Strong sellStrong buy
Strong sellSellNeutralBuyStrong buy
Summary
Neutral
SellBuy
Strong sellStrong buy
Strong sellSellNeutralBuyStrong buy
Summary
Neutral
SellBuy
Strong sellStrong buy
Strong sellSellNeutralBuyStrong buy
Summary
Neutral
SellBuy
Strong sellStrong buy
Strong sellSellNeutralBuyStrong buy
Moving Averages
Neutral
SellBuy
Strong sellStrong buy
Strong sellSellNeutralBuyStrong buy
Moving Averages
Neutral
SellBuy
Strong sellStrong buy
Strong sellSellNeutralBuyStrong buy
Displays a symbol's price movements over previous years to identify recurring trends.