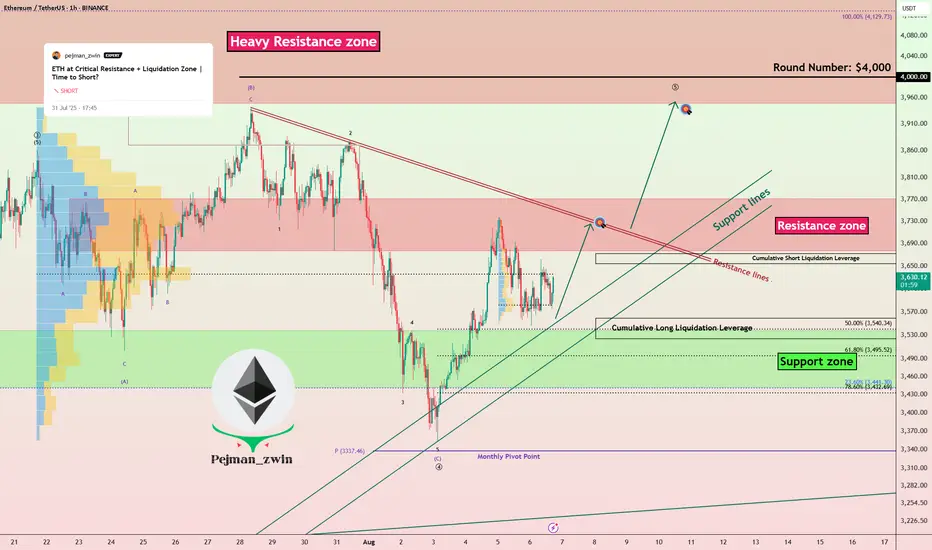
Ethereum Ready to Attack Resistances — Time to Long ETH?Ethereum ( BINANCE:ETHUSDT ) fell to the Support zone($3,538-$3,442) and Support lines as I expected in the previous idea .
Ethereum is currently trading near the Support zone($3,538-$3,442) , Support lines , and Cumulative Long Liquidation Leverage($3,559-$3,524) .
In terms of Elliott
Related pairs
ETH Started Another Impulsive Wave!ETH Started Another Impulsive Wave!
Today ETH ended another bullish wave and is expected to rise further.
The price reaction looks good so far. The market is expecting a rate cut by the FED during the September meeting. According to Reuters, the chances of a rate cut by the FED increase to 85.5%.

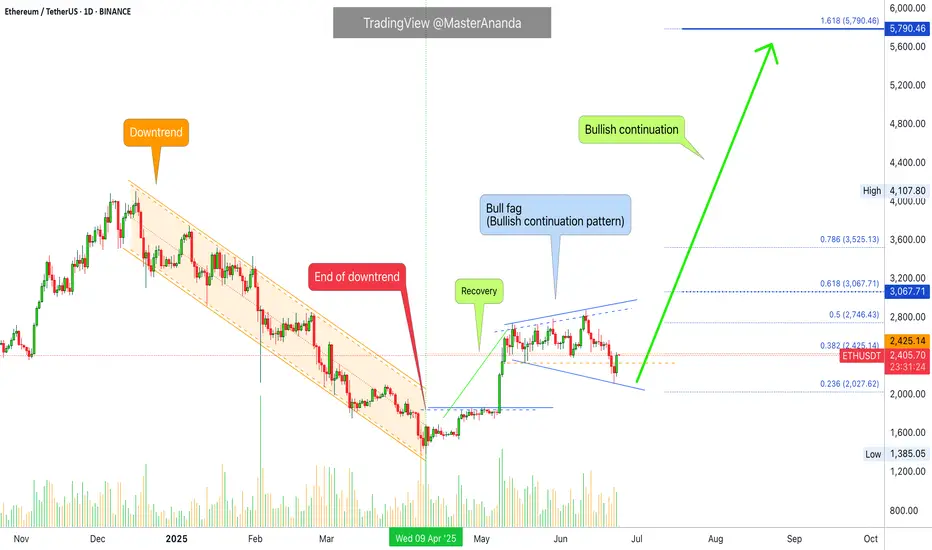
ETH - Eyes on a New All-Time High?ETHUSDT has been on fire lately, following a textbook bullish structure of Impulse → Fakeout → Impulse.
After breaking above the previous range in July, ETH confirmed strength with a sharp impulse move, only to shake out weak hands via a fakeout retest before pushing higher again. 📈
Currently, ET

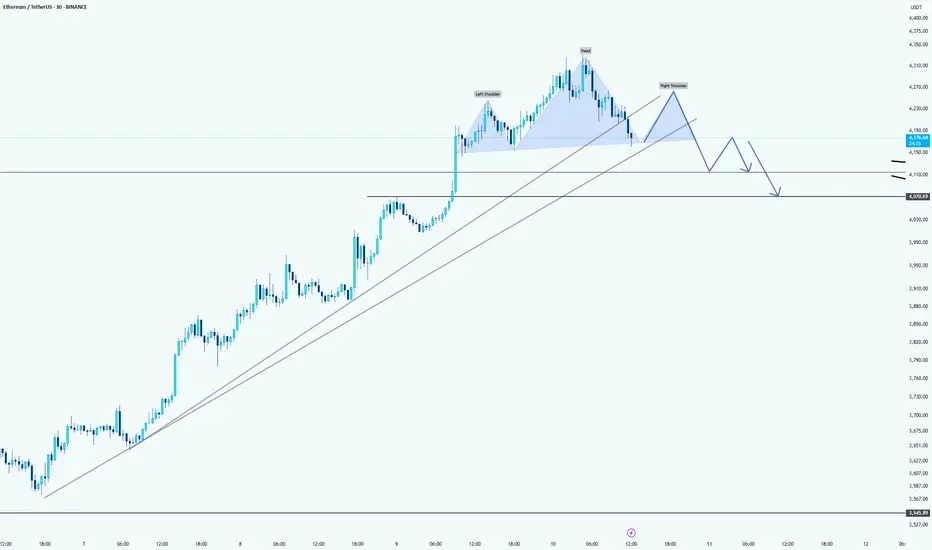
my view on ethAfter carefully observing the current ETH price structure, I’m leaning toward a bearish bias in the short to mid-term.
As always, this is not financial advice — just sharing my personal view based on market structure and price action. Risk management remains the most important tool in this game.

Ethereum: just a little bit correction hereHello guys!
Chart Pattern: Head and Shoulders
The chart shows a Head and Shoulders pattern forming on the Ethereum price action. The trendline drawn across the neckline of the pattern is a crucial support level to monitor.
Potential Breakdown:
If Ethereum fails to hold above the neckline (around
ETH | NEW ATH or DUMP ?Ethereum recently peaked at $3900. And allthough this is not a new ATH (close by a few hundred dollars), it is a local high for the year.
My last update was on an inverse Head and Shoulders pattern on ETH, which has since increased over 50%:
(The original idea here:)
The question now, is what

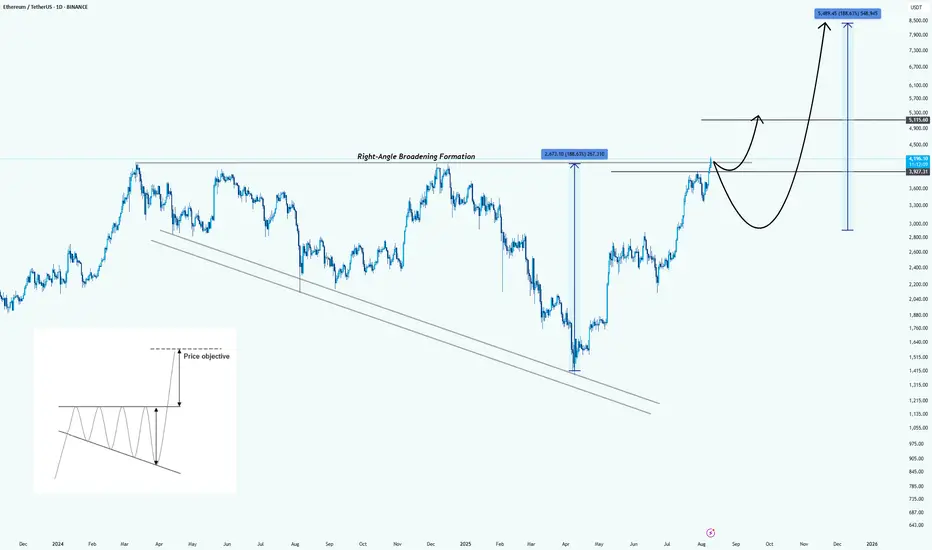
Ethereum: Formed a Right-Angle Broadening FormationHello guys!
Pattern Identified:
This is a Right-Angle Broadening Formation (characterized by a flat resistance level at the top (around $4,200 – $4,300) and a rising lower trendline). It shows increasingly volatile swings upward while repeatedly testing the same ceiling.
Technical Implication:
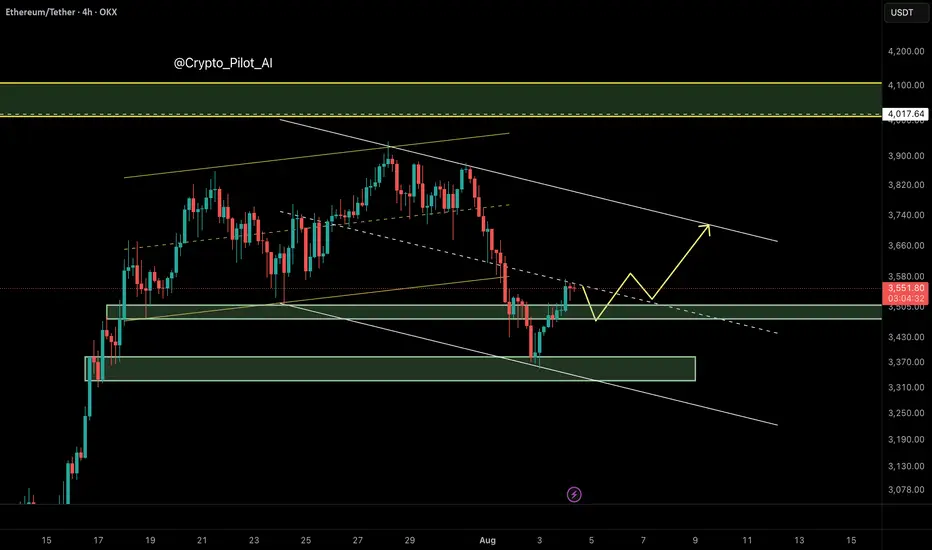
Ethereum (ETH/USDT) – Bearish Channel Structure Developing
⸻
🔍 Technical Overview
Ethereum has broken down from its ascending channel, invalidating the earlier bullish projection toward $4,000. After failing to hold the channel midline around $3,577, price dropped sharply to $3,360, forming a new bearish descending channel.
Currently, ETH is trading nea
Ethereum vs Small Cap. & The 2025-26 Cryptocurrency Bull MarketThe last three days ended up being a very nice flush, a strong one but the action quickly recovered above the 18-May low.
Ethereum was trading above $2,300 since mid-May and always stayed above this level. It broke suddenly below, out of nowhere, but the action is bullish again. We can say that thi
ETH ~ Ive given him some laxatives!okay, me giving him laxative means you know what gonna happen and till where it gonna fall loololl
See all ideas
Summarizing what the indicators are suggesting.
Oscillators
Neutral
SellBuy
Strong sellStrong buy
Strong sellSellNeutralBuyStrong buy
Oscillators
Neutral
SellBuy
Strong sellStrong buy
Strong sellSellNeutralBuyStrong buy
Summary
Neutral
SellBuy
Strong sellStrong buy
Strong sellSellNeutralBuyStrong buy
Summary
Neutral
SellBuy
Strong sellStrong buy
Strong sellSellNeutralBuyStrong buy
Summary
Neutral
SellBuy
Strong sellStrong buy
Strong sellSellNeutralBuyStrong buy
Moving Averages
Neutral
SellBuy
Strong sellStrong buy
Strong sellSellNeutralBuyStrong buy
Moving Averages
Neutral
SellBuy
Strong sellStrong buy
Strong sellSellNeutralBuyStrong buy
Displays a symbol's price movements over previous years to identify recurring trends.
Frequently Asked Questions
The current price of Ethereum / TetherUS (ETH) is 4,297.00 USDT — it has fallen −0.42% in the past 24 hours. Try placing this info into the context by checking out what coins are also gaining and losing at the moment and seeing ETH price chart.
Ethereum / TetherUS price has risen by 21.02% over the last week, its month performance shows a 43.05% increase, and as for the last year, Ethereum / TetherUS has increased by 68.16%. See more dynamics on ETH price chart.
Keep track of coins' changes with our Crypto Coins Heatmap.
Keep track of coins' changes with our Crypto Coins Heatmap.
Ethereum / TetherUS (ETH) reached its highest price on Nov 10, 2021 — it amounted to 4,868.00 USDT. Find more insights on the ETH price chart.
See the list of crypto gainers and choose what best fits your strategy.
See the list of crypto gainers and choose what best fits your strategy.
Ethereum / TetherUS (ETH) reached the lowest price of 81.79 USDT on Dec 15, 2018. View more Ethereum / TetherUS dynamics on the price chart.
See the list of crypto losers to find unexpected opportunities.
See the list of crypto losers to find unexpected opportunities.
The safest choice when buying ETH is to go to a well-known crypto exchange. Some of the popular names are Binance, Coinbase, Kraken. But you'll have to find a reliable broker and create an account first. You can trade ETH right from TradingView charts — just choose a broker and connect to your account.
Crypto markets are famous for their volatility, so one should study all the available stats before adding crypto assets to their portfolio. Very often it's technical analysis that comes in handy. We prepared technical ratings for Ethereum / TetherUS (ETH): today its technical analysis shows the buy signal, and according to the 1 week rating ETH shows the buy signal. And you'd better dig deeper and study 1 month rating too — it's strong buy. Find inspiration in Ethereum / TetherUS trading ideas and keep track of what's moving crypto markets with our crypto news feed.
Ethereum / TetherUS (ETH) is just as reliable as any other crypto asset — this corner of the world market is highly volatile. Today, for instance, Ethereum / TetherUS is estimated as 2.43% volatile. The only thing it means is that you must prepare and examine all available information before making a decision. And if you're not sure about Ethereum / TetherUS, you can find more inspiration in our curated watchlists.
You can discuss Ethereum / TetherUS (ETH) with other users in our public chats, Minds or in the comments to Ideas.