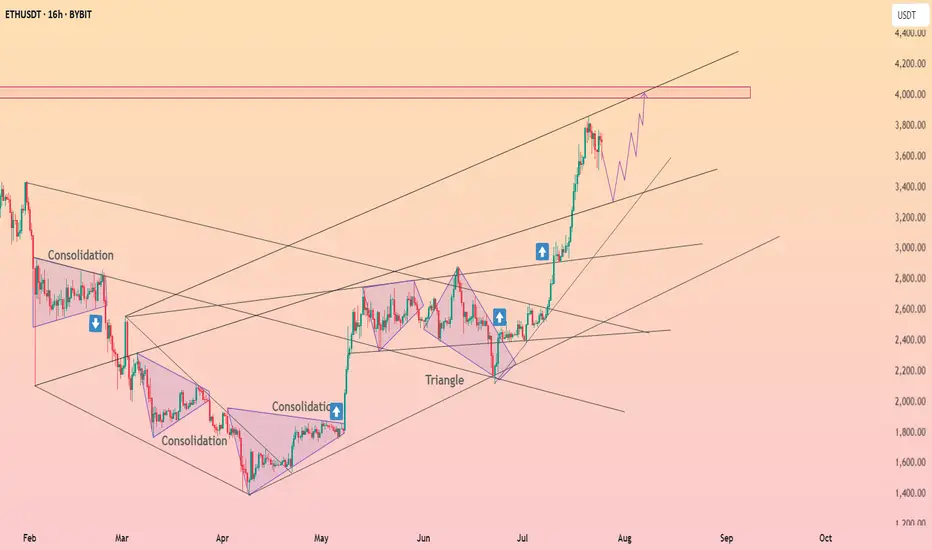
4000$ is last resistance left Ready for breakout and pump?market is still bullish and i am looking for breakout here to the upside for sure But we should consider this factor that major resistance now is touching and we may have first short-term fall.
so for now we may have correction and dump to the targets like 3300$ which is first support of 0.23 Fibon
ETH - 5500 USD in the short-term (Banks and states buying!)ETH is pumping, and altcoins with it. That means we are in an alt season, which I predicted in the previous post here on July 9, before the pump:
ETH is part of the USA crypto reserve, and banks also love this altcoin. The ETH ETF was launched, and the big players already count this coin as the fut

#ETHUSDT: Price is going as expected in previous ideas on eth!!ETHUSDT is performing well as expected in our previous analysis, as the price has reached the $4000 area. There are two potential areas where the price could reverse. The first is a small correction, which could cause a sharp price reversal without a significant price correction. The second area is
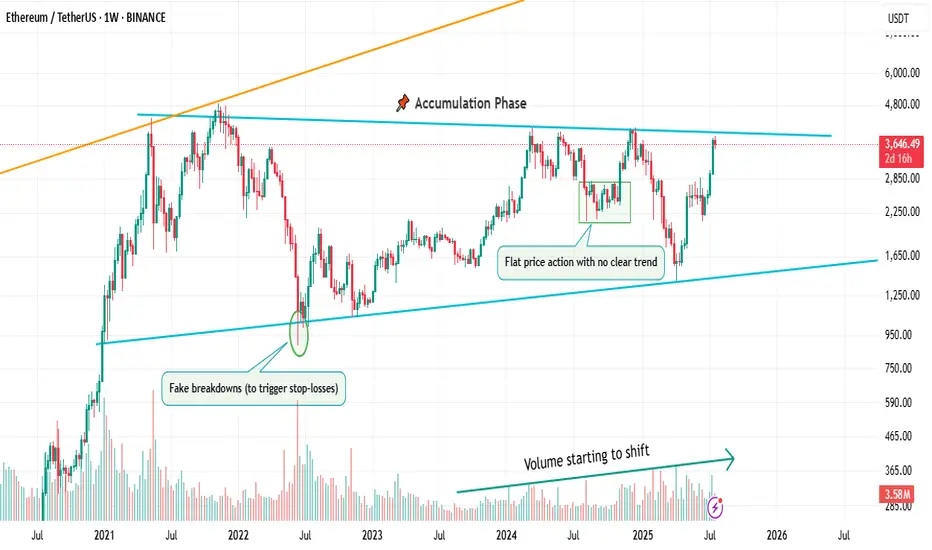
Flat, Quiet… and Full of Clues .Most traders only see the middle.
The acceleration. The “trend”. The movement.
But that’s just one-third of the story.
If you really want to understand the market’s rhythm,
you need to study how moves begin, evolve, and die.
Let’s break down the 3 key phases every market goes through —
again, and
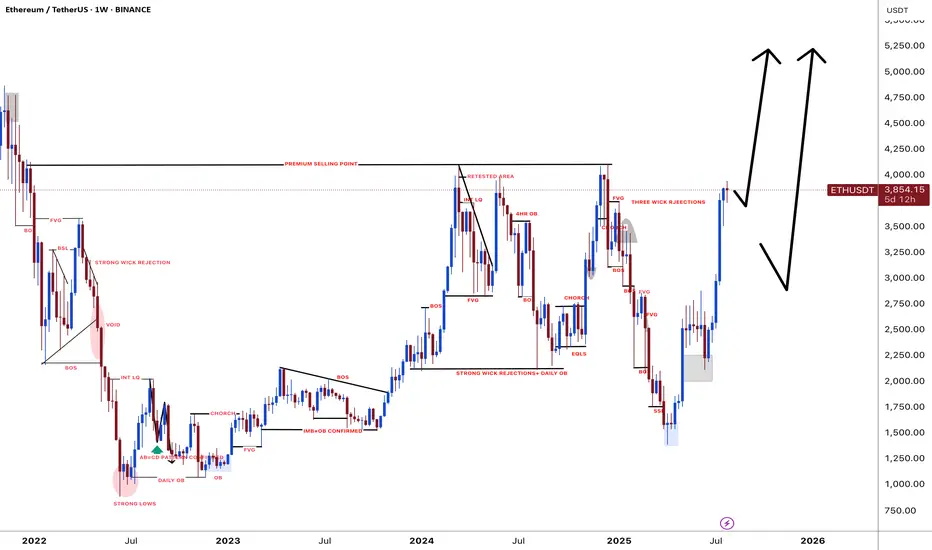
Ethereum at a Critical Crossroad: Will $4,000 Finally Break ?Ethereum is once again approaching the psychologically significant $4,000 resistance level, a high-timeframe barrier that has rejected price on multiple occasions. As the second-largest cryptocurrency by market cap pushes higher, traders are closely watching for signs of a breakout—or another range-

Ethereum: Multiple Time Frame AnalysisEthereum: Multiple Time Frame Analysis
From the chart, we can see that Ethereum is in a clear uptrend on all timeframes.
The daily chart is bullish and is not yet showing signs of a reversal on the May timeframe.
Yesterday, ETH also confirmed an ascending triangle pattern on a lower timeframe,

ETH ANALYSIS🔮 #ETH Analysis 🚀🚀
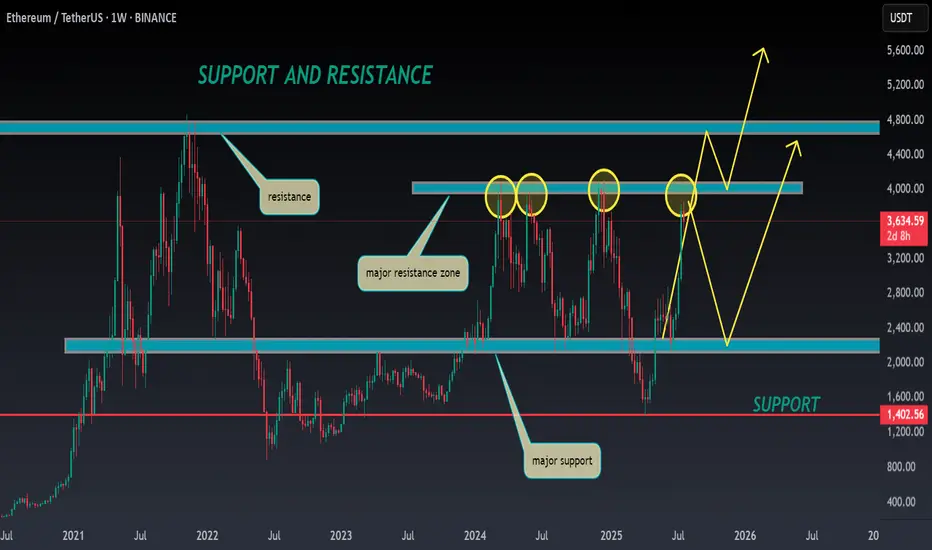
💲💲 #ETH is trading between support and resistance area. There is a potential rejection again from its resistance zone and pullback from support zone. If #ETH breaks the major resistance zone then we would see a bullish move
💸Current Price -- $3634
⁉️ What to do?
- We have mark
Ethereum (ETH): $4000 Incoming | Breakout or Rejection?Ethereum is not showing any remorse to sellers of the coin, and we are almost near the major resistance zone of $4000.
What we are looking for or expecting from here is either to get the proper breakout from this region or a rejection. As of now it is hard to say which one we will get so once we r

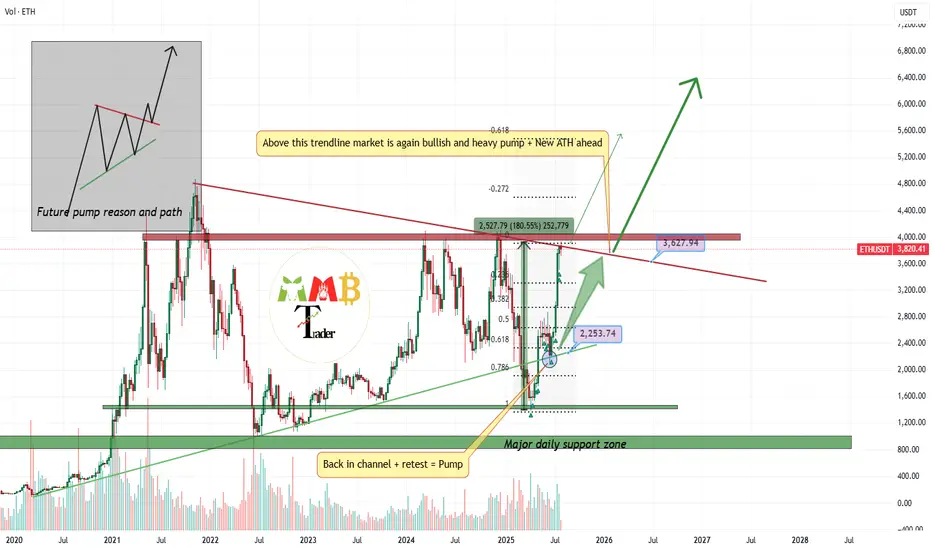
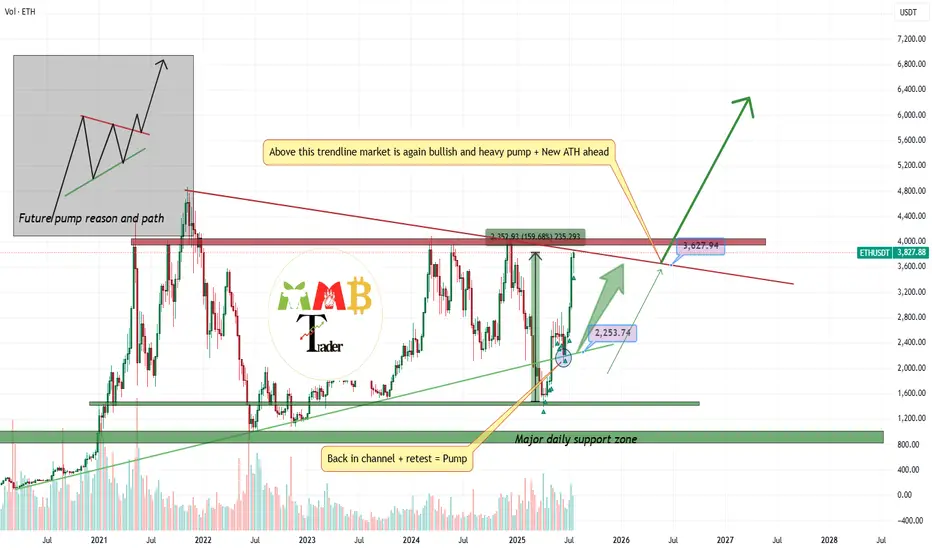
ETHUSDT market is ready to explode and PumpAs we mentioned before Price is now near weekly resistance and range and even short-term fall here is expected but this time i am looking for breakout to the upside and huge pump after that like the green arrows on chart.
So get ready and wait for that breakout and next phase of bull run to start so
Ethereum will retest the $3,500 level ┆ HolderStatOKX:ETHUSDT is trending upward with $3,100 as the next resistance. Breakout aims for $3,250. $2,875 remains critical support. Bullish momentum intact.
See all ideas
Summarizing what the indicators are suggesting.
Oscillators
Neutral
SellBuy
Strong sellStrong buy
Strong sellSellNeutralBuyStrong buy
Oscillators
Neutral
SellBuy
Strong sellStrong buy
Strong sellSellNeutralBuyStrong buy
Summary
Neutral
SellBuy
Strong sellStrong buy
Strong sellSellNeutralBuyStrong buy
Summary
Neutral
SellBuy
Strong sellStrong buy
Strong sellSellNeutralBuyStrong buy
Summary
Neutral
SellBuy
Strong sellStrong buy
Strong sellSellNeutralBuyStrong buy
Moving Averages
Neutral
SellBuy
Strong sellStrong buy
Strong sellSellNeutralBuyStrong buy
Moving Averages
Neutral
SellBuy
Strong sellStrong buy
Strong sellSellNeutralBuyStrong buy
Displays a symbol's price movements over previous years to identify recurring trends.