Understanding Liquidity: Where Big Players Hunt Stops
Understanding Liquidity: Where Big Players Hunt Stops
Ever wondered why price suddenly spikes through your stop-loss and reverses moments later? That’s not a coincidence—it’s liquidity at play. This article will teach you how liquidity zones work, why stop hunts happen, and how to avoid getting trapped like the crowd.
🔵 What Is Liquidity in Trading?
Liquidity refers to how easily an asset can be bought or sold without drastically affecting its price. But in practical trading, liquidity is more than just volume—it’s where traders *place* their money.
Large players—institutions, market makers, or big accounts—need liquidity to fill orders.
They target areas where many retail stop-losses or pending orders are stacked.
These areas are often just above resistance or below support—classic stop-loss zones.
To move large positions without slippage, smart money uses stop hunts to trigger retail orders and create the liquidity they need.
🔵 Where Do Liquidity Zones Form?
Liquidity often builds up in predictable areas:
Above resistance: Where shorts place stop-losses.
Below support: Where longs place stop-losses.
Swing highs/lows: Obvious turning points everyone sees.
Round numbers: e.g., 1000, 10,000, 50,000.
Breakout zones: Where breakout traders place entries or stops.
These zones act like magnets. When price approaches them, it accelerates—seeking the liquidity pool behind the level.
🔵 What Is a Stop Hunt?
A stop hunt happens when price moves just far enough to trigger stop-losses before reversing. This isn’t market noise—it’s an intentional move by big players to:
Trigger a flood of stop orders (buy or sell).
Fill their own large positions using that liquidity.
Reverse price back to fair value or the prior trend.
Example: Price breaks above resistance → stops get hit → institutions sell into that liquidity → price drops sharply.
🔵 Signs You’re in a Liquidity Grab
Look for these clues:
Fast spike beyond key levels followed by rejection.
Wick-heavy candles near highs/lows.
Price touches a level, then sharply reverses.
High volume on failed breakouts or fakeouts.
These are signs of a liquidity event—not a real breakout.
🔵 How to Trade Around Liquidity Zones
You can use liquidity traps to your advantage instead of becoming their victim.
Avoid obvious stops: Don’t place stops directly below support or above resistance. Instead, use ATR-based or structure-based stops.
Wait for confirmation: Don’t chase breakouts. Let price break, reject, then re-enter inside the range.
Watch for wick rejections: If price quickly returns after a level is breached, it's often a trap.
Use higher timeframe confluence: Liquidity grabs are more powerful when they align with HTF reversals or zones.
🔵 Real Example: Liquidity Sweep Before Reversal
In this chart, we see a textbook liquidity grab:
Price breaks below support.
Longs get stopped out.
Candle prints a long wick.
Market reverses into an uptrend.
This is where smart traders enter— after the trap is set, not during.
🔵 Final Thoughts
Liquidity is the invisible hand of the market. Stop hunts aren’t personal—they’re structural. Big players simply go where the orders are. As retail traders, the best thing we can do is:
Understand where traps are set.
Avoid being part of the crowd.
Trade the reaction, not the initial breakout.
By thinking like the smart money, you can stop getting hunted—and start hunting for better trades.
ETHUSDT trade ideas

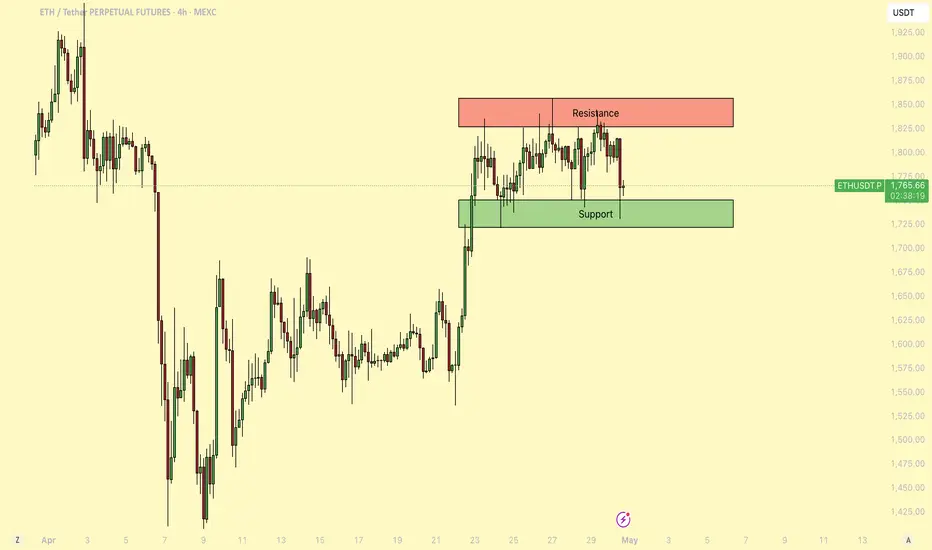
ETH - Consolidating before a major breakout!About a week ago, Ethereum (ETH) saw a strong upward move, pushing the price up with notable momentum. Since then, it has entered a period of consolidation, trading within a tight range as the market awaits the next decisive move.
-------------------------------
Which Direction Will ETH Break?
After such a strong rally, this kind of consolidation is normal. It could signal a continuation to the upside, especially if this is part of a broader relief rally. However, it's important to note that during the rapid move up, ETH left behind a 4h Fair Value Gap (FVG), which may attract price back down for a potential fill in the event of a breakdown.
-------------------------------
Stochastic RSI insight
On the daily chart, the Stochastic RSI remains in the overbought zone. Historically, when this indicator lingers in such territory, ETH has seen notable pullbacks. This could be an early sign that a downward move is more likely unless momentum changes soon.
-------------------------------
ETH vs. the 50-Day Moving Average
ETH is currently struggling with the 50-day Moving Average (MA), trading just below this key resistance level. As long as ETH remains under the 50-day MA, bearish pressure could continue. However, a reclaim and sustained hold above this level would likely indicate a shift toward bullish momentum.
-------------------------------
My Outlook
This range is tricky to trade, and a breakout in either direction is possible. Personally, I think there's a chance ETH could sweep the recent highs before a larger move down. The overbought Stochastic RSI and resistance at the 50-day MA both suggest that the rally might be losing steam in the short term.
-------------------------------
Thanks for your support.
- Make sure to follow me so you don't miss out on the next analysis!
- Drop a like and leave a comment!
ETH Analysis Update target ??
#Ethereum needs to close a daily candle above the orange zone at $2200 to confirm the continuation of the bullish trend. 📈
As long as the price remains below this level, caution is advised. A breakout and daily close above $2200 would likely trigger a strong upward movement.

Ethereum - Take LONG with MEEthereum - Take LONG with ME
we have long from 1754 with our team
follow up trend untip it breaks

ETHUSDT: Progressing Well 01/05/2025 UPDATEThe ETHUSDT price is moving well, currently trading above the 1700$ area. We anticipate a continuous rise, potentially reaching $2400 first and then $3000. Our swing target remains at $4500. The current price behaviour and momentum suggest an extremely bullish outlook.
Good luck and trade safely!
Thank you for your unwavering support! 😊
If you’d like to contribute, here are a few ways you can help us:
- Like our ideas
- Comment on our ideas
- Share our ideas
Team Setupsfx_
❤️🚀

Ethereum (ETH/USDT) – Bullish Momentum Building Toward targetHello guys...
Ethereum has broken out of its long-term descending channel and is currently trading inside a smaller ascending channel, showing strong bullish momentum. After a "fake breakout" below major support around $1,400, ETH quickly reclaimed higher levels, suggesting a bear trap.
Currently, ETH is approaching the critical resistance zone around $2,000. As long as the price stays inside this rising structure and continues making higher lows, the bias remains bullish toward a test of the major resistance.
✅ A clear breakout above $2,000 could trigger a stronger move up.
⚠️ However, if the structure breaks down, we should watch for potential pullbacks.
___________________________
Key Levels to Watch:
Support: $1,720–$1,750 zone
Resistance: $2,000–$2,050 zone

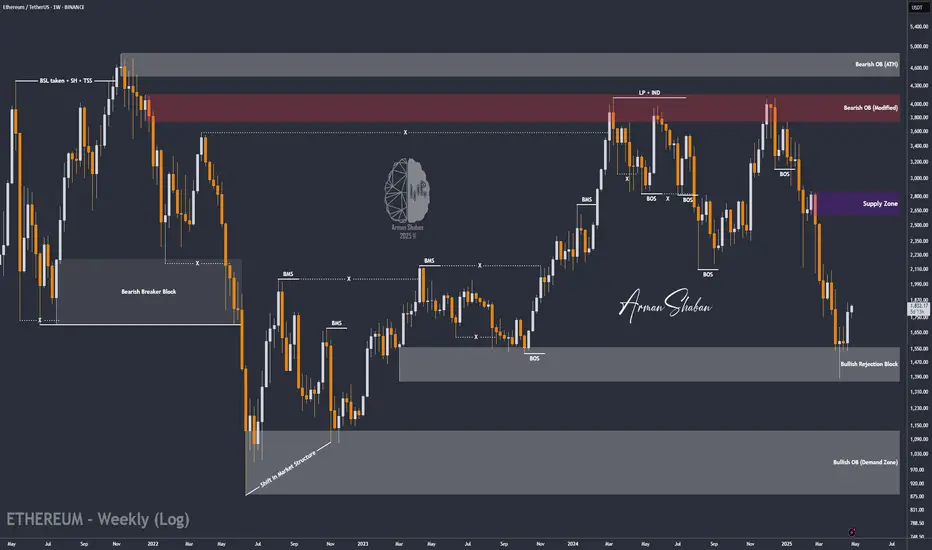
ETH/USDT : Bulls are coming back? (READ THE CAPTION)By analyzing the #Ethereum chart on the weekly (logarithmic) timeframe, we can see that after reaching the demand zone between $1400 and $1550, buying pressure increased significantly. Currently, Ethereum is trading around $1800, and I expect to see the next bullish wave soon. The potential upside targets are $1990, $2500, and $2600. This analysis will be updated accordingly!
Please support me with your likes and comments to motivate me to share more analysis with you and share your opinion about the possible trend of this chart with me !
Best Regards , Arman Shaban
ETH found a bottom at the 2018 All Time High IMO
#ETH RSI also hit the bottom levels🧐
As I said many times 'not accumulating CRYPTOCAP:ETH below $2k' is such a mistake❗️
#Ethereum still the bottom levels, now it's setting for the rally do not miss🚀
@VIPROSE

Ethereum (ETH): Formed Fakeout in Channel | Sellers DominateBuyers failed to have a proper breakout on ETH, where sellers took back the dominance and now are showing pressure, pushing the price back to the lower side of the sideways channel. Before reaching that zone, we are setting our first target at the 200EMA line, which has been acting as some sort of support area for the coin.
Swallow Academy

Ethereum is Nearing The Daily TrendHey Traders, in today's trading session we are monitoring ETH/USDT for a selling opportunity around 2,000 zone, Ethereum is trading a downtrend and currently is in a correction phase in which it is approaching the trend at 2,000 support and resistance area.
Trade safe, Joe.

Ethereum (ETH): Waiting For More Clarity, Eyes on 200EMANothing much has changed on Ethereum, where the price has been trading in our golden zone between the 200EMA and our resistance zone.
While price has been moving up and down in a sideways channel for the past week, we are expecting some volatile breakout or breakdown to happen this week, when the monthly candle of ETH will close and a new one will open.
So we wait; once one of our zones is reached, we will be looking for a long position or a short position (if 200EMA will be broken), depending on market structure development.
Swallow Academy

ETH short
Liquidity sweep and rejection at the monthly open.
Short trigger. Aiming for the previous weeks high
Confluent with the value area low of the current week so far (volume profile)

#ETHUSDTTwo areas for selling trades are marked with a reward of one to three. It is better to enter in the higher area because it is less risky, and the lower area is more risky because the price may hit the lower area stop to reach the upper area.

Ethereum (ETH): Looking For Market Structure Break | Golden ZoneEthereum is still inside the golden zone, which we determined on a 4-hour timeframe, where we see pressure from sellers being bigger than buyers.
Usually this kind of structure development leads to MSB formation so that's what we are looking for. As long as sellers maintain the price below the upper resistance zone, we are good for a smaller correctional movement here.
Swallow Academy

ETH - Longs on the Go!Hello TradingView Family / Fellow Traders. This is Richard, also known as theSignalyst.
📈ETH has been overall bullish from a medium-term perspective trading within the rising channel marked in blue.
Moreover, the red zone is a strong resistance turned support!
🏹 Thus, the highlighted blue circle is a strong area to look for buy setups as it is the intersection of support and lower blue trendline acting as a non-horizontal support.
📚 As per my trading style:
As #ETH approaches the blue circle zone, I will be looking for bullish reversal setups (like a double bottom pattern, trendline break , and so on...)
📚 Always follow your trading plan regarding entry, risk management, and trade management.
Good luck!
All Strategies Are Good; If Managed Properly!
~Rich

Ethereum: Sell Or Hold? Panic Buy, Panic Sell or Panic Hold?If I were you in this situation, what would you do?
What would you do if you were not you in this situation?
Ethereum hit bottom on the 9th of April and the bottom is confirmed based on the same candle. It ended full green and with really high volume.
The action moved back above support on 22-April when the 3-Feb. low resistance was conquered. Ethereum now trades within a tight price range.
This range's support has been tested four times and it holds, Ethereum now trades higher but what will happen next? What would you do if I were me?
Market conditions can change in a day. Two days green, two days red it is all sideways, nothing changes and nothing has changed.
If you are still wondering if you should panic sell or panic hold right now all you have to do is panic buy because Ethereum is going up.
Ignore the short-term nothing because this chart isn't showing even noise. It is the consolidation of the higher low before additional growth.
Ethereum's chart looks very different to Bitcoin, it is incredible. Ethereum is no longer "#2" but more like an Altcoin, Bitcoin has its own chart while Ethereum has the chart of a medium sized Cryptocurrency pair. This is good, it tells us that Ethereum is about to grow really strong and will produce a new All-Time High in 2025. This All-Time High will be higher than 2021 because while this isn't Bitcoin it is still a very strong chart. Expect lower no more, panic buy followed by panic hold while you rest easy and relaxed because there is no panic when the market grows.
The only panic right now is on the short side because the bottom is in and the bears are gone.
Rest easy, do not let go of your coins. Hold strong.
Never ever use a stop-loss. Think long-term and the market will bless you with amazing results.
Namaste.

Ethereum at Risk of Breakdown Below Key Fibonacci Support
Ethereum’s price action is showing notable weakness as it tests a crucial Fibonacci level. Currently sitting on the 0.618 retracement, ETH is at a make-or-break point.
A confirmed close below $1,825, the current 0.618 Fibonacci level, would likely signal a deviation and a potential breakdown in structure. This would increase the chances of price rotating down toward the next major support at $1,055, which also aligns with a deeper 0.618 retracement from a higher timeframe — a level of historical significance and potential buying interest.
However, this downside move has not yet been confirmed. As long as Ethereum holds the current support, the structure remains intact. But if acceptance below this range occurs, especially with volume and momentum, it would likely initiate a broader corrective move.
Traders should remain patient and let the setup develop. A breakdown could present a high-probability buy-the-dip opportunity at lower support. Until then, caution is advised as price remains range-bound and vulnerable.

Ethereum (ETH): This Might Be Breakout Point For Us | Buy ZoneEthereum might start a good rally soon if buyers manage to secure current zones and form a break of structure here.
We are not going to rush here as today is just the beginning of the week and we might see bloody monday so waiting for proper BOS before entering into a long position here!
Swallow Academy

Technical Analysis: Ethereum (ETH) — April 30, 2025📊 Outlook
Ethereum is trading in a tight range with slight upward momentum. Current RSI is neutral, and price remains above the 50-day SMA, hinting at a sustained bullish trend. The Fear & Greed Index supports this positive sentiment. A break above $2,000 could confirm bullish continuation, while a drop below $1,700 may shift sentiment to bearish.
📌 Analyst Note: Maintain bullish bias while ETH remains above $1,790.66. Monitor resistance at $2,000 for breakout confirmation.
🔍 Indicators
RSI (14): 51.60 — Neutral
SMA 50: $1,790.66 — Price slightly above → Bullish
30-Day Volatility: 4.97%
Fear & Greed Index: 61 (Greed)
Technical Sentiment: Bullish
📈 Levels
Next Resistance: ~$2,000
Next Support: ~$1,700
Short-Term Price Target: $1,804.35 by May 30, 2025

Ethereum rising as we expectedEthereum rising as we expected
new long in a case of Big OI rise
Sell better to take at key zone in a case of bullish absorption

ETH ANALYSIS🔮 #ETH Analysis 🚀🚀
💲💲 #ETH is trading between support and resistance area. There is a potential rejection again from its resistance zone and pullback from trendline. If #ETH sustains above major resistance area then we will a bullish move till its major resistance area
💸Current Price -- $1,755
⁉️ What to do?
- We have marked crucial levels in the chart . We can trade according to the chart and make some profits. 🚀💸
#ETH #Cryptocurrency #DYOR

Crypto psychology ep4 : Why You Want to Make Money from Crypto ?Crypto isn’t just a market — it’s a dream factory. Every day, millions of people throw their money (and hopes) into the blockchain, all chasing the same thing: " financial freedom ". But why are people so drawn to making money from crypto? Let’s unpack it.
The Dream of Easy Money
Let’s be real: who doesn’t want to make money without breaking their back? Crypto promises that fantasy — you buy a coin, wait, and (hopefully) watch it explode in value. Unlike traditional jobs or businesses, it feels like you can skip the grind. That hope of less effort, more reward keeps pulling people in, even if the reality is much harsher.
Chasing the Jackpot Coin
Everyone’s looking for the next Bitcoin, the next 100x gem that could turn a few hundred bucks into millions. That “ lottery ticket ” mentality fuels the hunt for low-cap coins, meme tokens, or risky projects. It’s not just about profits — it’s about finding that one life-changing win that could rewrite their story forever.
The Escape from the 9-to-5 Job
For many, crypto isn’t just a side hustle — it’s a possible escape route. The idea of quitting that soul-crushing office job , saying goodbye to bosses and deadlines, and living on your own terms? Crypto makes it feel achievable. Even if it’s a long shot, it’s a shot people are willing to take to avoid spending decades in the rat race.
Important : Revenge on the Market
Since the brutal crashes of 2022 , a lot of traders have been left deep in the red. But instead of walking away, many are chasing the market harder than ever. It’s not just about making money anymore — it’s about getting back what they lost, proving they were right, and maybe even outsmarting the system that beat them before. That hunger for revenge can keep people in the game way longer than logic says they should stay.
Crypto isn't just numbers on a screen — it’s a cocktail of hope, desperation, and ambition. And that’s why, no matter how risky it gets, people keep coming back.
BINANCE:BTCUSDT BINANCE:DOGEUSDT BINANCE:XRPUSDT BINANCE:ADAUSDT

Ethereum Potential UpsidesHey Traders, in today's trading session we are monitoring ETHUSDT for a buying opportunity around 1780 zone, Ethereum is trading in an uptrend and currently is in a correction phase in which it is approaching the trend at 1780 support and resistance area.
Trade safe, Joe.
