Ethereum Correction Ending? Next Bullish Wave Loading!In the previous idea , I was able to find the Ethereum price top at $4,788 . The question is, has the Ethereum correction begun, or is there still hope for the creation of a new All-Time High(ATH)?
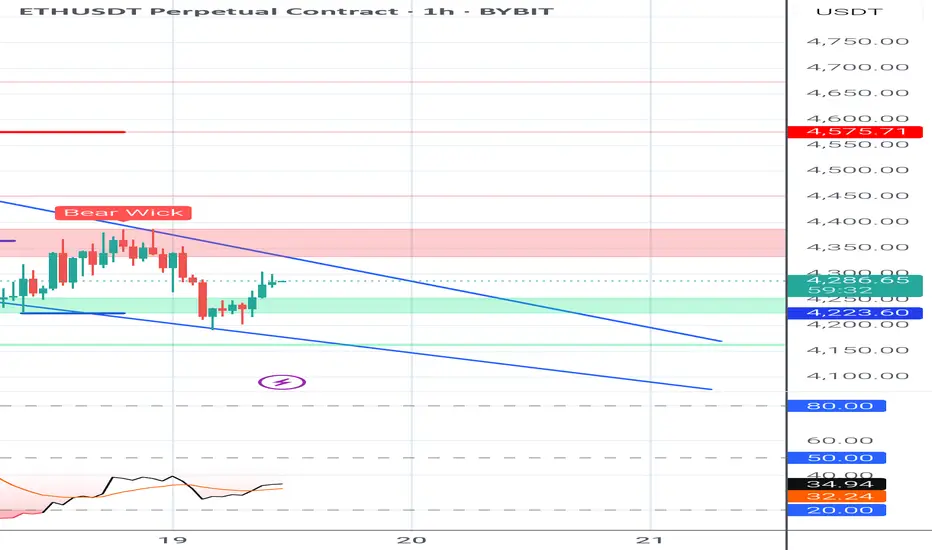
Ethereum ( BINANCE:ETHUSDT ) is currently trading near the Support zone($4,240-$4,186) , Cumulative Long Liquidation Leverage($4,205-$4,158) , and important Support lines .
In terms of Elliott Wave theory , it seems that Ethereum has completed a corrective wave . The corrective wave has a Double Three Correction structure(WXY) . If the Resistance zone($4,410-$4,324) and Cumulative Short Liquidation Leverage($4,416-$4,375) are broken, we can confirm the end of the corrective wave .
I expect Ethereum to start rising from important support lines and rise to at least $4,373 .
Second Target: $4,484
Third Target: $4,607
Stop Loss: $4,097
Note: Today's Fed Chair Powell Speaks can create excitement in financial markets, especially crypto.
Please respect each other's ideas and express them politely if you agree or disagree.
Ethereum Analyze (ETHUSDT), 1-hour time frame.
Be sure to follow the updated ideas.
Do not forget to put a Stop loss for your positions (For every position you want to open).
Please follow your strategy and updates; this is just my Idea, and I will gladly see your ideas in this post.
Please do not forget the ✅' like '✅ button 🙏😊 & Share it with your friends; thanks, and Trade safe.
ETHUSDT trade ideas
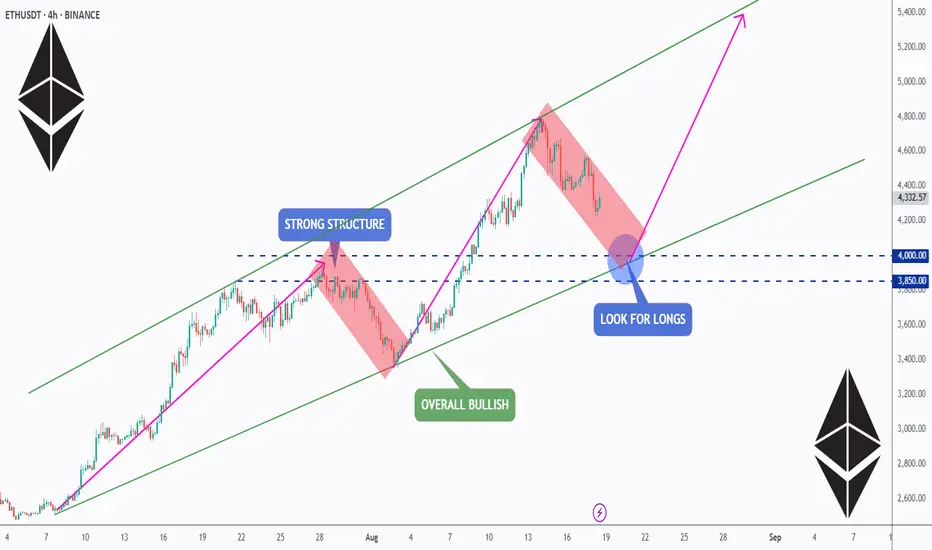
ETH Setup: Retest, Reload & Rally?ETH is pulling back after a strong run , but the bigger picture stays bullish. 📈
The $3,850–$4,000 zone is key — a solid structure + channel support. 🔑
If buyers step in here, we could see the next leg toward $5K and beyond. 🚀
Watching closely… time to retest, reload, and ride the rally? 👀
📚 Always follow your trading plan regarding entry, risk management, and trade management.
Good luck!
All Strategies Are Good; If Managed Properly!
~Richard Nasr
Ethereum Technical OutlookEthereum Technical Outlook
Ethereum remains in a well-defined bullish trend and is currently hovering near the lower boundary of its ascending support zone.
The $4000–$4050 area also aligns with a key structural level from previous price action, increasing the probability of a renewed upward move.
However, short-term sentiment may be influenced by speculation around Powell’s remarks, either in the FOMC minutes or during tomorrow’s Jackson Hole Symposium.
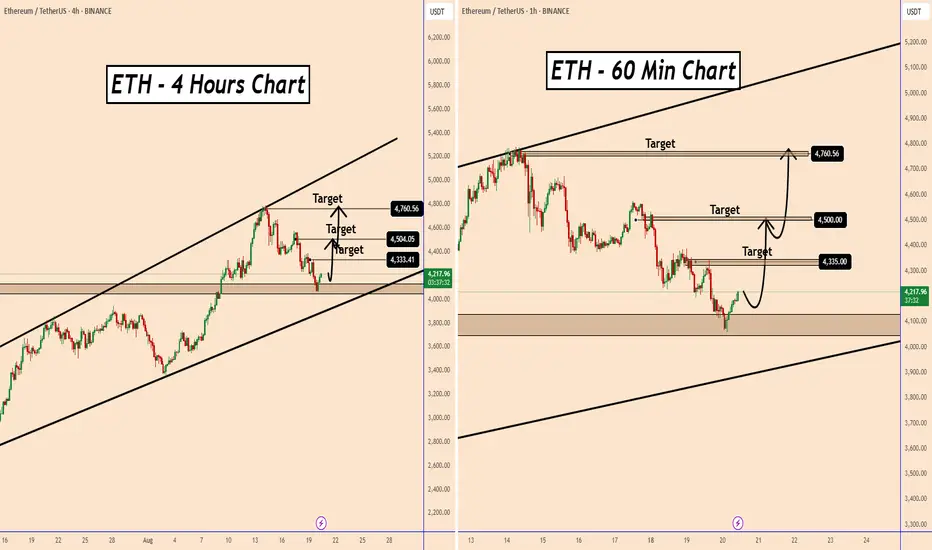
Key Resistance Levels to Watch:
$4335
$4500
$4760
A break above these levels could confirm continuation, while any hawkish tone from the Fed may temporarily weigh on momentum.
You may find more details in the chart!
Thank you and Good Luck!
PS: Please support with a like or comment if you find this analysis useful for your trading day
#ETHUSDT: $6000 Is The Next Target!!As we have been predicting since last one year or so, the ETH has reached almost $5000, now we can expect price to continue rising since it already made the correction. Target is $6000 this is swing target. Good luck and trade safe.
Team Setupsfx
Lingrid | ETHUSDT Trend Continuation Following CorrectionThe price perfectly fulfilled my previous idea . BINANCE:ETHUSDT recently rejected the resistance zone and moved into a corrective phase within a downward channel. Structure shows an A-B-C pullback forming after a sharp impulse leg topped out near 4785. Price is now testing the support zone near 4200, with potential for a bullish rebound if buyers step in strongly. In the broader context, Ethereum remains in an overall uptrend, but the corrective channel must break to confirm continuation.
📉 Key Levels:
Buy trigger: Rejection of 4050 level.
Buy zone: 4080–4100 support region.
Target: 4450 level, aligning with prior resistance.
Invalidation: Break below 4000 support.
💡 Risks:
A deeper breakdown through the 4000 support could extend losses toward 3800.
Momentum remains bearish inside the downward channel, requiring confirmation of breakout.
Macro risks (Fed policy, risk-off sentiment in equities) could weigh on crypto recovery
If this idea resonates with you or you have your own opinion, traders, hit the comments. I’m excited to read your thoughts!

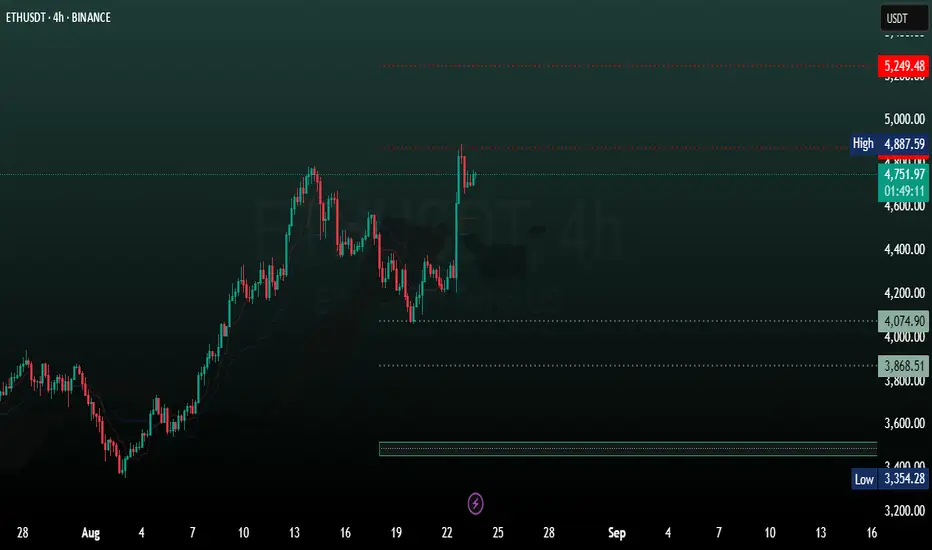
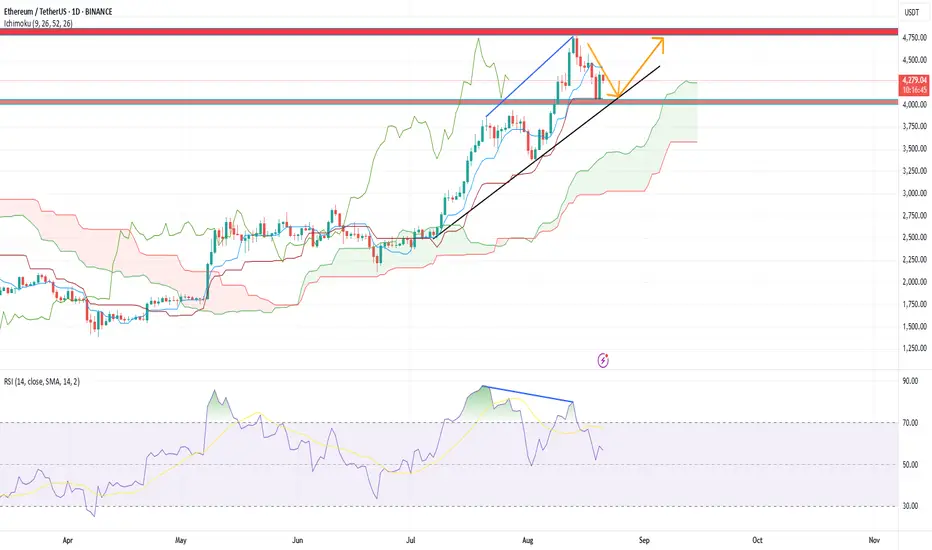
Ethereum 4H AnalysisBased on ichimoku data, the ethereum long-term trend is upward.
we are expecting new ATHs!
Resistence levels:
5249
5773
Support levels:
3500
3118
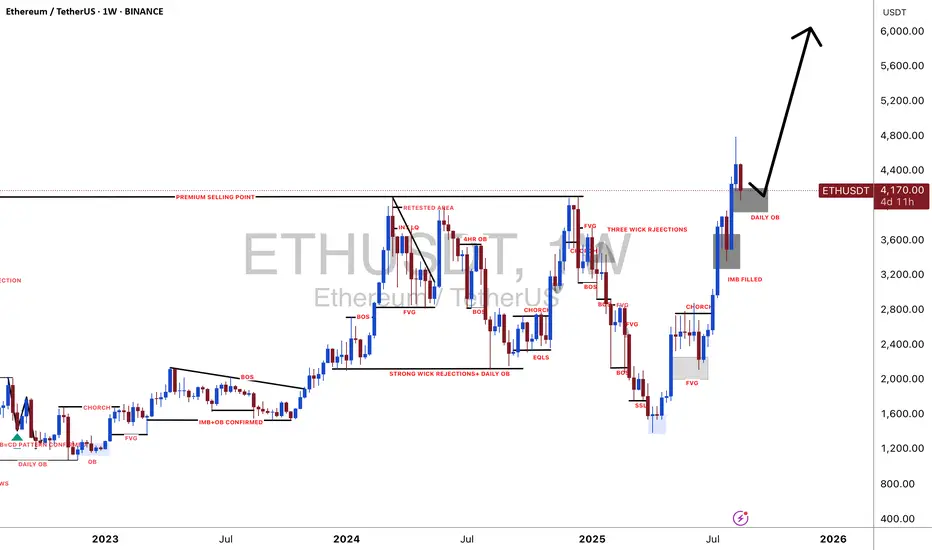
Ethereum's Bullish Market Conditions Intact —$11,111 NextNothing changes here. I am looking at the weekly timeframe and it seems Ether is ultra-bullish, it is literally growing above resistance.
The very insistent and annoying resistance from March 2024 was broken just last week. And as ETHUSDT trades above this level, it started to grow. This week is the first week above resistance and the chart looks great.
Things can change. But things can change. We can see multiple red candles show up and lower prices but this isn't what we have on the chart today. Right now we have strong bullish action, strong bullish candles, strong momentum, the break of resistance, the highest prices in four years and accumulating bullish volume. The chart doesn't point down rather it is saying "additional growth."
Ethereum will continue growing. Just think about it: One day ETHUSDT is trading at $1,500 and starts to go up. Four months later, ETH is trading at $5,000.
Thanks a lot for your continued support.
The next target is $6,000 to stop blank at $7,330 to continue rising until we go beyond $10,000, a price tag of $11,111 for this 2025/26 bull run. There is enough time in 2025 for ETH to produce a full bullish cycle. This chart doesn't need 2026. If it extends, better.
Namaste.

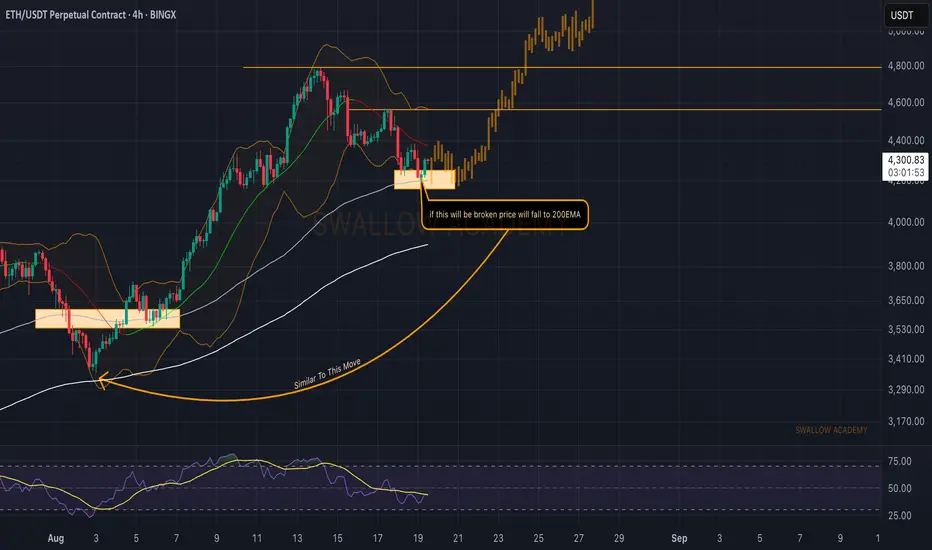
Ethereum (ETH): Getting Ready For Another Push | Moving AveragesOur attentions are fully on the EMAs currently, where ETH has reached the 100 EMA zone (which is also the lower zone of Bollinger Bands), giving us a solid support zone right there.
That said, we are looking for some sort of MSB to form from here, which should open for us an opportunity for a long or if we fail to get one, then our attentions shift to 200 EMA, where we will be expecting a similar thing.
Swallow Academy
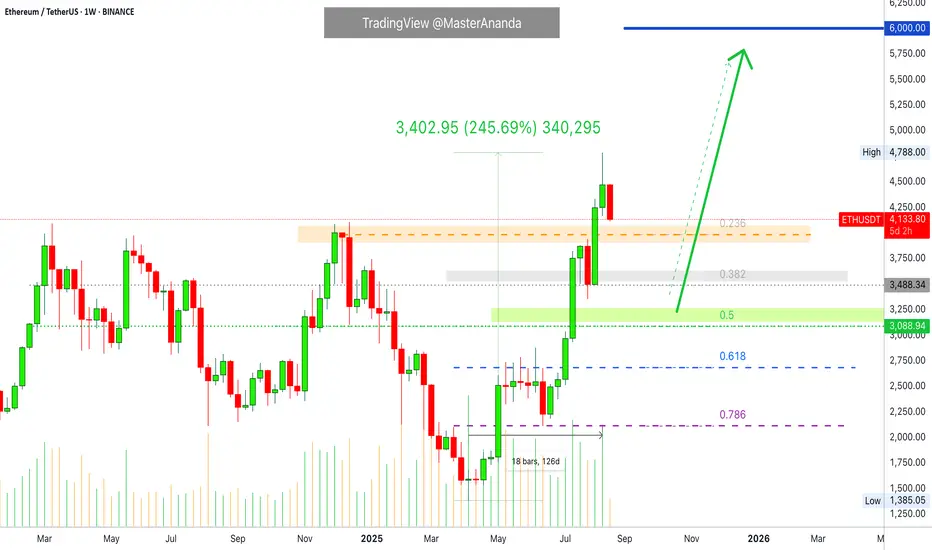
Ethereum: What About Support? $3,000 Next? Watch!Ethereum grew a massive 245% from its 7-April 2025 low and market bottom. The last low pre-2025 bull market. And we are here and this chart is awesome because there is no doubt where we are in this market cycle. We know the market is experiencing growth, Ether is growing, and we know this is only the start.
After strong growth, there is always a correction.
The market tends to seek balance.
ETHUSDT growing straight up for 126 days, four months. 245% total rise.
Where are the support levels?
A strong rise within a bull market is followed by: a mild correction or a strong correction? A long-term multiple months long correction or a two weeks long correction?
Let me help you answer those questions.
Four months will never allow for a correction lasting 3-4 months. This is out of the question. Normally a correction deletes only a portion of the previous move and it tends to last a portion of the previous move.
The equivalent to 0.618 and 0.786 was already consolidated back in May and June. This means that this level does not need to be tested or if it is tested, in an extreme case, then it is likely to hold. Why? Because Ether stopped at this point for more than a month creating a baseline.
The 0.236 Fib. retracement, around $3,900, was not consolidated so this level goes bust as support, on the first try. There wasn't any action around this level on the way up, there won't be any on the way down. So we know Ether to move lower on this drop.
The next level is 0.382 Fib. and this is a strong level. Retraces and corrections within a bull market can easily end here. This is a price of $3,485. There is support around this level as it was consolidated for two weeks before the last high. This level has potential to hold because Ethereum is very strong right now and this zone is below the March, May and December 2024 peaks.
The last level is the 0.5 Fib. retracement. This is another strong support and it tends to stop corrections on its track on a strong bull market. This level can be easily tested. If it is tested, the action isn't likely to last long at these low pries. We are talking about $3,100.
Again, the range between $2,100 and $2,700 is the 0.786-0.618 Fib. retracement and this is a dream buy zone right now and very unlikely that such an opportunity will open up. If it does open, this time, will you buy? Buy when prices are low. Sell at resistance, buy at support.
Ethereum is going down. It is still too early to say how long this correction will go for. Just keep in mind that a retrace can last 1-3 weeks while a correction can last 1-3 months. Both scenarios are possible. Regardless of what the market decides, the bull market is not over, we will see additional growth.
Ethereum will continue growing to hit a new all-time high and beyond.
Namaste.
Ethereum price correction will continue to around $4,000.After Ethereum hit the 4800 resistance level, we are witnessing a price correction. I think Ethereum can goes up again when it hit the Support level at around 4000$.
The season of Ethereum has arrived!
Do you know that Ethereum is currently the strongest coin in the market?
Even its targets and chart look stronger than Bitcoin’s.
Exactly 4 months ago, I posted an Ethereum analysis saying it had reached its lowest bottom, and at that time its price was exactly $2,180.
Take a look at the chart below.
Now my view is playing out, and Ethereum is only a few steps away from a new all-time high.
But did you know it’s still early, and you haven’t missed the opportunity yet?
Ethereum just broke a megaphone pattern on the weekly timeframe with a massive candle.
Even with all this upward movement, it only started breaking the pattern in the last couple of days, and it still has around 5% left to climb before hitting a new peak and entering price discovery mode.
And even with the crash that happened yesterday, it didn’t drop much and bounced back very quickly, as if it were just a normal day.
Overall, Ethereum will be in the 5-digit range—just like I told you exactly 4 months ago, when many didn’t believe it—and it will reach that by the end of the year. Remember my words, just like every time I’ve told you before.
Best Regards:
Ceciliones🎯

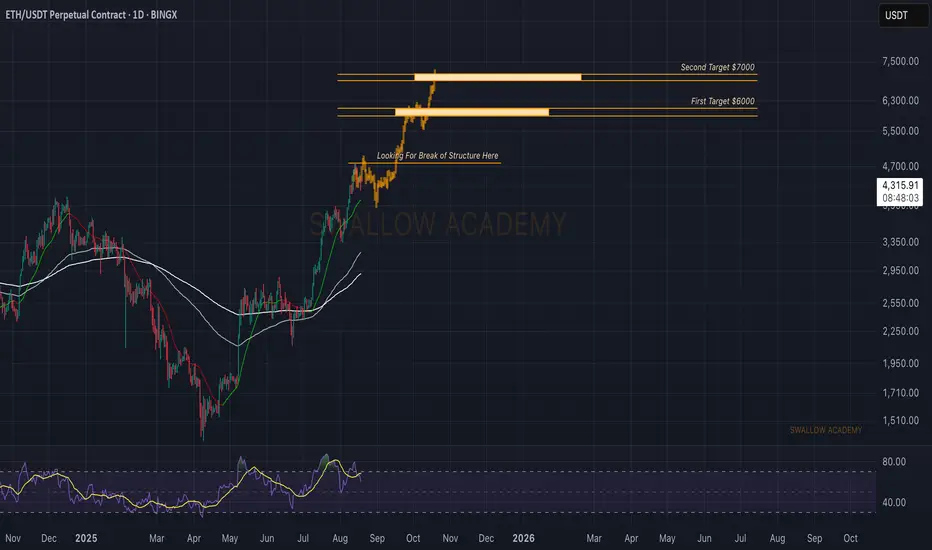
Ethereum (ETH): Looking for Break of Structure | $6000 | $7000ETH is on fire; with a recent break of local highs, the price has reached the ATH zone, where now we are looking for a sharp BOS to form, which would open for us the opportunity for a movement toward the $6000-$7000 range.
This is our current target for ETH, but we have to see that proper BOS before we can form the next ATH.
Swallow Academy
ETH what is next !This chart displays the weekly price action of Ethereum (ETH), which is currently retesting a key resistance zone around the $4,000 level. This area has acted as a major barrier since 2021, rejecting price multiple times and preventing further upside.
Now, ETH is once again approaching this critical level. If we can get a decisive breakout and a strong weekly close above $4,000, it could signal the beginning of a significant bullish move.
A confirmed breakout could open the door to a rally toward the previous all-time high near $4,860. If momentum continues, the Fibonacci extension points to a long-term target around $13,898 — the 1.618 extension level.
In summary:
👉 A breakout and close above $4,000 could mark the start of a strong bullish trend, with potential targets at $4,860 and $13,898.
Until that breakout is confirmed, though, we remain at a key resistance zone — so it's important to stay cautious.

Ethereum Elliott Wave Analysis: The Bull Trap Before Wave C!As mentioned in my previous two analyses, Ethereum rejected the $4,740 high and dropped to the $4,050 support zone, where it bounced exactly as projected.
From an Elliott Wave perspective, ETH has already completed a 5-wave impulsive structure and is now inside a corrective ABC phase. At the moment, price action is developing within wave B. Historically, wave B has the tendency to break above the top of wave ⑤, creating a bull trap and sweeping liquidity before the real wave C sell-off begins.
📉 What does this mean for traders?
Wave C is usually sharp, aggressive, and offers great risk-to-reward opportunities on the short side. But instead of rushing into shorts, the smart play is to wait for confirmation.
🎯 Trading Strategy:
1. Allow wave B to complete – watch for a liquidity grab above the $4,840–$4,800 zone.
2. Look for a CHoCH (Change of Character) / market structure break on lower timeframes (4H / 1H) as your entry trigger.
3. Enter short after confirmation, targeting the $4,100 → $3,800 zones first, with potential extension lower depending on momentum of wave C.
4. Place invalidation above the recent swing high to keep risk controlled.
⚡ This is a high-probability short setup forming, but patience and timing are crucial — don’t get trapped in wave B’s fake breakout.
👉 Follow for updates as we track the confirmation of wave C and refine the short targets!

Ethereum 7 Days Later · Retrace Or Correction?More information is available now that Ethereum has been retracing for seven days, we can start to make some predictions by analyzing how the token is currently behaving, for example; there isn't much on this chart other than high volume the day that ETHUSDT peaked, the other bearish signals are weak.
The drop is not strong. ETHUSDT is trading safely above EMA55. This move resembles what happened 11-June. A retrace.
On 11-June ETHUSDT peaked at $2,879 and started to retrace. 11 days later, 22-June, ETHUSDT bottomed at $2,111 and that's it, that was the retrace. The entire move was a 26.65% drop, I think we can see something similar.
28-July ETHUSDT peaked again but only briefly, there was a six days long retrace totaling -14.89%. The drop happened from $3,941 to $3,354 but then Ethereum just kept on growing as if nothing happened like before; it is possible to see something similar.
The strength of the current drop, after seven days of bearish action, seems weak. It can intensify in a flash and we see a market crash, but the same dynamics that are present with Bitcoin are also present here. A major crash or flush would only result in a prolonged recovery followed by higher prices.
Ether is likely to move lower but not much lower. Ether is likely to consolidate just to move higher. Ether is growing. Keep it simple.
Namaste.

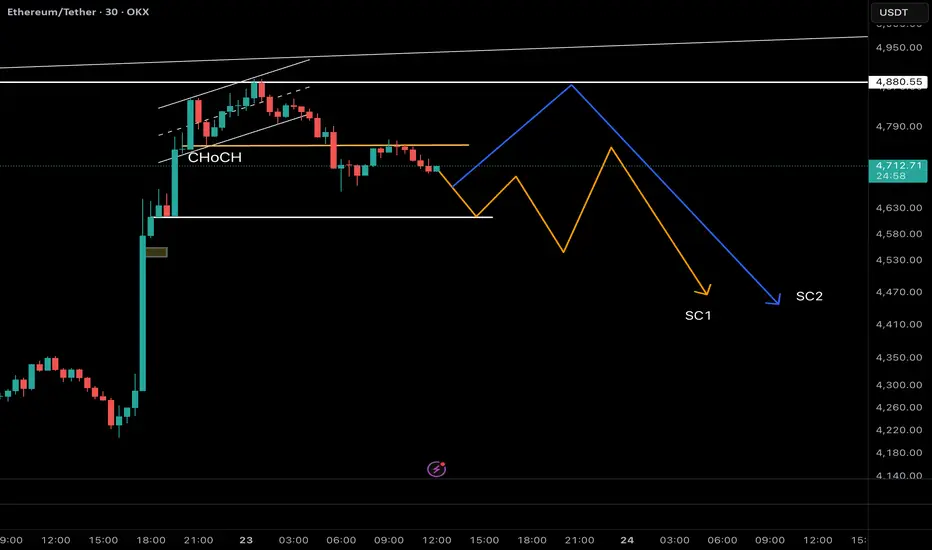
Ethereum Update: CHoCH Confirmed – Waiting for BOS & Wave C! As mentioned in my previous Ethereum analysis, ETH has completed its 5-wave impulsive rally and is currently inside wave B of a corrective ABC structure. Wave B often breaks above the wave ⑤ top to trap liquidity before a sharp wave C sell-off.
📊 Latest Price Action (30m TF):
• ETH has already shown a CHoCH by breaking the first key support at $4,753 and retesting it.
• The next crucial support lies at $4,613. If this level also breaks, it would confirm a BOS (Break of Structure) and strengthen the bearish case.
🔀 Two Possible Scenarios from Here:
1. Price retests the broken $4,753 level as resistance → then resumes the downtrend.
2. A deeper pullback toward $4,845 (acting as a left shoulder liquidity zone) → before the real wave C decline begins.
🎯 Trading Strategy:
• Wait for confirmation of BOS at $4,613.
• Once confirmed, look for bearish entry triggers (CHoCH / MSB) on lower timeframes.
• First targets: $4,100 → $3,800.
• Stop-loss invalidation above the swing high at $4,845 to maintain strict risk control.
⚠️ Remember: patience is key. Don’t get trapped in wave B’s fake breakouts — let the structure confirm wave C.
👉 Like & Follow to stay updated as we track ETH’s potential wave C move step by step!
Ethereum Hits a New All-Time High · $5790 Next Followed by $8513Ether is now on a path to a new all-time high and this week is hyper-bullish, as bullish as it gets.
Notice the lower wick on the current session; the week started negative and as it reaches its end, it turns positive. The action is happening at the top of the candle and this means we will see green Saturday, Sunday and for months to come.
The lack of bearish strength on the last retrace shows that sellers are simply not present.
The strong advance today and marketwide bullish action reveals a huge demand for crypto, so strong, that prices can only grow.
Ethereum (ETHUSDT) is now set to hit a new all-time high but that's not all. As I explained in a previous publication, the all-time high is not a major resistance level, it will break easily. This means that Ether will continue growing with the first target being $5,790 on the current move. $8,513 is also a high probability target later this year. We might go even higher.
The bullish bias is now fully confirmed. Ether is going up.
The cryptocurrency market will continue growing. The altcoins market will continue to heat up. This is only the start.
Namaste.

Ethereum (ETH): Buyers Took Control over 100EMA | Bullish SignsETH has entered the second stage of the upcoming bullish movement that we are expecting. Just like last time when we dipped below the EMAs, the price has reclaimed that zone back and now what we are looking for is a proper BOS to form near $4,370.
If we get that BOS there, then ETH will have a good bullish movement.
Swallow Academy

Ethereum Price Aims at $5,000 As Exchange Balance Falls To 9-YeaBINANCE:ETHUSDT is currently priced at $4,531 , positioned just above the $4,500 resistance. The broader indicators, suggest a favorable environment for a breakout. On-chain data highlights a key trend supporting Ethereum’s macro outlook.
Exchange balances have dropped to a nine-year low of 14.88 million BINANCE:ETHUSDT , signaling that investors are moving their holdings into long-term storage.
If BINANCE:ETHUSDT manages to reclaim $4,500 as support , the uptrend could accelerate. This move would help the cryptocurrency push through the next resistance at $4,749, paving the way for a test of the $5,000 mark.
However, risks remain if investor sentiment shifts suddenly. Should holders decide to secure profits, BINANCE:ETHUSDT could slide toward $4,200 or even $4,000 . Such a decline would weaken the bullish thesis, opening the door to consolidation instead of continuation of the current uptrend.

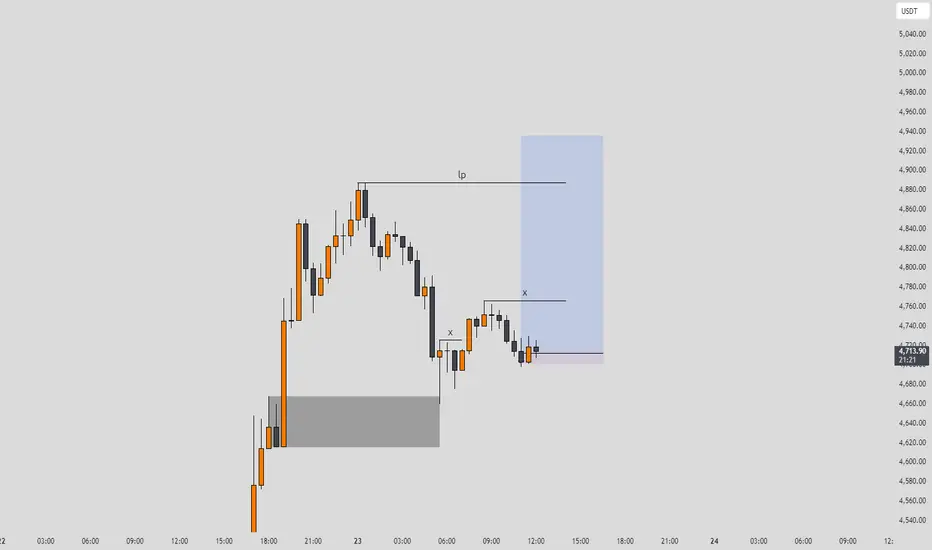
ETHUSDT - 20RR - simple setupETHUSDT - 20RR - simple setup, this il be my last trade setup, i will focus on community and analysis
Ethereum (ETH): Buy Zone Between 100-200EMAETH still struggles inside the EMAs, where we are looking for any signs of MSB to form in this region. Currently, the 100 EMA is being retested once again, whereupon seeing a breakout and buyside dominance above it, we might be getting a good buy entry right there.
The overall plan is simple: we want to see a major bounce happen in the zones of EMAs, which would lead the price to a new ATH.
Swallow Academy

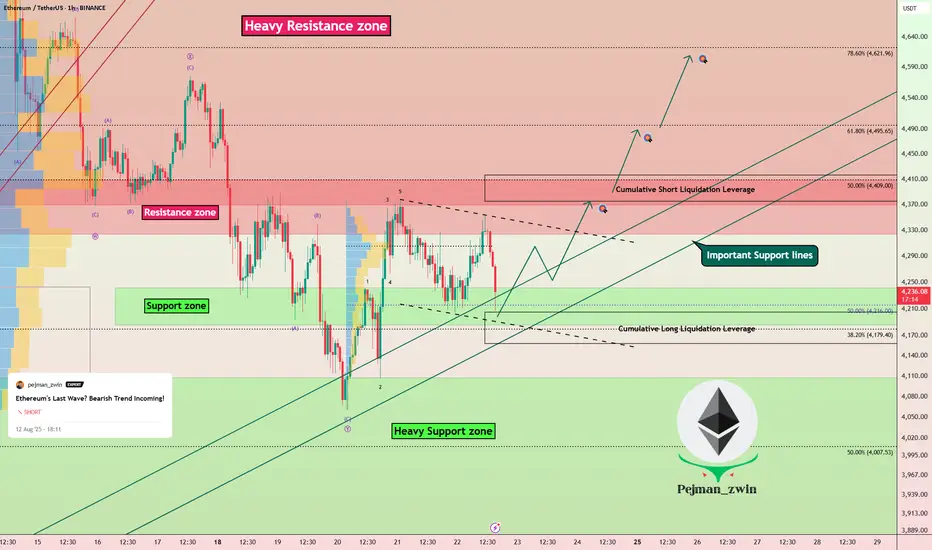
Ethereum's Last Wave? Bearish Trend Incoming!Ethereum ( BINANCE:ETHUSDT ) started to rise and pump as I expected in the previous idea .
Ethereum is currently trading in a Heavy Resistance zone($4,868(ATH)-$3,977) near the Potential Reversal Zone(PRZ) , Cumulative Short Liquidation Leverage($4,527-$4,452) , and the upper line of the ascending channel(potential) .
In terms of Elliott Wave theory , Ethereum appears to be completing microwave 5 of main wave 5 . Main wave 5 could complete at the Potential Reversal Zone(PRZ) .
Also, we can see the Regular Divergence(RD-) between Consecutive Peaks .
Before any conclusions, let's take a look at the ETHBTC ( BINANCE:ETHBTC ) chart.
ETHBTC also indicates the end of the uptrend, and if the market falls , we can expect ETH and the tokens on the Ethereum blockchain to undergo a correction this time.
I expect Ethereum to bearish trend in the coming days and at least close the CME Gap($4,185-$4,080) .
One of the tokens that we can use for short positions alongside Ethereum is the ENS token ( BINANCE:ENSUSDT ). ENS is the decentralized naming system built directly on the Ethereum blockchain, simplifying crypto addresses into human-readable names .
Cumulative Long Liquidation Leverage: $4,145-$4,094
CME Gap: $3,461-$3,417
Note: Stop Loss: $4,780
Do you think Ethereum will create a new All-Time High(ATH) soon, or should we wait for a correction?
Please respect each other's ideas and express them politely if you agree or disagree.
Ethereum Analyze (ETHUSDT), 4-hour time frame.
Be sure to follow the updated ideas.
Do not forget to put a Stop loss for your positions (For every position you want to open).
Please follow your strategy and updates; this is just my Idea, and I will gladly see your ideas in this post.
Please do not forget the ✅' like '✅ button 🙏😊 & Share it with your friends; thanks, and Trade safe.

Scalping in narrow Eth/usdt trendlineAfter liquidity taken below, waiting price go to 4330 range, breakout seems low key scenario. After price test will open short to 4200-4100 range where liquidation sqeeze looks very possible. Any thoughts?