Altcoins and Altseason:How to Understand and Use Them in Trading
The cryptocurrency market has long moved beyond Bitcoin’s monopoly. Today, it consists of thousands of digital assets, each with its own technology, goals, and economic model. Among traders, two terms are frequently used — “altcoin” and “altseason,” and understanding them is essential for anyone aiming to earn consistently in crypto.
An altcoin is any cryptocurrency other than Bitcoin. The first alternative coins appeared in 2011, when developers sought to improve BTC by offering faster transactions, new algorithms, or additional features. Today, some of the most well-known altcoins include:
Ethereum (ETH) — the leader in smart contracts and decentralized applications.
Ripple (XRP) — focused on fast international transfers.
Cardano (ADA) — known for its scientific approach and energy efficiency.
Solana (SOL) — prioritizes ultra-fast transaction speeds.
Polygon (MATIC) — tackles blockchain scalability issues.
Altseason refers to a period when altcoins become the main growth drivers of the market, outperforming Bitcoin in both speed and volume of price gains. During this time, investors often take profits from BTC and move capital into other projects. As Bitcoin’s dominance declines, space opens up for alternative coins to rally. In such phases, traders shift their attention to promising technologies and big news stories, with many altcoin charts showing growth that far exceeds that of Bitcoin.
For a trader, altseason is not just a flashy market phase — it’s a period of maximum opportunity. With the right analysis, it can deliver returns that are hard to achieve during normal market conditions. However, the potential for high profit also comes with high risk. The altcoin market is known for sharp volatility, and choosing the wrong asset can result in losses just as significant as potential gains.
That’s why it’s crucial not only to understand what altcoins and altseason are but also to recognize them in time. This requires a combination of fundamental and technical analysis, tracking Bitcoin dominance trends, and using reliable trading tools that can spot shifts in market cycles. With a thoughtful approach, altseason can become the window of opportunity that opens the door to new results in trading.
ETHUSDT trade ideas
ETH update 9.06.2025Hello everyone, many of you asked me to publish my vision for ETH.
Here you go!
I believe that the previous impulse movement was only the first upward movement, and now we are in a sideways correction movement — call it what you will, but the fact is that the exit from this flat will be upward.
1. End of the year
2. ETH is accumulating on the Onchain
3. Liquidity overflow from BTC can be seen on the ETHBTC chart, and the overflow began at the very bottom
4. What else can large conservative players accumulate?
5. We are going after liquidity from above and should break 4100 by September
Best Regards EXCAVO


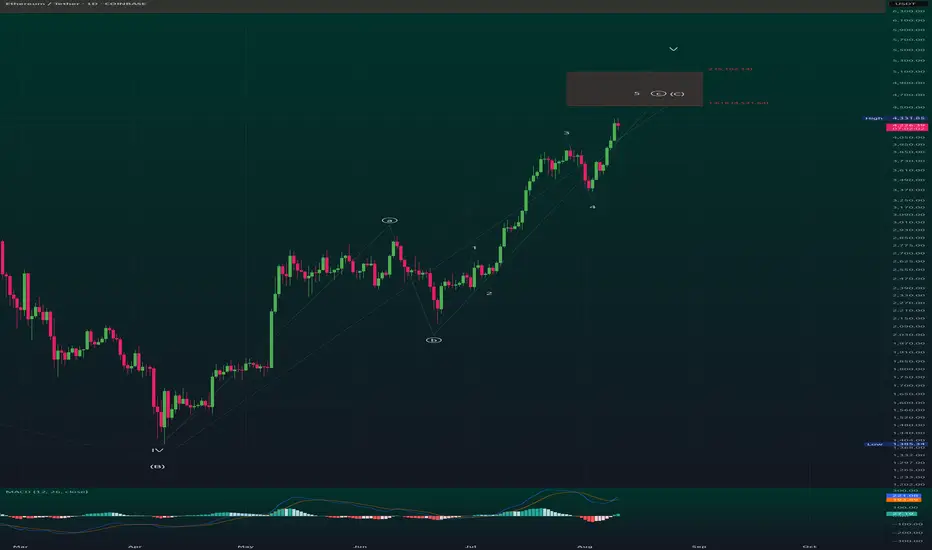
ETH/USD – Multi-Degree Terminal Advance: Daily ⑤ of CETH/USDT – Multi-Degree Terminal Advance: Daily Wave ⑤ of C Inside Weekly Wave C (Ending Diagonal)
1️⃣ Higher-Timeframe Context (Weekly)
ETH has been unfolding a large corrective A-B-C structure from the all-time high.
The current rally is Wave C of that correction.
Structural note: On the weekly, Wave 4 overlaps Wave 1 → violates standard impulse rules → the entire Wave C is taking the form of an Ending Diagonal.
Why this matters:
Ending diagonals appear in terminal positions (Wave 5 of an impulse or Wave C of a correction).
They often end with a throw-over above the upper trendline, followed by sharp and deep reversals.
2️⃣ Intermediate-Timeframe Context (Daily)
On the daily, we are in:
Wave ⑤ of daily Wave C.
That daily Wave C is also the final leg of weekly Wave C.
Implication:
Two degrees (daily & weekly) are scheduled to terminate together → high-probability major turning point.
3️⃣ Structure & Internal Wave Count
From the IV(B) low in April, ETH has advanced in five overlapping sub-waves:
Wave 1 – steady breakout leg.
Wave 2 – shallow pullback.
Wave 3 – strongest rally to date.
Wave 4 – pullback overlapping Wave 1 territory → confirms diagonal.
Wave 5 – ongoing final push into target zone.
Internals of each wave show a-b-c formations, consistent with diagonal rules.
4️⃣ Fibonacci Target Confluence
Anchor: IV(B) low → Wave 3 high → Wave 4 low
1.618 extension: $4,531 → first resistance.
2.000 extension: $5,102 → primary target.
Upper wedge projection / throw-over: $5,500–$5,650.
These levels also align with weekly fib projections for Wave C → creating a multi-timeframe resistance cluster.
5️⃣ Momentum & Divergence
MACD (Daily): Histogram making lower highs while price makes higher highs → early bearish divergence.
RSI (Daily & Weekly): Approaching overbought with flattening momentum → consistent with terminal phases.
Volume: Gradual contraction during the advance; watch for final spike on throw-over.
6️⃣ Scenarios
A) Terminal Top Scenario (Base Case)
Price completes Wave ⑤ of C inside the $4,531–$5,102 box.
Possible throw-over into $5,500–$5,650 on ETF hype.
Followed by swift rejection back inside wedge → break of Wave-4 low confirms top.
Targets after confirmation:
First: Wedge base / 0.382 retrace (~$3,800).
Next: 0.5 retrace (~$3,500).
Extended: Origin of diagonal (~$2,900).
B) ETF Extension Scenario
Price consolidates above $5,100 and pushes toward $5,500–$5,650.
Still part of Wave ⑤, just a stretched terminal before reversal.
Same confirmation rules: break of Wave-4 low validates reversal.
7️⃣ Invalidation & Risk Levels
Bearish invalidation: Break of Wave-4 low = high-probability top.
Bullish invalidation: Sustained breakout + consolidation above $5,650 would require re-evaluating the diagonal scenario.
8️⃣ Trade Plan (Non-Advice)
Aggressive fade: Short into $4,531–$5,102, add near $5,500–$5,650 if reached, stop above wedge throw-over.
Conservative: Wait for daily close back inside wedge and break of Wave-4 low, then short pullbacks.
Positioning note: Size down in diagonals — volatility spikes at turns.
9️⃣ Key Chart Annotations for Publishing
Wedge trendlines from Wave-II(B) low to Wave-IV(B) low.
Label 1–2–3–4–5 (with a-b-c internals) on daily.
Highlight $4,531, $5,102, and $5,500–$5,650 zones.
Mark Wave-4 low and wedge base with "Top Confirmed Below Here".
Add MACD/RSI divergence notes in top-right.
📌 Summary
ETH is in the final stages of a multi-degree ending diagonal:
Daily Wave ⑤ of C inside Weekly Wave C.
Both degrees likely terminate in $4,531–$5,102, with throw-over potential to $5,500–$5,650.
Once confirmed, expect a fast, deep retrace — this is a terminal pattern with macro top potential.
ETHUSDT – TECHNICAL BUY CALL | 10 AUGUST 2025 ETHUSDT – TECHNICAL BUY CALL | 10 AUGUST 2025
The coin has been moving in an uptrend marked with a light blue color channel. Although it recently broke down from this channel, it has sustained itself and formed a double bottom pattern. We expect the coin to test the recent swing high and achieve multiple bullish targets before any change in trend direction.

Eth I also changed my mind about Ethereum. Let's see what happens. Does the math work out? Let's go see.

ETHUSDTEthereum will definitely return from this price range to the target of $4000, the price range is the price retracement ($1428-$1125-$802).

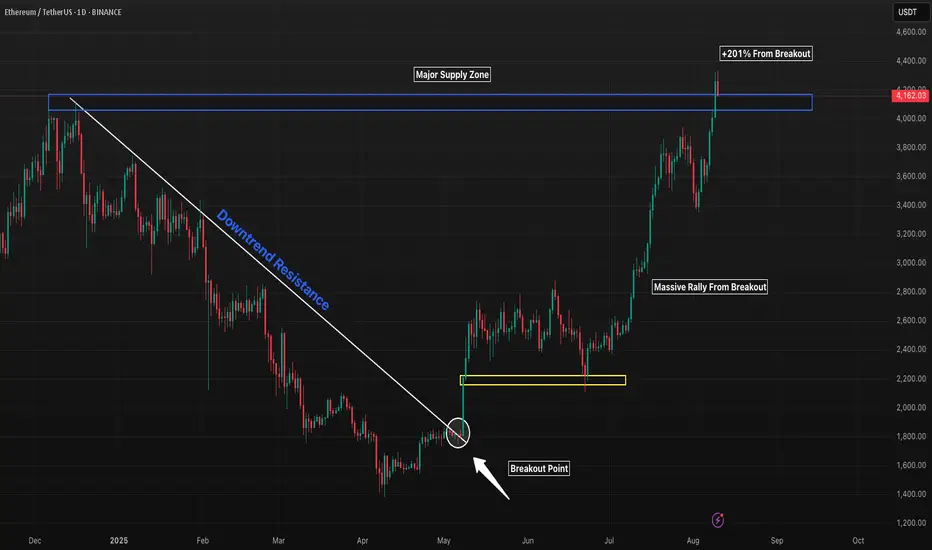
ETH 1D Breakout Returns Price to December HighsEthereum broke a long-term downtrend in May, retested the breakout zone, and launched into a powerful rally that has now brought price back to the December 2024 high supply zone. This area is a key decision point — a clean breakout could lead to new highs, while rejection here may trigger the first real pullback since the rally began.
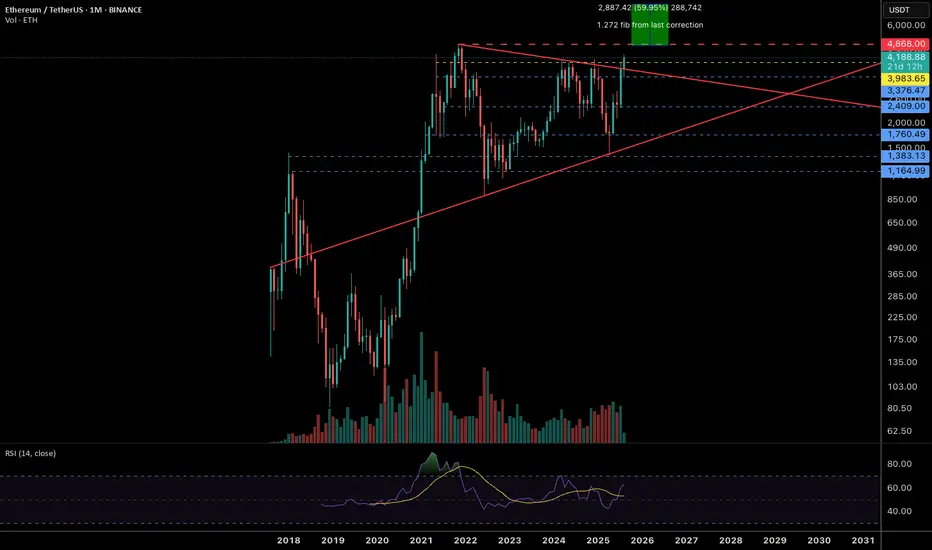
ETH/USDT Monthly ChartJust another learning experience. Thinking ETH hits the fib 1.272 spot from the correction once it clears ATH.
ETHEREUM USDT THE BREAK of KEY SUPPLY ROOF on daily will be watched and i hope that a retest to a broken supply roof holds firmly and i expect buyers to keep the buy energy into 4999-5000k based on the current structure.
#ethusdt #ethereum

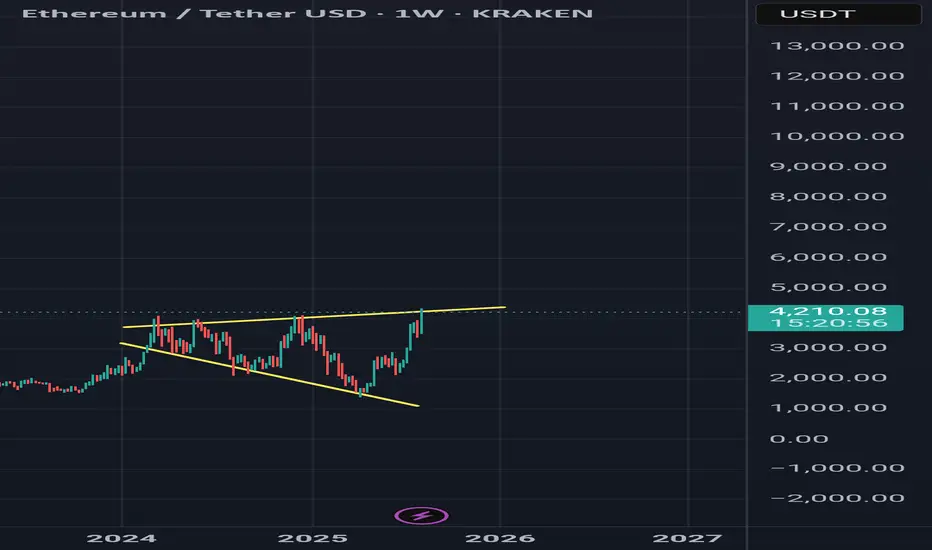
ETH/USDT Update. ETH/USDT weekly chart with those yellow trend lines forming what looks like a long-term ascending triangle / resistance ceiling just under the $4,300–$4,400.
---
1. Big Picture
The top yellow line is a multi-year resistance connecting the Nov 2021 and Mar 2022 highs.
ETH is right at that line now — this is where historically heavy selling pressure has appeared.
If ETH closes a weekly candle above $4,400 with strong volume, that’s a confirmed breakout of a 3-year structure.
---
2. Breakout Scenario
If we get a breakout:
Measured move from the base of the triangle (~$880 low to $4,400 resistance) = ~$3,520 height.
Add that to the breakout zone (~$4,400) → Target $7,900–$8,000 over months (not days).
First resistance after breakout: $4,870 (Fibonacci 2.0 extension & historical supply).
---
3. Rejection Scenario
If rejection happens here:
Possible pullback to $3,760–$3,820 (weekly demand / order block).
Deeper correction could target $3,130 if BTC also cools off.
---
4. Smart Money View
This is a high-liquidity zone — institutions & whales often engineer fake breakouts here to trap longs.
A weekly candle wick above $4,400 but close below could be a bull trap.
---
⚠️ Key takeaway:
Above $4,400 weekly close = bullish continuation → long-term $6.5k–$8k targets.
Fail to break $4,400 = short-term correction back toward $3.8k or lower.
Watch BTC at the same time — ETH almost never breaks multi-year highs alone.
ETHEREUM THE DAILY KEY DESCENDING TRENDLINE HAS BEEN BROKEN,ethusdt is seeing buying momentum and if they keep this pace ,the trend could hit all time retest and a possible breakout.
#ethereum #ethusdt #cryto

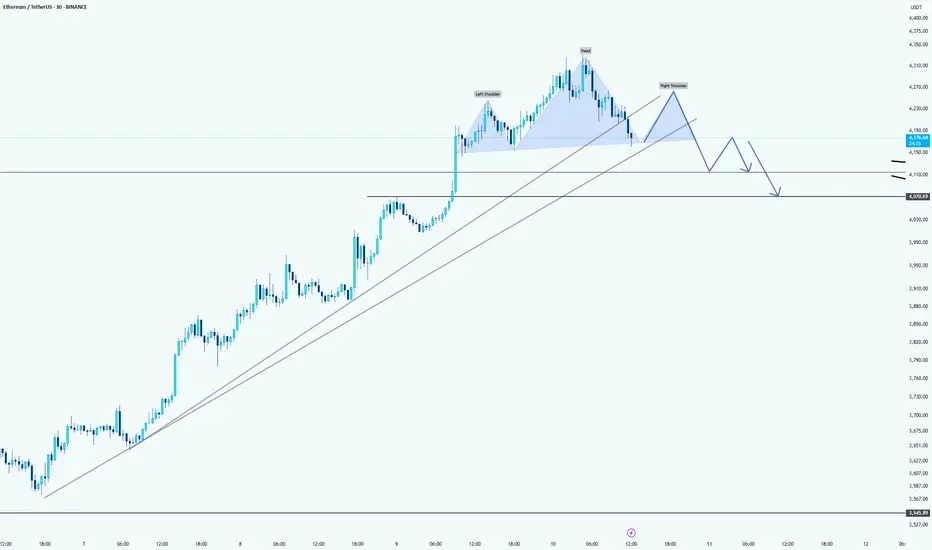
Ethereum: just a little bit correction hereHello guys!
Chart Pattern: Head and Shoulders
The chart shows a Head and Shoulders pattern forming on the Ethereum price action. The trendline drawn across the neckline of the pattern is a crucial support level to monitor.
Potential Breakdown:
If Ethereum fails to hold above the neckline (around $4,130), we might see a pullback and potentially a breakdown from the pattern. This suggests a bearish outlook for ETH in the short term.
Target:
A possible target for this bearish move could be around th e $4,050 - $4,100 range , where the price could find support from the upward trendline (in light gray). The price may retrace towards these levels before deciding whether it will continue higher or confirm further downside.
Uptrend Support:
Ethereum remains in an overall uptrend, as indicated by the sloping upward trendline beneath the price action. If the price pulls back to this trendline and holds, there could still be bullish potential.
$ETH - Secondary Upthrust CRYPTOCAP:ETH | 2h
Possible LTF setup:
- Bounce around 4.1k–4k
- Initial supply retest at 4.2k–4.3k
- Retrace at 4.1k
- Secondary upthrust towards 4.4k–4.5k
local support 4k - holds for bullish continuation
Break below - likely test of 3.8k–3.7k

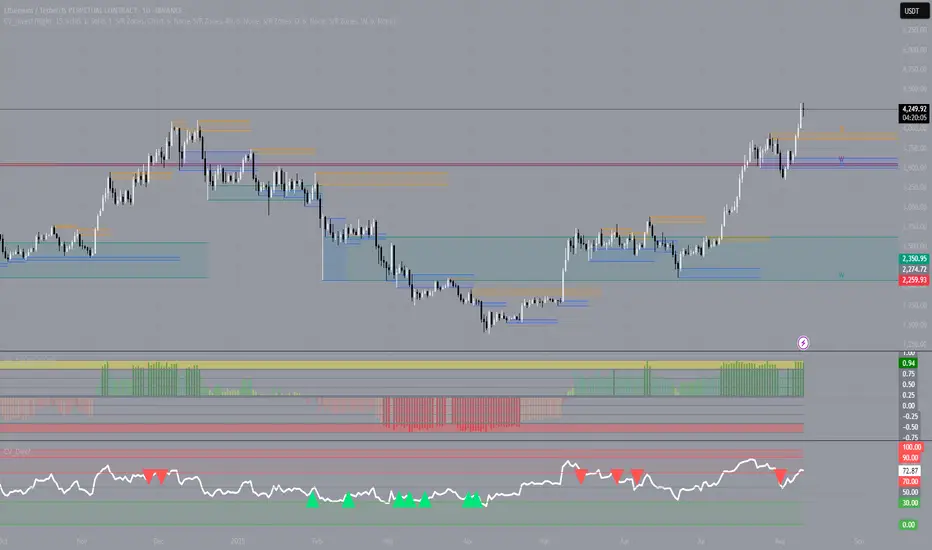
Let the show begin! ETHThe old saying never fails: tops are for selling!
Today, ETH gave us a textbook example of what happens when FOMO (Fear of Missing Out) takes over the market… lots of traders buying at the peak, thinking “this is it!”, but the basics still work: prices go up, exhaust, and then… dump.
In my last attempt, I traded hedged — I was long on ETH and sold the derivative to protect my portfolio. Now, I’ve closed all my longs and, with a clear flow signal + heavy FOMO kicking in, I’m going short.
📊 Flow, CVD, and Open Interest are showing that selling pressure is building up. Time to leave greed aside and trade with your head, not your heart.
Good luck everyone!
📉 Remember: discipline > emotion.
--
💥 Que comece o show! 💥
O velho ditado nunca falha: topo se vende!
Hoje, o ETH mostrou o que acontece quando o FOMO (medo de ficar de fora) toma conta do mercado… muita gente comprando no pico, acreditando que "agora vai", mas o básico continua funcionando: preços sobem, esgotam, e depois… despejam.
Na minha última tentativa, operei hedgeado — estava comprado no ETH e vendi o derivativo para proteger minha carteira. Agora, zerei todas as compras e, com o sinal claro de fluxo + o FOMO batendo forte, estou entrando vendido.
📊 Fluxo, CVD e Open Interest mostram que a pressão de venda está ganhando força. É hora de deixar a ganância de lado e operar com a cabeça, não com o coração.
Boa sorte a todos!
📉 Lembrem-se: disciplina > emoção.

The key is whether the price can hold above 3900.73-4107.80
Hello, fellow traders!
Follow us to get the latest information quickly.
Have a great day.
-------------------------------------
(ETHUSDT 1D chart)
This period of volatility is expected to last from around August 6th to 14th (maximum from August 5th to 15th).
The key question is whether the price can find support and rise above the 3900.73-4107.80 range after this period of volatility.
The next period of volatility is expected to occur around August 28th, so we need to see if the price can hold until then.
If the price declines, we need to check for support around the HA-High ~ DOM (60) range of 3708.87-3762.33.
If not, there's a chance it could fall below 3265.0-3321.30.
-
(1M Chart)
The TC (Trend Check) indicator has risen above 0, suggesting a high possibility of further upside.
Therefore, the key point to watch is whether it can rise above the 4630.26-4868.0 range.
For an uptrend to continue,
- The StochRSI indicator must remain upward with K > D.
(If possible, it's best to avoid K entering the overbought zone.)
- The On-Board Volume (OBV) indicator of the Low Line ~ High Line channel must remain upward.
(If possible, it's best to maintain OBV > OBVEMA.)
- The TC (Trend Check) indicator must remain upward.
(If possible, it should remain above 0.)
If the above conditions are met, the uptrend is likely to continue.
To sustain an uptrend by breaking above key support and resistance levels,
- The StochRSI indicator must remain below the overbought zone and remain above D.
- The On-Board Volume (OBV) indicator of the Low Line ~ High Line channel must rise above the High Line and remain upward.
- The TC (Trend Check) indicator must remain upward. (If possible, it should remain above the 0 point.)
When the above conditions are met, there is a high probability that the price will rise after breaking above important support and resistance levels.
-
Thank you for reading to the end.
I wish you successful trading.
--------------------------------------------------
- Here's an explanation of the big picture.
(3-year bull market, 1-year bear market pattern)
I will explain more in detail when the bear market begins.
------------------------------------------------------

$ETH Breaks Confluence Barrier — Next Stop ATH? CRYPTOCAP:ETH has broken above a major confluence zone, where long-term resistance and trendline pressure have been holding price back. This breakout signals renewed bullish momentum and opens the door for a potential push toward the previous all-time highs.
The strong demand zone below continues to act as a solid foundation, and RSI momentum suggests buyers are still in control. As long as ETH holds above this breakout level, the bullish outlook remains intact.

ETHUSDT 12H chart uptrend1. Breaking out of the downward channel
• Black lines show an earlier inheritance channel.
• The course struck the mountain and it is quite dynamically, which is a strong upward signal.
2. Current price
• ETH is around USD 4,274, just below the resistance at USD 4,304.
• Another resistance is 4,484 USD (potential target if the upward trend persists).
3. Support
• The next support: 4,048 USD - if the course is corrected, then there may be the first "test".
• stronger support below: USD 3,930, $ 3,709, $ 3,487.
4. Indicators
• MacD: MacD line strongly above the signal, the histogram is growing - confirms the upward trend.
• RSI: around 75 - close to the purchase zone, which can mean a short -term correction, but with a strong RSI trend can stay high for a long time.
5. Scenarios
• Bull: Punction and maintenance above USD 4,304 can open the road to 4,484 USD and possibly higher.
• Bear: rejection from USD 4,304 and a descent below 4,048 USD may cause a deeper correction in the direction of $ 3,930 or even $ 3,709.
📌 The short -term market is warmed up, so a small pullback is possible, but the structure looks very bullshit after this burst from the downward channel.

ETH Bearish DivergenceBINANCE:ETHUSDT
Trade Setup:
Target 1: 4,077.09 (0.786 Fibonnaci Golden Zone).
Target 2: 3,922.91 (0.618 Fibonnaci Golden Zone).
Target 3: 3,814.61 (0.5 Fibonnaci Golden Zone).
Target 4: 3,355.71 (0 Fibonnaci).
DCA : 4,397.40 (1.135 Fibonacci)
Stop Loss: 4,523.14 (1.272 Fibonacci).
RSI Analysis: The RSI is showing a bearish divergence, suggesting potential bearish momentum. The current RSI is around 81.56, approaching oversold territory, so caution is advised.

ETH is ready to Drop Sharply Now it time to Short ETH, a big drop is going to start .
Fasten your seatbelt

Ethereum Holds Above $4,000: The Start of a New Altcoin Rally?Ethereum (ETH), the largest altcoin by market capitalization, has become the main driver of the current cryptocurrency market surge. Amid Bitcoin dominance falling below its two-year trendline and capital flowing into altcoins, ETH has posted an impressive 20% weekly gain.
After a strong rebound from the $3,354 support level, ETH broke through the key psychological barrier of $4,000, reaching a local high at $4,206. This move has become a clear signal not only for investors but also for traders, who see it as confirmation of a new bullish momentum.
📈 Technical Overview:
ETH broke above its 50-day SMA and consolidated there, strengthening buyers’ positions.
Trading volumes on both spot and derivatives markets increased by 18% compared to the previous week.
RSI and MACD indicators show a growing trend with no signs of overbought conditions.
Bitcoin dominance dropping from 66% to 60% in just two months suggests a capital rotation toward altcoins, with Ethereum—being the sector’s flagship—benefiting the most from this shift.
🚀 What’s Next?
If Ethereum holds the $4,000–$4,050 range as support, the next technical target lies in the $4,450–$4,600 zone. The strengthening trend in the ETH/BTC pair also points to further potential growth, even if Bitcoin moves sideways.
The market is already calling this the beginning of the 2025 Altcoin Season, and Ethereum appears set to be its leading locomotive.

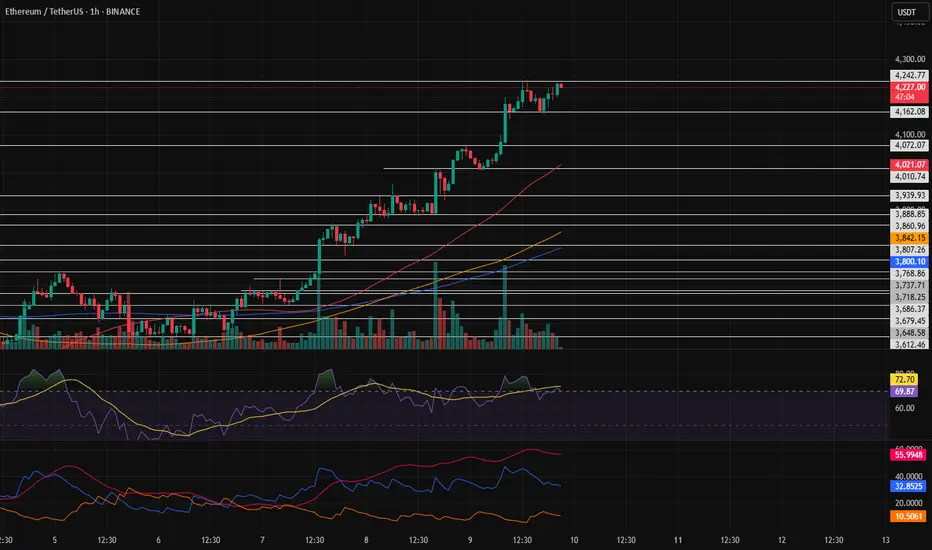
Rest in the uptrend?In my opinion, after this strong and prolonged rally, the price needs a rest before moving higher. My view and analysis are that the price could rest around the 4,072.07 area, where it can then decide whether to move higher and set a new all-time high or take a deeper rest.