Clean Setup Completed After our previous analysis hit the target, the price has now reached a key decision zone — whether it wants to move higher or not.
At this point, we need to wait and see how the market decides, and then react accordingly.
ETHUSDT trade ideas

ETH 4H – Demand Ladder Holding Strong, Bullish Set Up?Ethereum has been climbing a ladder of demand zones on the 4H chart — with each major impulse followed by consolidation and a successful retest of prior support. This current pullback has once again tapped into a reclaimed demand area near $3,400–$3,500.
So far, every past structure has acted as a springboard for the next leg up — a pattern that’s held since April.
📊 Key insights:
– Multiple confirmed demand zones stacking higher
– Prior demand flips to support after each breakout
– Most recent pullback held structure with Stoch RSI bouncing from oversold
– Structure and momentum suggest potential continuation if $3,400 holds
A breakdown of this final zone could invalidate the staircase, but until then, structure favors the bulls.
Is ETH gearing up for $4,000+ or finally losing steam?
Drop your thoughts in the comments.

Weekly trading plan for EthereumLast week, BINANCE:ETHUSDT mirrored Bitcoin's moves, hitting all three of our targets. While we're seeing strong recovery now, the overbought RSI suggests a pullback may be coming soon.
Key Takeaways:
Recent longs opened yesterday during the trend shift → Consider managing risk
Better re-entry post-correction than sitting through volatility
Last week's pullback was shallow → Downward continuation remains possible
Markets reward patience - don't force trades in overbought zones

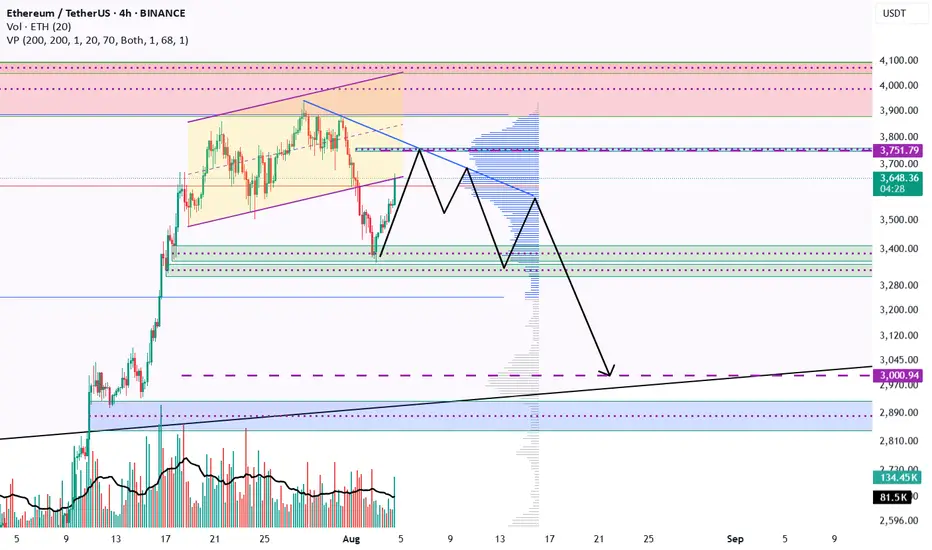
Ethereum Technical Update: $3,750 Target with $3,000 Correction Ethereum could rise to $3,750, and the correction may continue down to $3,000 by the end of August.
The bull market here will continue if the price break 4K$ As we can see on chart two major resistances which are reason of killing BINANCE:ETHUSDT each time are the red trendline and also the 4K$ resistance zone and soon i believe ETH now has the power to break this resistances and start new high volume pump the targets like 5000$ and new ATH.
DISCLAIMER: ((trade based on your own decision))
<<press like👍 if you enjoy💚

ConsenSys: Powering the Future of Cryptocurrency InfrastructureCryptocurrency ecosystem is actively maturing and investors are increasingly drawn to infrastructure providers that underpin the decentralized economy. Consensys is a leading blockchain software company, stands out with its flagship MetaMask wallet and a suite of Ethereum-focused solutions. With a robust business model and global adoption, Consensys offers a pretty interesting case for those, who are eyeing the backbone of Web3.
MetaMask: The Leading Crypto Wallet
Consensys’s flagship product, MetaMask, is one of the most widely used cryptocurrency wallets globally, competing closely with Trust Wallet for market dominance. Unlike centralized exchange storage, MetaMask is a decentralized, self-custodial wallet—essentially software that allows users to manage digital assets independently. With an estimated 30 million monthly active users, MetaMask facilitates billions in transactions, verifiable on the Ethereum blockchain.
MetaMask generates revenue through a 0.875% fee on token swaps, contributing to a reported $60 million in net profit for 2024. Its user base is spread across various markets, including Nigeria, Indonesia, the United States, South Korea, and Germany. In regions like Nigeria, where banking systems charge high fees, MetaMask transforms cash flow by enabling low-cost transactions. In developed markets like the U.S. and Germany, it serves as a gateway for asset storage and decentralized app (dApp) interactions.
A key growth catalyst for MetaMask is the potential launch of its own governance token. Unlike competitors Trust Wallet and Gnosis, MetaMask lacks a native token, which could streamline transactions and boost revenue by reducing reliance on third-party staking providers. Market speculation suggests a token launch could enhance MetaMask’s valuation and make it by this a hot topic for discussions.
Infura: Ethereum’s Infrastructure Backbone
Beyond MetaMask, Consensys’s Infura provides critical infrastructure for Ethereum COINBASE:ETHUSD , the world’s second-largest blockchain. Infura’s API services enable developers to build and scale dApps without running their own nodes, supporting over 430,000 developers and processing transactions worth over $1 trillion annually. Infrastructure is integral to Ethereum’s ecosystem, powering everything from DeFi platforms to NFT marketplaces.
Infura’s revenue model, based on usage fees ($40–$50 per 200,000 API requests), capitalizes on Ethereum’s growth. As transaction volumes rise—up 83% since 2017—Infura’s role as a reliable backend for MetaMask and other dApps positions it as a critical part of Consensys’s business.
Sharplink: Smart Contracts for Enterprises
Consensys’s Sharplink division develops software for smart contracts, serving high-profile clients like Ernst & Young , Airbus EURONEXT:AIR , JPMorgan NYSE:JPM , Microsoft NASDAQ:MSFT , and Amazon $NASDAQ:AMZN. Solutions enable secure and automated agreements on Ethereum, with applications ranging from supply chain management to digital identity. Central banks in countries like Norway and Israel are also exploring Sharplink’s technology for digital currency initiatives.
Staking and Asset Management
Consensys owns approximately $500 million in Ethereum and other cryptocurrencies, generating income from staking and other revenue-generating operations, thereby complementing the company's software offerings, ensuring financial stability, and providing access to the growth of the cryptocurrency market.
Why Consensys Stands Out
Lets take Kraken or Bybit, for example. Their reported trading volumes are quite difficult to verify, but at the same time, Consensys' decentralized products provide transparency. Every MetaMask transaction and Infura API call is recorded on Ethereum’s public ledger, allowing investors to validate activity. Such openness mitigates the exaggeration common in crypto, where claims of user bases or turnovers can be inflated.
Consensys’s diversified portfolio—spanning wallets, infrastructure, smart contracts, and staking, as we told before—reduces reliance on any single revenue source. Its global reach, from emerging markets like Nigeria to tech hubs like the U.S., further de-risks its business model. Major investors, including BlackRock, JPMorgan, and Microsoft, have already backed Consensys, signaling that way confidence in its long-term potential.
The Road Ahead
Founded by Ethereum co-founder Joseph Lubin, Consensys has raised $1 billion to date, with a reported valuation target of $7 billion for a potential IPO. While the timeline for going public remains uncertain, the company’s focus on Ethereum’s ecosystem positions it to benefit from Web3’s expansion. Challenges, such as regulatory scrutiny and competition from wallets like Trust Wallet or blockchains like Solana, exist, but Consensys’s entrenched role in Ethereum gives it a competitive edge.Cryptocurrency ecosystem is actively maturing and investors are increasingly drawn to infrastructure providers that underpin the decentralized economy. Consensys is a leading blockchain software company, stands out with its flagship MetaMask wallet and a suite of Ethereum-focused solutions. With a robust business model and global adoption, Consensys offers a pretty interesting case for those, who are eyeing the backbone of Web3.
MetaMask: The Leading Crypto Wallet
Consensys’s flagship product, MetaMask, is one of the most widely used cryptocurrency wallets globally, competing closely with Trust Wallet for market dominance. Unlike centralized exchange storage, MetaMask is a decentralized, self-custodial wallet—essentially software that allows users to manage digital assets independently. With an estimated 30 million monthly active users, MetaMask facilitates billions in transactions, verifiable on the Ethereum blockchain.
MetaMask generates revenue through a 0.875% fee on token swaps, contributing to a reported $60 million in net profit for 2024. Its user base is spread across various markets, including Nigeria, Indonesia, the United States, South Korea, and Germany. In regions like Nigeria, where banking systems charge high fees, MetaMask transforms cash flow by enabling low-cost transactions. In developed markets like the U.S. and Germany, it serves as a gateway for asset storage and decentralized app (dApp) interactions.
A key growth catalyst for MetaMask is the potential launch of its own governance token. Unlike competitors Trust Wallet and Gnosis, MetaMask lacks a native token, which could streamline transactions and boost revenue by reducing reliance on third-party staking providers. Market speculation suggests a token launch could enhance MetaMask’s valuation and make it by this a hot topic for discussions.
Infura: Ethereum’s Infrastructure Backbone
Beyond MetaMask, Consensys’s Infura provides critical infrastructure for Ethereum, the world’s second-largest blockchain. Infura’s API services enable developers to build and scale dApps without running their own nodes, supporting over 430,000 developers and processing transactions worth over $1 trillion annually. Infrastructure is integral to Ethereum’s ecosystem, powering everything from DeFi platforms to NFT marketplaces.
Infura’s revenue model, based on usage fees ($40–$50 per 200,000 API requests), capitalizes on Ethereum’s growth. As transaction volumes rise—up 83% since 2017—Infura’s role as a reliable backend for MetaMask and other dApps positions it as a critical part of Consensys’s business.
Sharplink: Smart Contracts for Enterprises
Consensys’s Sharplink division develops software for smart contracts, serving high-profile clients like Ernst & Young, Airbus, JPMorgan, Microsoft, and Amazon. Solutions enable secure and automated agreements on Ethereum, with applications ranging from supply chain management to digital identity. Central banks in countries like Norway and Israel are also exploring Sharplink’s technology for digital currency initiatives.
Staking and Asset Management
Consensys owns approximately $500 million in Ethereum and other cryptocurrencies, generating income from staking and other revenue-generating operations, thereby complementing the company's software offerings, ensuring financial stability, and providing access to the growth of the cryptocurrency market.
Why Consensys Stands Out
Take Kraken or Bybit, for example. Their reported trading volumes are quite difficult to verify, but at the same time, Consensys' decentralized products provide transparency. Every MetaMask transaction and Infura API call is recorded on Ethereum’s public ledger, allowing investors to validate activity. Such openness mitigates the exaggeration common in crypto, where claims of user bases or turnovers can be inflated.
Consensys’s diversified portfolio—spanning wallets, infrastructure, smart contracts, and staking, as we told before—reduces reliance on any single revenue source. Its global reach, from emerging markets like Nigeria to tech hubs like the U.S., further de-risks its business model. Major investors, including BlackRock, JPMorgan, and Microsoft, have already backed Consensys, signaling that way confidence in its long-term potential.
The Road Ahead
Founded by Ethereum co-founder Joseph Lubin, Consensys has raised $1 billion to date, with a reported valuation target of $7 billion for a potential IPO. While the timeline for going public remains uncertain, the company’s focus on Ethereum’s ecosystem positions it to benefit from Web3’s expansion. Challenges, such as regulatory scrutiny and competition from wallets like Trust Wallet or blockchains like Solana, exist, but Consensys’s entrenched role in Ethereum gives it a competitive edge.
Bullish engulfing flex on the weeklyWhat’s up Candle Fam,
Ethereum just pulled a bullish engulfing flex on the weekly — and it’s not here to play. The recent correction shook out late longs, but structure remains beautifully intact.
🎯 LONG Setup
📍 Entry: $3,430–$3,340
🩸 Stop Loss: $3,190
🎯 Targets:
TP1: $3,750
TP2: $3,980
TP3: $4,200
📊 Strategy: Weekly OB + FVG Reclaim
– Weekly: Clean engulfing candle reclaiming the $3.2k–3.4k order block
– Daily: Structure holding higher lows — bullish market structure intact
– LTF: Watch for CHoCH + volume spike around $3.4k (12H/1H footprint shows absorption)
🧠 Footprint Flow:
– Aggressive shorts caught below $3.4k
– Buyers stepping in with clear delta divergence
– POC shifting higher = reclaim attempt underway
⚠️ Invalidation below $3,200 — breaks HTF structure
⛓️ Stick to low leverage or spot to manage broader macro risks.
No hopium, just structure.
Stick to the craft. Trade the plan.
Candle Craft | Signal. Structure. Execution.

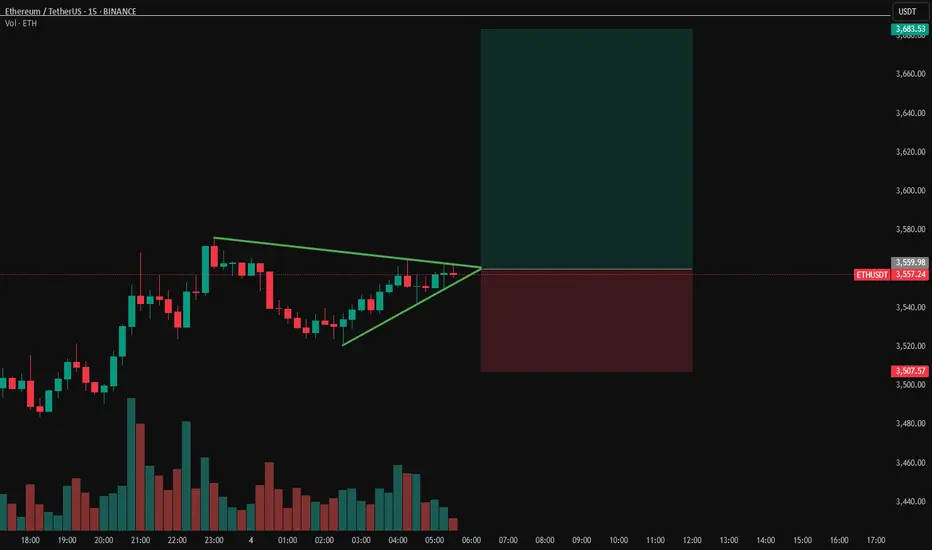
ETHUSDT Breakout ImminentETH sitting on $3500 support after reclaim
Price action is tight and indecisive.. lots of dojis and back-and-forth engulfing candles. Buyers and sellers clearly fighting it out.
We’re coiled in a symmetrical triangle, right on a key level that used to be strong support. It got broken but now reclaimed, im leaning bullish.
S&P and Nasdaq opened strong. If we break out of this triangle to the upside with volume, we could see a quick move toward $3650-3700.
Ethereum (ETH/USDT) – Bearish Channel Structure Developing
⸻
🔍 Technical Overview
Ethereum has broken down from its ascending channel, invalidating the earlier bullish projection toward $4,000. After failing to hold the channel midline around $3,577, price dropped sharply to $3,360, forming a new bearish descending channel.
Currently, ETH is trading near the midline of this bearish channel, which typically acts as a decision point — not a buying zone — in smart money models.
⸻
🧠 NEoWave Interpretation
We may be inside a Complex Corrective Wave, possibly a Running or Contracting Flat evolving after the March top. The current structure resembles a B-wave trap, where price fakes out the upside before shifting momentum sharply downward. The break below the ascending channel midline confirms this bearish shift.
⸻
📊 Smart Money Summary
• 🟥 BOS confirmed on 1H and 4H (lower highs and lower lows)
• 🔻 Midline failure acted as a smart money trap, followed by a liquidity sweep below $3,490
• 📦 Bullish Order Block around $3,490–$3,520 has been tapped, prompting a minor reaction
• 🟡 Current resistance sits near the channel top ~ $3,715
⸻
🎯 Trade Scenarios
📌 Bearish Continuation:
If price fails to reclaim above $3,715, a retest and rejection from the channel top could trigger continuation toward $3,300–$3,250.
📌 Bullish Reversal (less likely for now):
Only a clean break and hold above $3,720 would suggest that bulls are regaining control, opening path toward $3,900–$4,000 — though this scenario is weakened after structural damage.
⸻
⚠️ Trader Tip:
Avoid buying into midline reactions in weak channels. Better long setups form after stop-hunts, ideally near bullish OBs + internal BOS confirmations.
⸻
✅ Conclusion
Ethereum remains under bearish pressure after losing its ascending structure. Unless price reclaims the $3,715 resistance zone with momentum, downside continuation remains likely.
⸻
📌 Save this analysis
💬 Share your thoughts or alt wave counts in the comments.
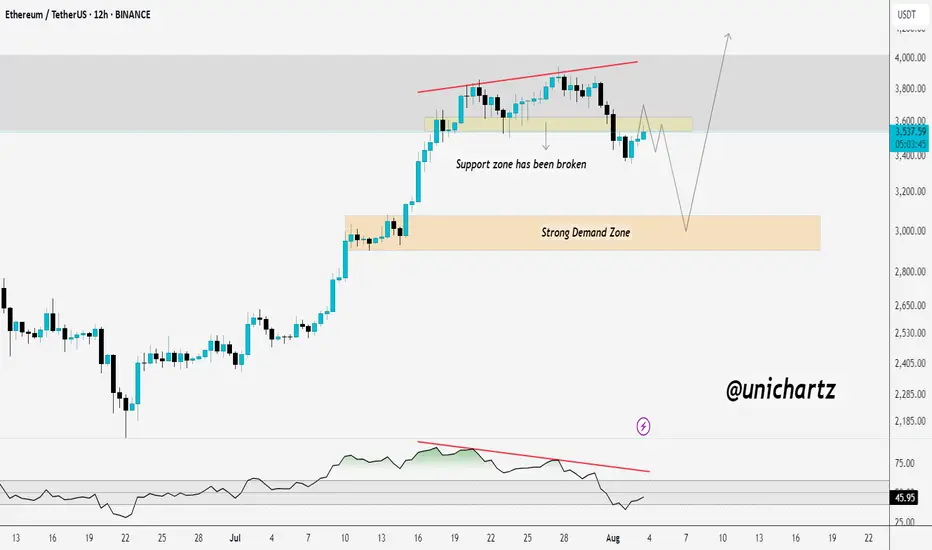
Breakdown Confirmed? ETH Could Drag Alts LowerCRYPTOCAP:ETH support zone around $3,560 has been broken, and current price action appears to be a retest of the breakdown. If ETH fails to reclaim this level, we could see further downside toward the strong demand zone near $3,000.
The RSI bearish divergence also adds to the bearish bias. If this retest fails, altcoins may face deeper corrections, as ETH often leads the market.
DYOR, NFA
ETH Looks Bearish (3D)Ethereum approached the weekly trendline and experienced a correction. It seems likely that we may see one more push upward to create a false bullish sentiment on this coin. There is even a possibility of a fake breakout above the descending trendline. However, before any major move, a significant correction toward the green zone appears likely | after which the main bullish move is expected to occur.
On higher timeframes, this is currently our outlook on Ethereum.
A daily candle closing above or below the invalidation levels would negate the current buy or sell bias.
For risk management, please don't forget stop loss and capital management
Comment if you have any questions
Thank You

Can Ethereum Hold This Crucial Level and Continue its Ascent?Can Ethereum Hold This Crucial Level and Continue its Ascent?
ETHUSDT presents a clear bullish structure on the daily timeframe, having recently broken out of a multi-month consolidation pattern. The market has encountered a significant resistance zone but has since pulled back to test a key support level. The price action is currently defined by a series of well-established support and resistance zones, along with a crucial rising trendline, which together will determine the asset's next major move.
1. The Bullish Impetus & Key Resistance:
All-Time High Resistance ($3900 to $4000): This upper red zone represents a significant supply area where sellers have historically entered the market, preventing a new all-time high. The recent rally encountered resistance in this zone, leading to the current pullback.
The Rally from the Consolidation: Following a period of consolidation, Ethereum staged a powerful rally, breaking through several resistance levels on its way to re-testing the all-time high zone.
2. The Immediate Support Zone:
First Support ($3300 to $3500): The current price is engaging with this green zone. This level has been a key area of previous support and resistance, and its ability to hold as support will be a critical test for the bulls. A successful defense of this zone would be a strong signal for a continuation of the upward momentum.
3. The Crucial Level & Trendline Confluence:
Crucial Level ($2700 to $2900): Below the immediate support lies a more significant support confluence zone, marked by the blue box and a rising trendline. This "Crucial Level" is a major demand zone that has previously served as a pivot point in the market. The confluence with the rising trendline, which has been providing support since late March, makes this a highly significant area.
0.5 Fibonacci Retracement: This area also aligns with the 0.5 Fibonacci retracement level of the recent major move, reinforcing its technical importance. A break below this zone would suggest a significant shift in market sentiment.
4. The Ultimate Support:
Long-term Support ($2000 to $2200): This lower green zone represents a robust long-term support level. If the "Crucial Level" were to fail, this area would be the next major target for a deeper correction. The 0.618 Fibonacci level is also situated within this zone, further highlighting its significance as a potential bounce area.
Conclusion:
ETHUSDT is currently re-testing its first major support zone after a rally toward all-time highs. The ability of the bulls to defend the "$3300 to $3500" level will be crucial for a potential re-test of the "$3900 to $4000" resistance. A failure to hold this support would likely lead to a retracement toward the even more critical "$2700 to $2900" level. The integrity of the rising trendline and the "Crucial Level" will be the ultimate determinant of whether the long-term bullish trend remains intact.
Disclaimer:
The information provided in this chart is for educational and informational purposes only and should not be considered as investment advice. Trading and investing involve substantial risk and are not suitable for every investor. You should carefully consider your financial situation and consult with a financial advisor before making any investment decisions. The creator of this chart does not guarantee any specific outcome or profit and is not responsible for any losses incurred as a result of using this information. Past performance is not indicative of future results. Use this information at your own risk. This chart has been created for my own improvement in Trading and Investment Analysis. Please do your own analysis before any investments.

ETH, 4000 when? or $2900?Yes, can come to $2900 but before that scalp all the momentums and then create an extent!

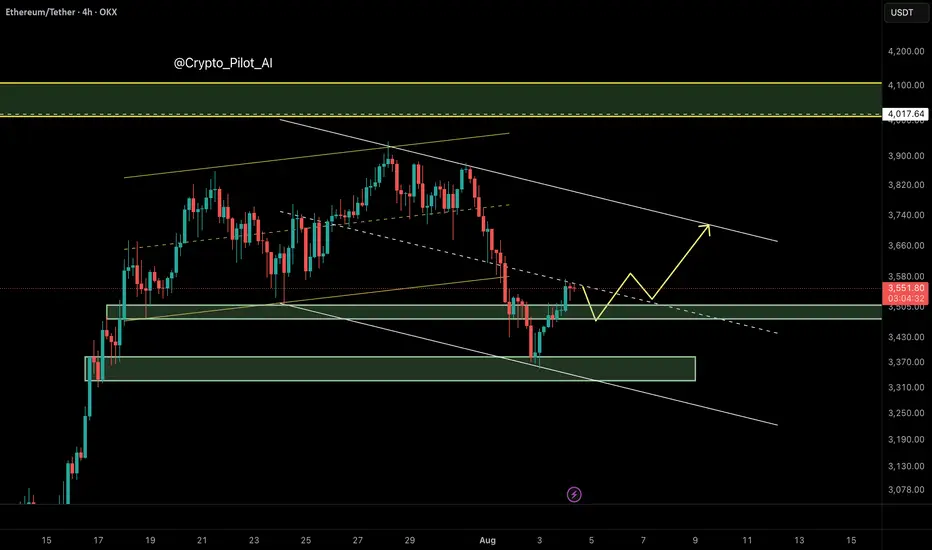
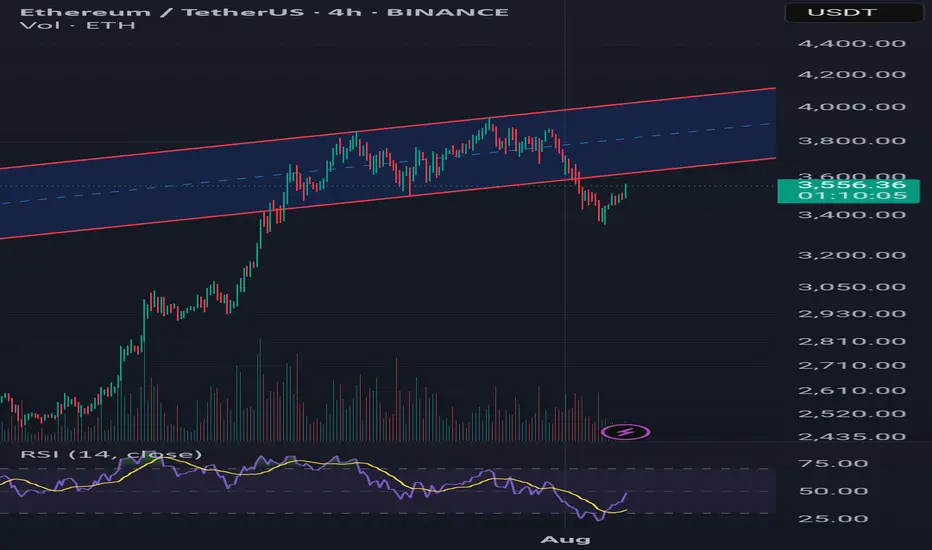
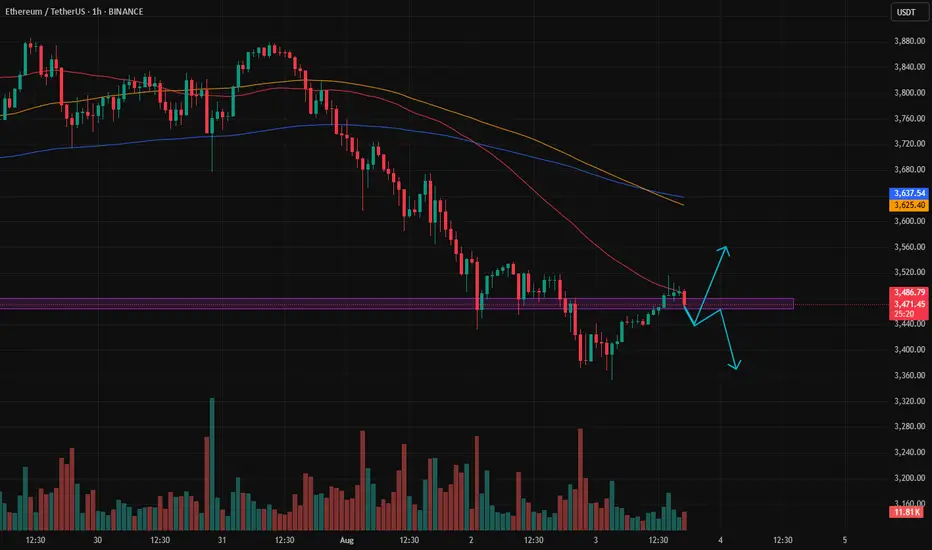
Ethereum at Critical Retest – Pullback or Breakout?Ethereum saw a sharp rally followed by a steady climb inside a rising channel. Recently, price broke below the channel’s lower boundary, signaling potential weakness. Now, ETH is retesting the broken trendline, which could be a classic pullback scenario.
Scenario 1 – Bearish Continuation:
If ETH fails to reclaim the channel and rejects around $3,600–$3,650, selling pressure may return.
Potential targets: $3,400 → $3,250 and, in extension, $3,050.
RSI is recovering from oversold levels but still below midline, hinting at possible limited upside before another drop.
Scenario 2 – Bullish Reclaim:
A daily close above $3,650 with strong volume would invalidate the breakdown and suggest a false break.
In that case, ETH could re-enter the channel and aim for $3,850 and the upper boundary near $4,050.
Risk Management:
Bearish entry: Wait for rejection candle on retest → SL above $3,700.
Bullish entry: Wait for confirmed breakout above $3,650 with volume → SL below $3,550.
Aug 4, 2025 -- ETHUSDT.PMarket can expand after this retracement. If it doesn't give any indication to move higher we can expect deeper retracement or reversal. If it expands now, it has a strong resistance around 4000 level. If that breaks, way up. If not, we at least get long till the major resistance. Currently, price is in a sensitive zone, if we get Daily/4H indication of running lower, we short. If it displaces upwards on Daily/4H we long. On any side here, we wait for the first expansion move.

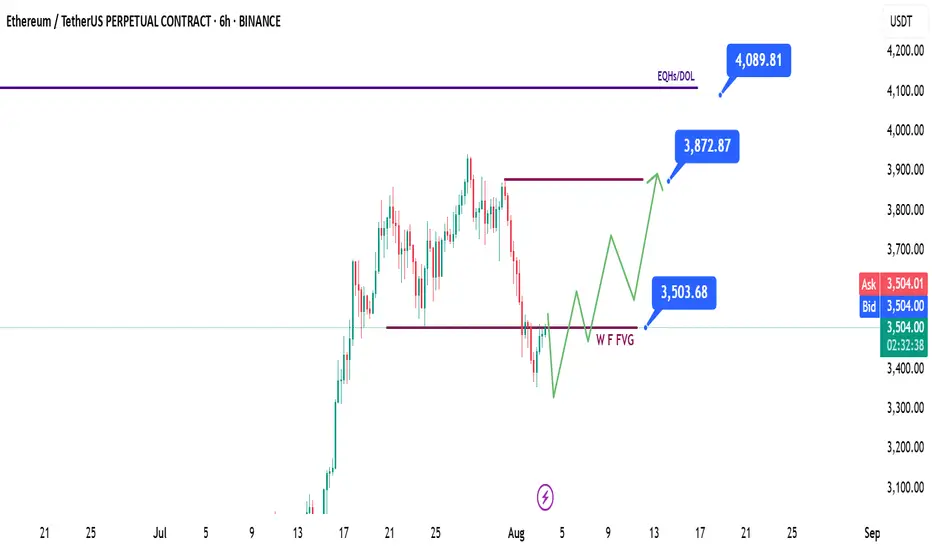
ETH | Ethereum - Weekly Recap & Gameplan - 03/08/25📈 Market Context:
Traders are currently anticipating a potential 0.25% rate cut at the September FOMC meeting, which continues to support the broader bullish outlook.
While the market pulled back following weaker-than-expected Non-Farm Payroll data, overall sentiment remains optimistic.
Greed has cooled off into a more neutral stance. Historically, August often brings some consolidation or pullbacks — but the structural bias for crypto market remains bullish.
🧾 Weekly Recap:
ETH started the retracement movement after building a bullish trend over the past couple of weeks.
It’s mainly being affected by Bitcoin's bearishness, so we’re closely following BTC’s price action.
ETH has tapped into the Weekly Fair Value Gap, which is a key level for me.
We may see a bounce from here.
📌 Technical Outlook & Game Plan:
I expect to see another low on ETH before we go up — as I’m also anticipating one more leg down on Bitcoin.
So I’ll wait for a final bearish expansion and a trap for late sellers before positioning for longs.
After that, I want to see price closing above the purple line at $3500.
🎯 Setup Trigger:
A candle close above the $3500 level will be my signal to look for long setups.
📋 Trade Management:
Stoploss: Below the swing low that breaks above $3500
Take Profit: Targeting $3870, but will trail and lock in aggressively in case of deeper downside expansion.
💬 Like, follow, and comment if this breakdown supports your trading! More setups and market insights coming soon — stay connected!
Combining a "cup and handle" pattern with a long position on ETHCombining a "cup and handle" pattern with a long position on ETH/USDT is a classic bullish technical analysis strategy. Let's break down what this pattern signifies and how to approach it for a long trade.
Understanding the Cup and Handle Pattern
The cup and handle is a bullish continuation pattern popularized by William J. O'Neil. It suggests a period of consolidation followed by a breakout to the upside, signaling a likely continuation of the prior uptrend.
Disclaimer: Technical analysis patterns like the cup and handle are tools, not guarantees. Always combine them with sound risk management and your overall trading strategy. Past performance is not indicative of future results.
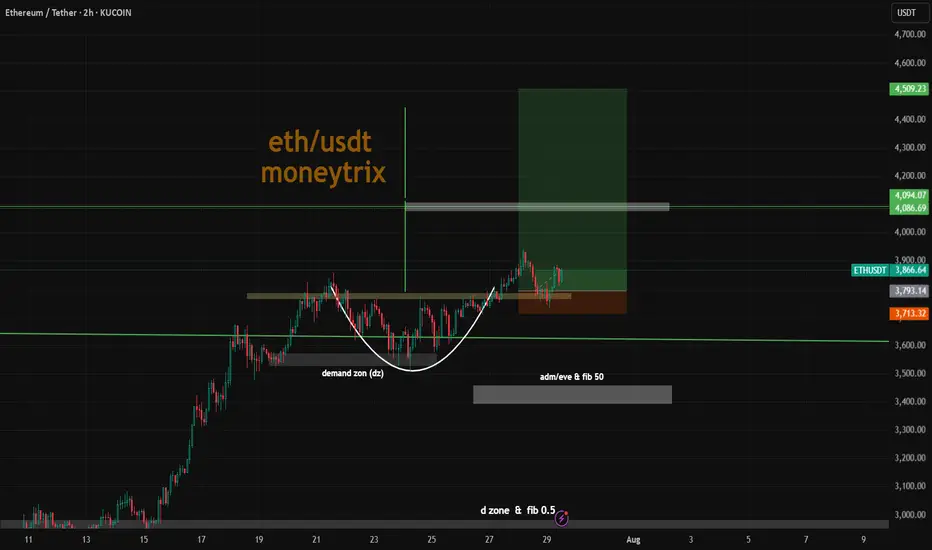
EtherumEth is in bullish trend
on 1D TF there was a bearsish divergeanc which create a correction
scrip has taken support from 0.5 fib level and bouncing back now.
apprently it is forming a flag pattern and it can hit target of 4500 soon.

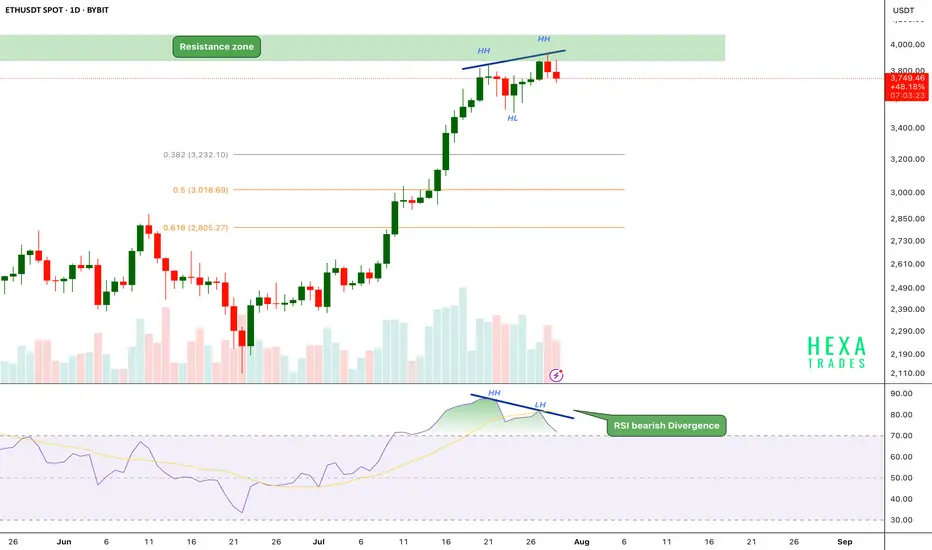
ETH Bearish Divergence!CRYPTOCAP:ETH has been in a strong uptrend, printing consistent higher highs (HH) and higher lows (HL). However, on the daily chart, the price has now reached a critical resistance zone near the $3,800–$4,000 range.
Key Points:
🔸 Bearish RSI Divergence
While price action has formed a new higher high, the RSI has printed a lower high, signaling bearish divergence.
This indicates that upward momentum is weakening even as price attempts to push higher — a common early warning of a possible short-term reversal.
🔸 Fibonacci Retracement Levels
The fib 0.382 at $3240 and 0.5 and 0.618 retracement levels are sitting around $3,000 and $2,800, respectively, potential targets if a correction follows.
🔸 Volume Profile
Volume is gradually declining as price approaches resistance, suggesting buyer exhaustion.
If the price breaks above the $4,000 psychological resistance, we could see a strong bullish move.
ETH is facing strong resistance after a powerful rally, with RSI bearish divergence and weakening momentum hinting at a possible short-term pullback. We should be cautious entering fresh longs here without confirmation.
Support: $3,200, $3,000, and $2,800
Cheers
Hexa
BINANCE:ETHUSDT BITSTAMP:ETHUSD

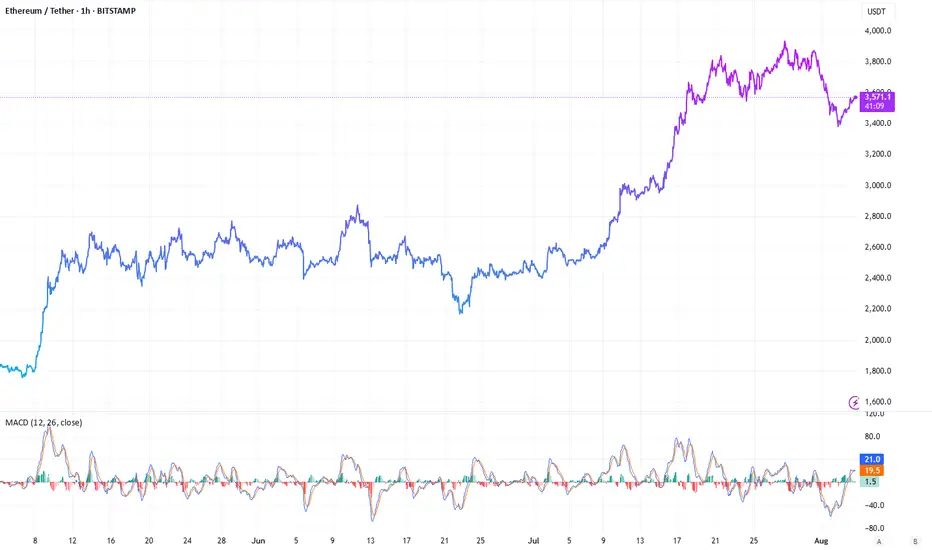
ETH 4H – MACD Histogram Caught The 54% Increase, Did You?The MACD Liquidity Tracker Strategy doesn’t just catch trends — it shows you how strong they are. On this ETH 4H chart, a textbook move unfolds:
🔹 Histogram flipped positive → Long entry triggered
🔹 Rising bars = building momentum
🔹 Tallest bar = momentum peak (July 21)
🔹 Shrinking bars signaled a weakening trend before price ever reversed
🔹 Histogram turned negative → clean exit at the top
The MACD histogram is a direct visual of momentum:
– Bars rising = acceleration
– Bars shrinking = exhaustion
– Crossing below 0 = confirmation of reversal
⚙️ Strategy Settings:
– MACD: 25 / 60 / 220
– EMA Filter: 50 / 9 / 3
– Entry Mode: Histogram + Crossover Combo

Patience to identify the market trendBased on the previous analysis, after hitting the sell target, the price made an upward correction.
Right now, it’s unclear whether we’re seeing the beginning of a trend reversal to the upside, or if the price is going to drop back below the zone, giving us another short opportunity.
If it does drop again, there’s a possibility it could fall as far as 3000.
We need to be patient and let the market show its hand — then we can respond accordingly.
ETH LongFollowing a significant decline, the asset will take support and bounce back from this point.
Disclaimer: This is not financial advice.
This algorithm provides highly precise buy and sell signals with alerts:
