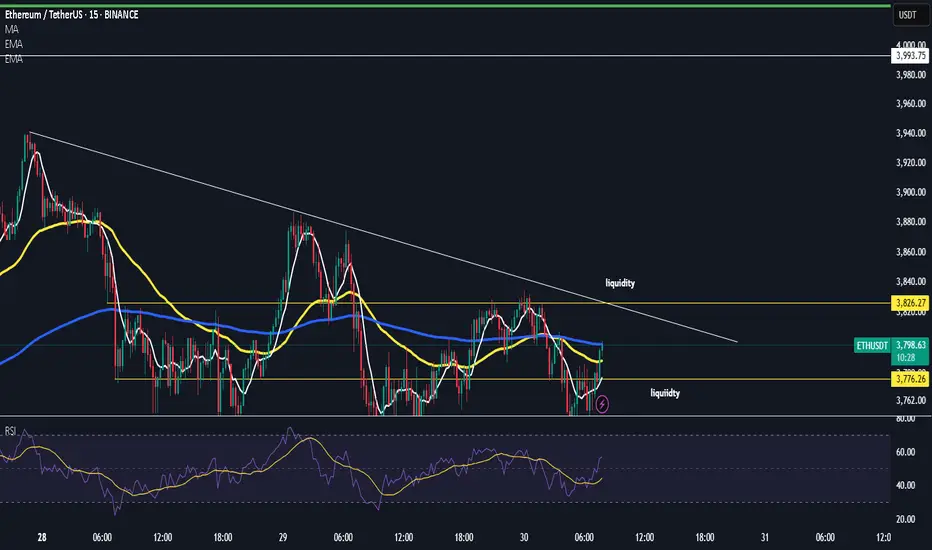
Ethereum Analysis – July 30, 2025📊 Ethereum Analysis – July 30, 2025
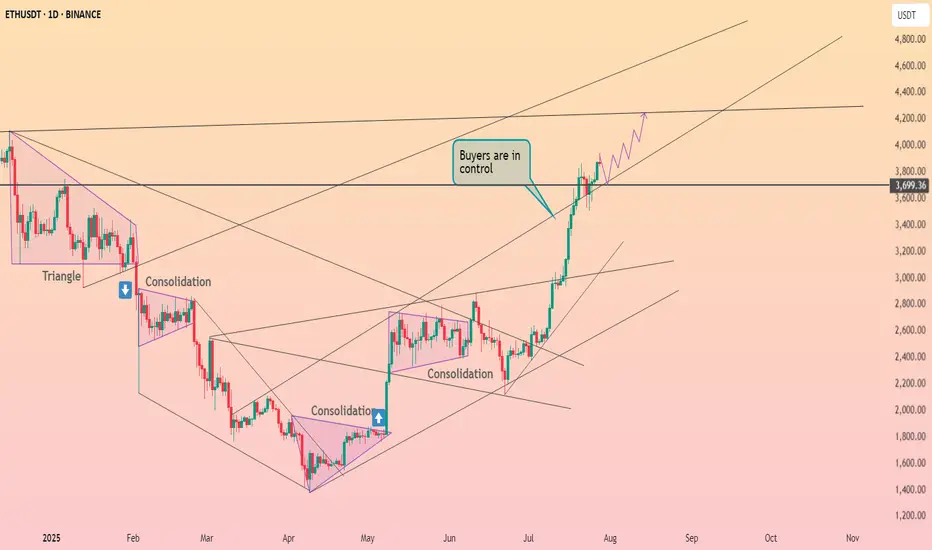
Ethereum is currently testing a key descending trendline (blue line).
If the price breaks above this resistance and confirms with strong candlestick closures, there's a high probability that ETH will rally toward the ascending red trendline, acting as the next dynamic resistance.
🚀 A confirmed breakout could trigger a bullish continuation, opening the door for higher targets in the short term.
However, failure to hold above this level may result in a pullback or range-bound movement.
📌 Keep both the blue and red trendlines on your chart — they’re currently the most critical zones to watch for potential entries or exits.
ETHUSDT trade ideas

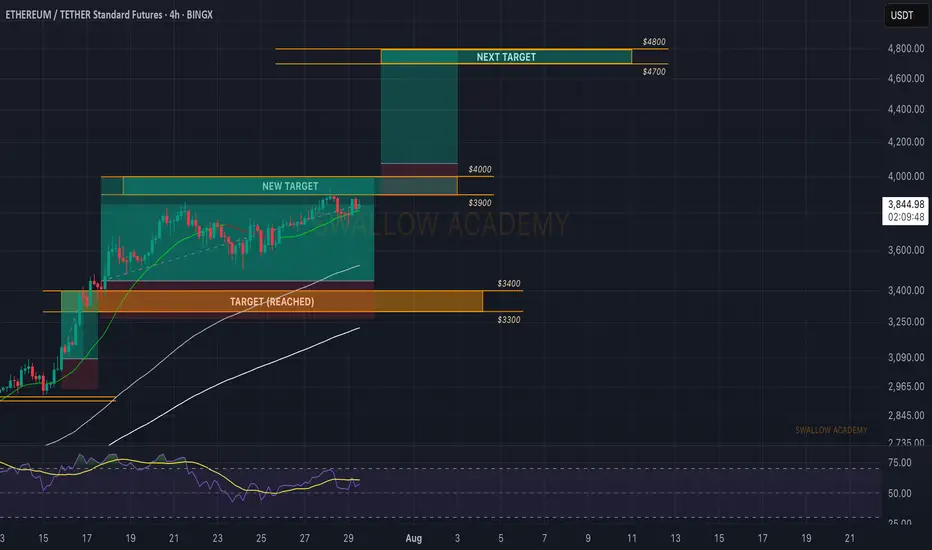
Ethereum (ETH): 2 Successful Trades | Targeting Now $4800Ethereum was so close to $4K that we considered it basically reading the target; now we set a new target and a new entry for us as well.
We are looking for a complete breakout to happen from the region of $4000, which then would open for us an opportunity for a bullish move towards the $4800.
Swallow Academy

Ethereum Above $4,000 Bullish Signal RevealsNo major drops and low volatility is a major bullish signal. Ether is bullish now with all sellers gone. Look at the down wave from December 2024 and see what three days red would do to Ethereum's price. Today we are on the third red day and ETH is hardly a few dollars below the most recent peak. A signal of strength. This strength also means that we are likely to see a continuation of the bullish move soon, Ether will continue growing.
Good morning my fellow Cryptocurrency trader, I hope you are having a wonderful day.
Everything seems calm now, a small pause... Sell at resistance, buy at support; right?
Well, not always. It depends on the context.
Here we have a rising trend and Ethereum has been advancing nicely. Now we reach resistance, is this the time to go SHORT? It is possible to SHORT at resistance and do good but here we have a very clear uptrend. When ETHUSDT peaked 28-July there wasn't much selling. This is telling us that the bullish move is not over, not complete.
Ethereum will produce additional growth. Seeing this, it would be unwise to sell SHORT. If prices drop, it is better to wait for support and go LONG. Trade with the trend, it reduces risk and increases your chances for success.
Namaste.

ETH - Bounce Zones - Nears the End for BULLSHello Fello's ☕
I'm watching Ethereum today and I believe it may be very close to the end of it's bullish cycle.
I think what could become likely is an extended altseason, where Bitcoin trades around the same price for some time, and Ethereum increases slightly. Afterwhich smaller altcoins (by marketcap) make random rallies before the beginning of a bearish cycle (which is due, see my previous BTC update).
There's an interesting channel here that previously determined bounce zones... I don't believe the channel itself will hold as much value going down, but this zone may be a likely bounce zone - around $3k.
Key bounce zones to watch include:
I'm not saying it will be this straightforward, but this image demonstrates the power of bounce zones for swing trades:
Next update will be when we've lost the first support zone.
Until then!
$ETH BREAKOUT FROM $4K IS A MATTER OF TIMEMomentum is in our favour — and this time, it's technically undeniable.
📈 MACD is at the highest levels it's ever been while testing $4K — signaling explosive breakout potential.
Weekly close above $3,959.55 confirms a breakout of a 28-month-long horizontal structure.
Once that’s in — it’s price discovery mode.
🎯 Targets:
→ $5,245 (0.5 Fib)
→ $6,530 (-1 Fib)
→ $9,101 (-2 Fib)
→ $11,673 (-3 Fib)
🟥 Invalidation:
→ Weekly close below $3,352
→ Bearish MACD crossover
Volume rising, structure clean, and momentum fully aligned.
This is the perfect storm for a macro leg to $10K+.

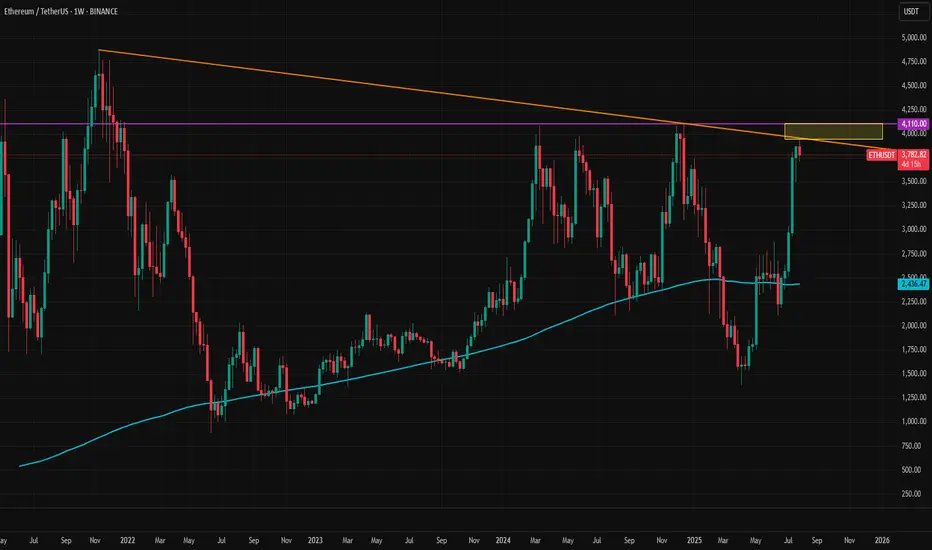
Ethereum Tests Key Long Term ResistanceEthereum continues to push higher, but a key resistance zone is causing a pause in the upward movement. Every day brings new positive developments for the crypto market, from ETF to tokenization news. This pattern reflects the typical progression of a crypto bull cycle. The latest SEC decision regarding a crypto-based ETF adds to the bullish backdrop.
However, a rising dollar index and a slowing momentum of U.S. stock market are having a short-term negative impact. Another reason for the current slowdown is the presence of massive resistance. The long-term trendline from the 2021 top, combined with the horizontal 4100 level, has formed a major resistance zone for Ether.
In the short term, ETHUSD may have formed another flag pattern. If it breaks to the upside, a retest of the 4100 resistance is possible. Today, dovishness level of Powell and the number of dissents in the rate-hold decision could significantly influence the price action.
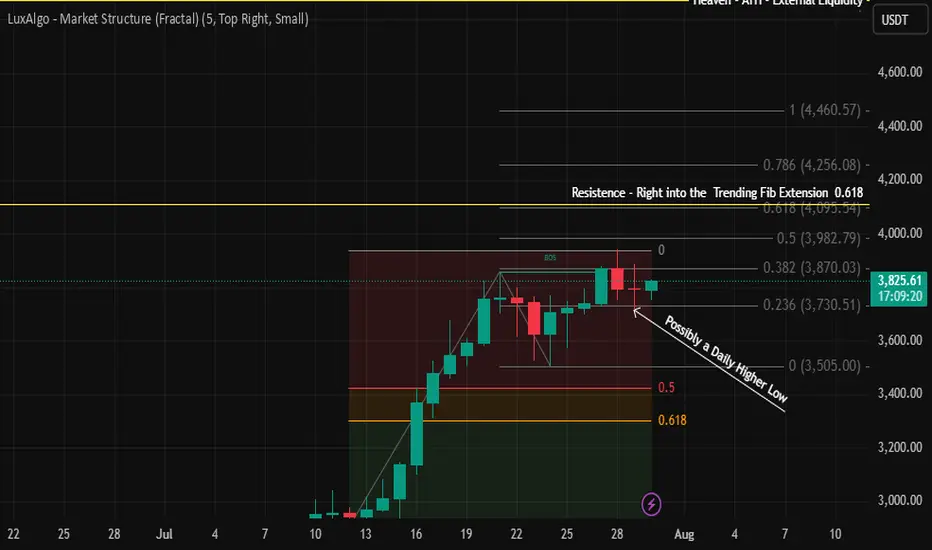
ETH to 4095 level this week??Next major resistence if it forms a daily higher low is right into the trend Fib ex .62.
Interesting to watch where ETH goes next.
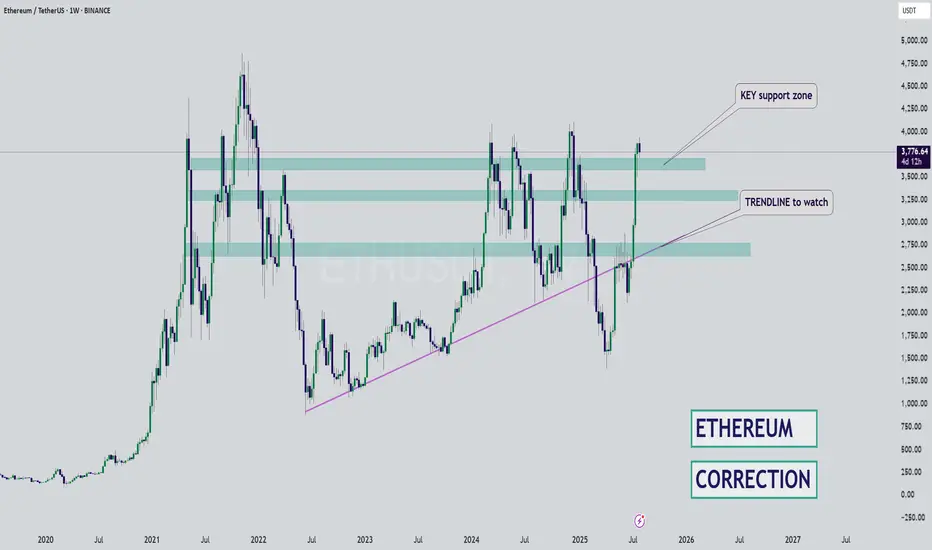
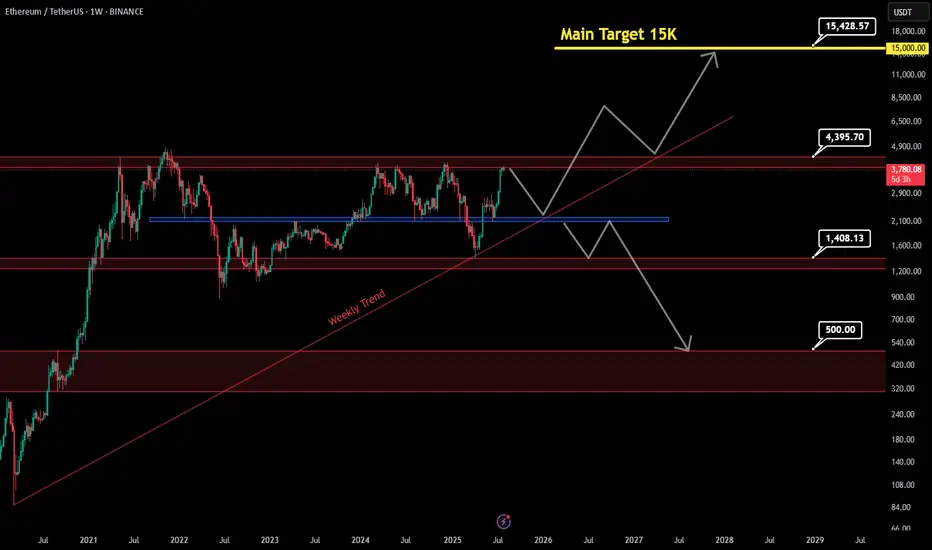
Ethereum to 15K ? or fall to 500$ !!📊 Ethereum – Long range outlook
If the price manages to break the red resistance zone above and hold above it, the path will be poised to reach the main target at $15,000, as shown by the rising arrows. If it fails, it has another opportunity to regroup buyers from the resistance at $2,228, with a very important trend that will support the upward move.
If the price fails to break the rebound from $2,227, closes this area ($2,227), and then breaks the weekly trend, we expect a sharp drop to $1,408 and even $500 in the long term.
Main Target : 15,000$
eth buyI think Ethereum is ready for a historic bull run, it has collected almost all the lower stops and has done everything right in terms of the right trend pattern. But from a fundamental perspective, with the arrival of President Trump and the launch of Ethereum ETFs, we can see a historic growth for Ethereum from a fundamental perspective, but we have to wait for the right pattern for the entry point. I will specify a few ranges for you, and my expectation is that Ethereum will be at $20,000.

ethereumI think Ethereum is ready for a historic bull run, it has collected almost all the lower stops and has done everything right in terms of the right trend pattern. But from a fundamental perspective, with the arrival of President Trump and the launch of Ethereum ETFs, we can see a historic growth for Ethereum from a fundamental perspective, but we have to wait for the right pattern for the entry point. I will specify a few ranges for you, and my expectation is that Ethereum will be at $20,000.
ETH to $6500?Have had this chart created for a while since before 2020, now loading it back up looks like everything is going as planned. ETH has to reach its ATH again around 4800 then it shoots to prices discovery, it will forsure run through 5000$ so $6500 becomes a target afterwards.
Ethereum Turns 10 Amid Bullish News and Institutional AccumulatiJuly 23, 2025 - World Liberty Financial a crypto project linked to U.S. President Donald Trump spent millions to acquire more Ethereum and acquired more than 3,400 ETH
July 29, 2025 - World Liberty Financial purchased 256.75 ETH for $1 million
July 29, 2025 - The mining company BitMine, which has adopted the strategy of accumulating Ethereum (ETH), presented the results of a study according to which the cost of replacing Ethereum is $60 thousand. The current price of the altcoin is 15 times lower, it fluctuates around $3.8 thousand
Against the backdrop of such strong news, tomorrow July 30, 2025 ETH will have a bile tomorrow, 10 years since the coin was created
Ethereum has tried to break through the $4,000 mark and stay there 4 times already
Against the backdrop of such powerful news, it is clear that institutional investors are clearly preparing for the fact that the coins will grow in the long term, and for some time to strengthen on new ATN
In the near future, you can focus on the $4100 and $4200 marks
Also, you should not bet on growth, a correction from the current marks to $3600 is always possible
AI-powered charting tools and news sentiment analyzers indicate a continued bullish trend

ETH Update – Eyes on the $3,820 Zone📈 ETH Update – Eyes on the $3,820 Zone
Ethereum is showing bullish momentum, and there’s a strong chance it could rally toward the orange resistance line around $3,820.
If price breaks above this level, the next target will be the blue trendline, marking the next key resistance.
🚀 Stay ready — momentum is building.
🔔 Follow for more clean setups and real-time analysis!

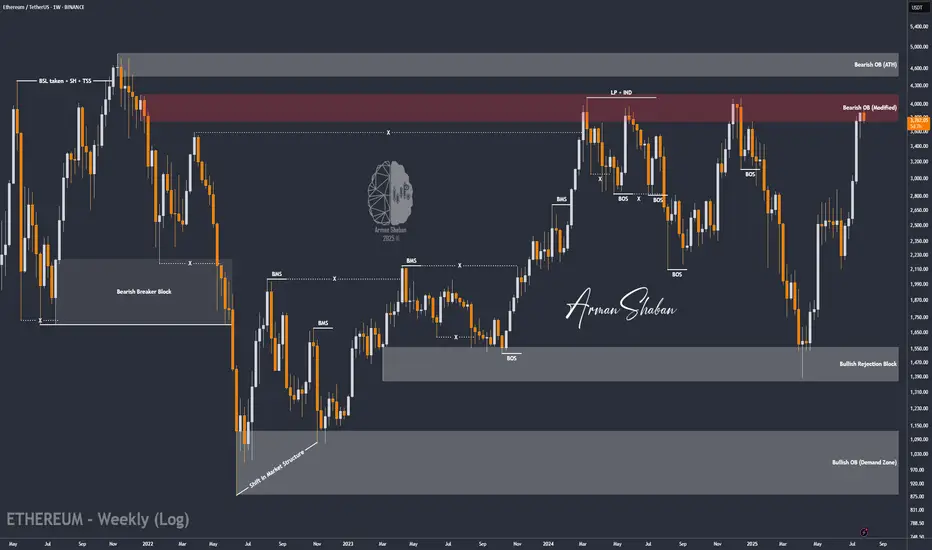
ETH/USDT | at a Crossroads – Hold Above $3440 or Sharp Fall!By analyzing the Ethereum chart on the weekly timeframe, we can see that after reaching $3940 and touching the key supply zone, ETH entered a slight correction and is currently trading around $3756. The key question now is whether it can hold above $3440 by the end of the week and push past $4000. If it does, we can expect another bullish leg toward $4100 and $4470. However, if the $3440 support fails, a sharp decline may follow — so this level is critical.
Please support me with your likes and comments to motivate me to share more analysis with you and share your opinion about the possible trend of this chart with me !
Best Regards , Arman Shaban
Ethereum destroyed resistance at the $3700 level ┆ HolderStatBINANCE:ETHUSDT remains stuck between $3,260 and $3,320, forming a tightening range with bullish undercurrents. Price is holding a higher low and consolidating under resistance, hinting at re-accumulation. A breakout above $3,325 could send ETH toward $3,400+ in short order. Bulls remain in control above $3,260.
ETH is PullbackingAs I said befor, a double top has formed at around $4,000 and I guess we have a pullback to around $3,500. The "new RSI Index" is showing a pullback and strong divergence. If ETH breaks $4,000, this analysis will be rejected.
"IT is NOT a commercial advice. you may lose all your money in crypto Specially in FUTURE trading."

ETHUSD 8H — Strategy Nailed the Breakout, But Is $4K Next?This Ethereum 8H chart captures a powerful trend reversal, triggered by the **Enhanced Ichimoku Cloud Strategy V1**. After months of chop, the system delivered a clean entry and held the full breakout — now nearing key resistance around \$4K.
---
**📊 Setup Breakdown:**
* Entry triggered after **three major confirmations**:
* Breakout above long-term trendline
* Flip above the **171 EMA**
* Bullish **Ichimoku Cloud alignment**
* Strategy entered long near **\$2,530**, and has held the move for over 80 days
* Current price: \~\$3,988 — a **+57% trend** captured without exit signal
---
**⚙️ Strategy Logic:**
The strategy uses:
* Custom Ichimoku inputs: *(7 / 255 / 120 / 41)*
* A 171 EMA trend filter for signal clarity
* Optional “Cloud Mode” to confirm direction
* A memory-based system that reduces false chop signals
On this trade, the system **ignored mid-trend noise**, stayed in position, and let the move fully play out — exactly what it’s designed for.
---
**🔍 What to Watch Next:**
* Price structure remains bullish as ETH nears the psychological **\$4K resistance**
* Cloud support rising beneath — confirming healthy structure
* A clean break above \$4K could trigger another leg, while rejection may form a range
---
This is a prime example of how **low-frequency, high-conviction signals** can lead to massive upside when paired with disciplined exits. Backtest this strategy on your favorite altcoin pairs and compare.
Let me know when you’re ready to move to the next chart brother — this one’s ready for the spotlight 🔥

Ethereum (ETH): Approaching $4000, Targeting Next $4800Ethereum is still below our current target, which is $4000. Soon to approach it, we are looking for a breakout from there and another trade to be opened right after the breakout.
The game plan is simple: 1 trade has been successfully closed, and the second one is almost near the target. Now waiting for the third one to be activated!
Swallow Academy
Weekly trading plan for EthereumLast week's BINANCE:ETHUSDT price action performed perfectly according to our scenarios - hitting our first target and establishing a new local high. Currently, price remains above the weekly reversal level at $3,751, maintaining potential for an advance toward Resistance #2.
Key Considerations:
While above $3,751 → Resistance #2 remains in play
Break below reversal level + trendline → Likely retest of last week's low
Such breakdown would likely breach both primary support levels
Trade Plan:
Bulls: Watch for continuation above $3,751
Bears: Require confirmed break of trendline + reversal level
As always, confirmation is key - trade the breaks, not the anticipations

ETHUSDT short positionhi traders
🔻 Short Position Setup – Overextended at Resistance
ETH/USDT is currently trading near a major resistance zone (~$4,080–$4,330), which historically marks the top of the trading range. This level has acted as strong resistance multiple times in the past, and price is now showing signs of overextension after a sharp upward move.
📊 Technical Indicators
RSI (14): Currently overbought at 77.44, with the moving average at 81.65 — levels that have previously led to pullbacks.
Volume: Elevated during the move up, but may begin to taper as momentum slows into resistance.
🧭 Trade Strategy: Short From the Top
Entry Zone: Around current levels near $4,080–$4,330
Rationale: Shorting the top of the range with overbought RSI, expecting a retracement or range rejection
🎯 Target Zones (Take-Profit Levels)
We are monitoring multiple support levels for potential profit-taking:
TP1: $3,494
TP2: $3,133
TP3: $2,827
TP4 (max target): $2,354–$2,363
⚠️ Important Note: Although we’ve identified several potential targets, we expect to close the short position earlier — depending on how the price behaves during the retracement. We'll monitor market structure, volume, and lower timeframe signals on the way down.
🛡️ Risk Management
Stop-loss: Above the previous highs (~$4,330), to limit downside risk if the breakout is sustained
Regular monitoring is essential, as macro conditions and ETH sentiment can shift rapidly.
✅ Conclusion:
We're recommending a short trade at the top of a well-defined range, with confirmation from overbought RSI and historical rejection zones. The trade includes multiple targets, but it’s likely to be managed actively and closed partially or fully before reaching the final levels.

ETH: Will Price Continue Upwards Movement! ETH has been steadily bullish in recent times, as the crypto market experienced a significant increased a safer option to invest around the global investment community. DXY and other major currencies currently experiencing a major drawdown in prices which indirectly helping the crypto market to remain bullish. While looking at how eth has performed in recent past, we can see it creating a record high in coming weeks.
Ethereum Price to Reach $4,000, but Market Top Suggests DelayBINANCE:ETHUSDT current price stands at $3,872, holding above its local support level of $3,742. While ETH is approaching the $4,000 mark , it has not yet managed to breach it. This resistance could continue to hold, limiting Ethereum's immediate potential for further gains.
Currently, 96% of BINANCE:ETHUSDT total supply is in profit. Historically, when the profitable supply surpasses 95%, it signals a market top . This has been followed by price corrections as investors begin to secure profits.
If the market top triggers a reversal, BINANCE:ETHUSDT price could drop to $3,530 or lower . A sharp decline to $3,131 is also a possibility, erasing much of the recent gains made in the past month.
On the other hand, if the influx of new addresses continues and strengthens, BINANCE:ETHUSDT may finally break through the $4,000 resistance. Should this happen, ETH could rise towards $4,425, with a renewed surge in price. This would invalidate the bearish thesis and push Ethereum into a new bullish phase.
