ETH short from 4300 → Targeting 4070 (Let’s see what’s next…)Shorted ETH right at 4300 – looking down to 4070.
For now, let’s ride this leg down and see what the market wants to show us next.
The upcoming news on Thursday & Friday could easily decide the next chapter of this move.
Until then, I’m staying patient, sharp, and two steps ahead – as always.
Remember: the market loves to test emotions… I just love testing the market. 😉
— Alpha Sigma Wolf
#btc #crypto #eth #bitcoin #ethereium #ethusdt #ict #trade
ETHUSDT trade ideas


Ethereum New Analaysis (4H)Now, Ethereum may face a serious correction after making one more high. So pay close attention to the $4900–$5000 zone.
For this bearish scenario to play out, the SWAP zone on the 12H or daily timeframe must be broken and price must hold below it.
A daily candle closing above the invalidation level would nullify this analysis.
For risk management, please don't forget stop loss and capital management
When we reach the first target, save some profit and then change the stop to entry
Comment if you have any questions
Thank You

Weekly trading plan for EthereumBINANCE:ETHUSDT showed strong growth last week but failed to break resistance, leading to a correction. At the moment, the price reacted from the first support level and is trying to reverse, though there’s still a chance to see a move down to the second support level before a gradual rise toward a new ATH.
In any case, if the trendline and the weekly pivot point are broken to the upside, the path toward 5,000 will open. If the price sets a new local low and fails to quickly reclaim 4,100 , a drop toward 3,850 becomes possible.

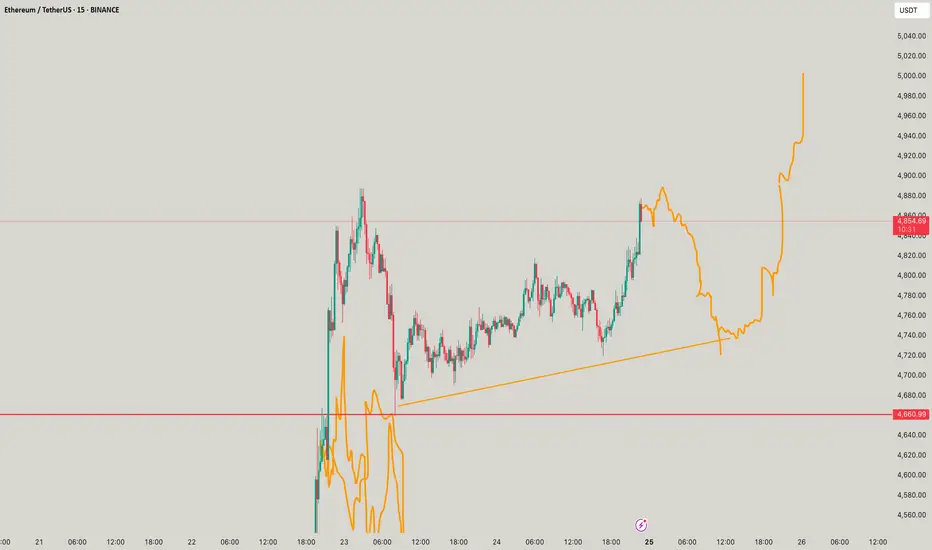
ETH Shatters Downtrend with Explosive Breakout | Bulls Take FulChart: ETHUSDT, 1H
Bias: Bullish
Analysis:
Hello, traders! We are witnessing a dramatic and powerful shift in the ETHUSDT market structure that warrants immediate attention.
The Previous Bearish Context:
For several days, Ethereum has been trading within a well-defined bearish channel. This downtrend was characterized by:
A clear descending trendline that has been respected with multiple touches, acting as dynamic resistance.
A series of confirmed lower lows and lower highs, with multiple breaks of structure to the downside (indicated by the "Strong" lows being broken).
Overall seller dominance, pushing the price down from the $4,788 high to a low of around $4,042.
The Bullish Takeover (The Main Event):
The narrative has completely changed in the last few hours. A massive wave of buying pressure has resulted in an explosive move to the upside. The key developments are:
Decisive Trendline Break: A very strong, high-momentum bullish candle has completely shattered the long-standing descending trendline. This is the most significant bullish signal on this chart, indicating the previous downtrend is now invalidated.
Break of Market Structure: This upward thrust has also broken through several previous resistance levels, including the swing high around $4,400. This constitutes a major Change of Character (CHoCH) and confirms a shift in control from sellers to buyers.
Potential Scenarios & Key Levels:
Bullish Continuation (Primary Scenario): With such strong momentum, the path of least resistance is now to the upside. Traders might look for long opportunities.
Potential Entry: A textbook entry would be on a successful retest of the broken trendline or the recently broken resistance level around $4,400, which should now act as support.
TP 1: The previous major high at $4,788 (the '1' on the Fibonacci scale).
TP 2: The next major area of resistance, identified by the indicator as the "Perfect Sell Zone 1", starting around $4,880.
Invalidation Scenario: While the breakout looks powerful, traders must always manage risk. The bullish thesis would be invalidated if the price were to reverse, fall back below the broken trendline, and close decisively below the $4,300 support area. This would suggest the breakout was a bull trap.
Conclusion:
The evidence on the chart is overwhelmingly bullish in the short to medium term. The break of the multi-day trendline is a significant technical event that cannot be ignored. The immediate bias has shifted firmly in favor of the bulls. The key will be to watch for a potential pullback for entry opportunities and to see how the price reacts as it approaches the next major supply zone around $4,900.
Disclaimer: This is not financial advice. This is for educational purposes only. Always do your own research (DYOR) before entering any trade.

ETH - Eyes on a New All-Time High?ETHUSDT has been on fire lately, following a textbook bullish structure of Impulse → Fakeout → Impulse.
After breaking above the previous range in July, ETH confirmed strength with a sharp impulse move, only to shake out weak hands via a fakeout retest before pushing higher again. 📈
Currently, ETH is in the midst of another impulsive leg, with the next major target sitting at the ATH around $4,876.
📊 Key Notes:
- Fakeouts have served as liquidity grabs before strong rallies 🏹
- Current momentum favors the bulls 🐂
- As long as price holds above the last breakout zone (~$4,050–$4,150), the path of least resistance remains up.
🎯 Next Stop: ATH and beyond if bullish pressure sustains.
📚 Always follow your trading plan regarding entry, risk management, and trade management.
Good luck!
All Strategies Are Good; If Managed Properly!
~Richard Nasr

ETH/USDT - BULLISH CONTINUATIONEthereum is now trading near 4,319 with a key support level at 4,060. If the support holds, the price has room to move higher toward 4,995, and a stronger rally could push it further to 5,232. The outlook remains positive as long as the price stays above support.

ETH-----Sell around 4290, target 4245 areaAugust 22nd ETH Contract Technical Analysis:
Today, the daily chart closed with a small negative candlestick pattern, with consecutive negative candlesticks and a single positive candlestick pattern. The price is below the moving average, and the accompanying indicator is forming a death cross. The overall downward trend is very clear. While the trend pattern is not extremely weak, each pullback is the basis for a corrective decline. This is also very clear. Therefore, in trading, we can simply sell at a high price and rely on high-level defense. On the hourly chart, the high point of yesterday's US session pullback was near 4326, which supported the price rebound. The price is currently consolidating at a low level. We will first observe the corrective trend during the day, and pay attention to the strength and breakout of the European session before making any strategic moves.
Today's ETH Short-Term Contract Trading Strategy:
Sell on pullbacks to the 4290 area, with a stop loss at 4335 and a target of 4245.

Ethereum Analysis – August 24, 2025After the high recorded about 10 days ago, we initially expected a deeper correction.
However, price surprised the market by pushing back toward the highs yesterday and printing a new top.
⚖️ The current decision zones are very tight:
• A daily close above $5,100 would strengthen the bullish outlook and support further upside.
• A daily close below $4,000 would shift momentum in favor of sellers.
📊 For now, it’s best to stay patient and watch how Ethereum reacts over the coming week before taking new positions.

ETH - ATH when?Looks likely but shall move on the moves on the chart anticipated! As shown! Lets see how it moves out!
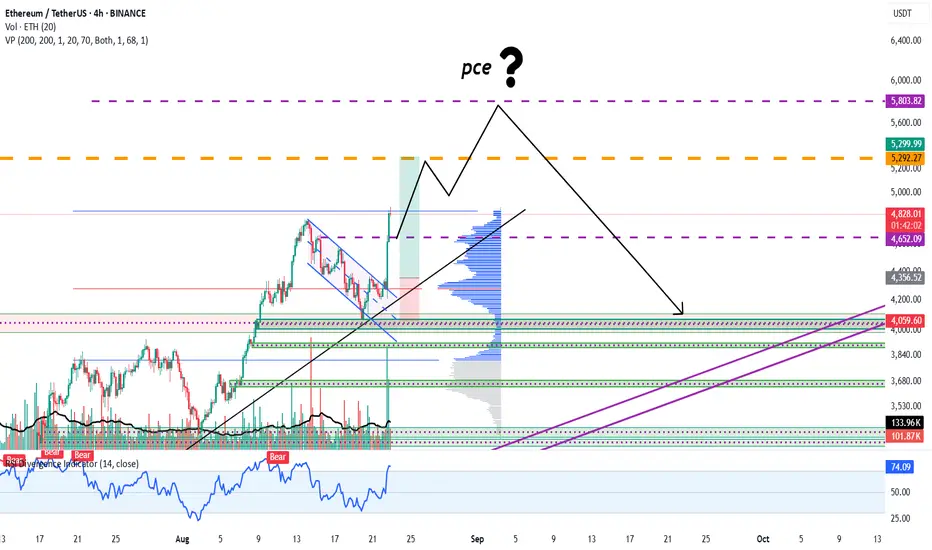
"Ethereum Targeting $5,500 Before Key PCE Data on August 29""Ethereum is likely to reach a new high around $5,500. After that, the market will be waiting for the PCE data on August 29."
Ethereum (ETH): Moved 140% So Far | Looking For Break of ATHEthereum is in an accumulation phase, where we have had a very sharp and aggressive movement to upper zones, yet the buy-side momentum has not faded away anywhere.
So that being said, we are still looking for ATH to be reached and broken; after that, we are going to aim for new highs.
Swallow Academy

ETHUSDT #009 (Be careful, need 15-20% correction for next cycleHello dear traders.
Good days.
First of all thanks for your support and comments.
————————————————————————
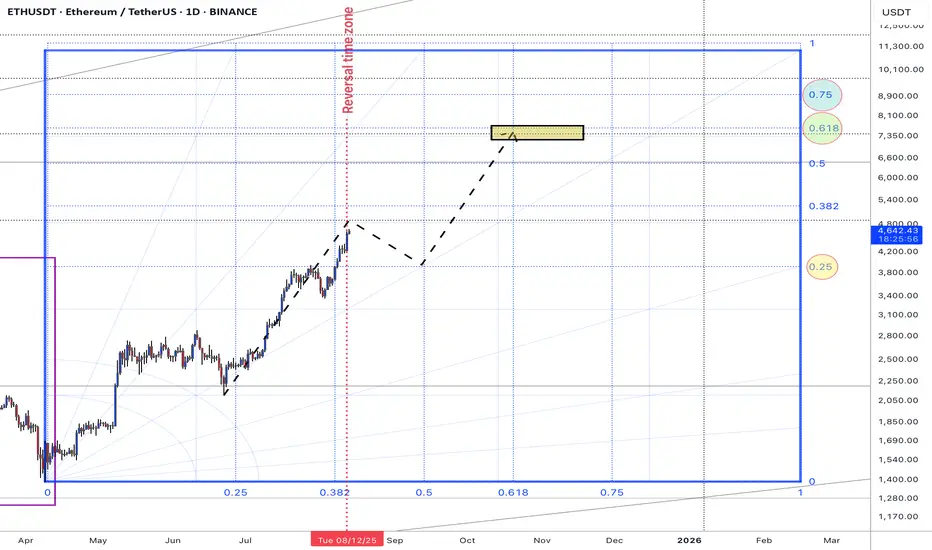
On daily Gann Square ETHUSDT break out 0.5 Gann Square price zone and with good strength trend line support it expected to fill 0.618 Gann box price level at exact reversal time zone .
So be careful and do not be FOMO . expected to grow up to 4800$ and correct 15-20 % correction for retest 0.5 Gann price zone .
If support at 3940-3915 $ will grow up fro next bull cycle .
BTC Dominance is mached also at exact time with ETHUSDT .
Weekly overview of ETHUSDT Chart will updated.
Good luck and safe trades.
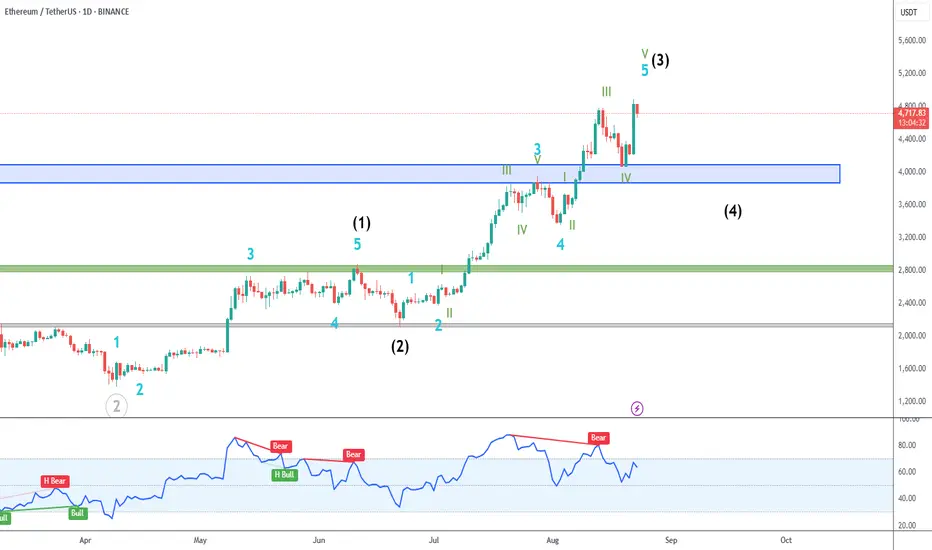
ETH/USDT: Final stages of Wave 3> Wave structure: ETH appears to be completing black wave (3), with signs pointing to an imminent wave (4) corrective move.
> RSI warning: Bearish RSI divergence suggests weakening momentum—typical before a wave (4) pullback.
> Wave (4) target zone: Correction likely into $3,800–$4,000, aligning with previous structure and acting as a potential accumulation zone.
> Strategy: Wait for a pullback into the blue zone to accumulate on weakness, aiming for a breakout toward black wave (5).
ETH at $4,100 – Can Bulls Defend Key Support Before FOMC..?ETH + FOMC = Volatility Ahead ? 🔥
Ethereum at Make-or-Break Zone: $4,100 Support in Focus!
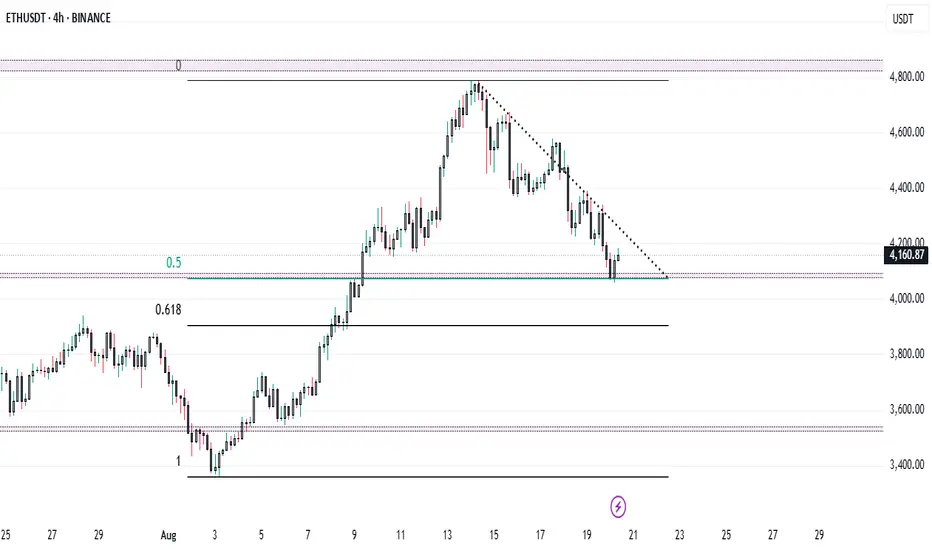
Ethereum (ETH/USDT) on the 4H timeframe is showing a decisive battle between bulls and bears. After topping near $4,700, ETH has been in a steady downtrend, respecting the descending trendline.
🔑 Key Levels to Watch
* Immediate Support: $4,100 – $4,150 (0.5 Fib retracement)
* Major Support: $3,950 – $4,000 (0.618 Fib retracement)
* Resistance Zone: $4,300 – $4,350 (descending trendline)
* Major Resistance: $4,600 – $4,700 (recent swing high)
📈 Bullish Scenario
✅ A breakout above $4,300 trendline resistance could trigger strong momentum toward $4,500 - $4,600.
✅ Holding $4,100 support will keep buyers in control.
📉 Bearish Scenario
❌ If ETH fails to hold $4,100, expect a deeper retracement toward $4,000 (0.618 Fib).
❌ A break below $3,950 may extend the fall to $3,700 – $3,600.
⚠️ Market Note
📌 Today’s FOMC meeting could heavily impact the crypto market trend.
Expect volatility as Fed commentary on interest rates may guide ETH’s next major move.
⚖️ Conclusion
ETH is at a critical support zone where the next move will define short-term direction.
* Above $4,300 → Bulls regain control.
* Below $4,100 → Bears target $4,000 and lower.
ETHUSDT analysis – 1D OB & Market Structure Scenarios/ AltseasonOn the daily chart, Ethereum is consolidating below the ATH resistance (4859) after a strong rally.
We currently have two major Daily OB demand zones:
First Daily OB around 3200–3600
Second Daily OB around 2400–2800
From here, I see three possible scenarios:
1️⃣ Continuation without deep retracement → Price holds above 4100 and breaks ATH (4859).
2️⃣ Shallow pullback → Price dips into the 3200–3600 OB, then rallies back above ATH.
3️⃣ Deep correction → Price retraces into the 2400–2800 OB before starting a new bullish leg.
⚡ Key point: If any of these three bullish scenarios play out alongside a drop in BTC dominance and a rise in ETH dominance, it could be the real start of an Altseason, with ETH leading the market and altcoins following strongly.
📊 ProfitaminFX | Gold, BTC & EUR/USD
📚 Daily setups & educational trades

Good opportunity to buy Ethereum📊 Ethereum Entry
✅ Entry: 4175
❌ Stop Loss: 3900
🎯 Take Profit: 4700
Risk–Reward looks 🔥
This analysis is not a financial recommendation. Crypto is a very risky market and you may lose some or all of your money in it. Especially futures trading.

Our analysis turned out correctThe analysis we gave about the price reaching 4000 has played out. However, in my view, a buy position hasn’t been triggered yet since the trend is still clearly bearish, and we need strong confirmations before buying. That said, there’s also a high chance the trend could reverse sharply, and we might miss the move. In that case, there are two options: either enter with lower risk or, if we miss it, avoid FOMO.

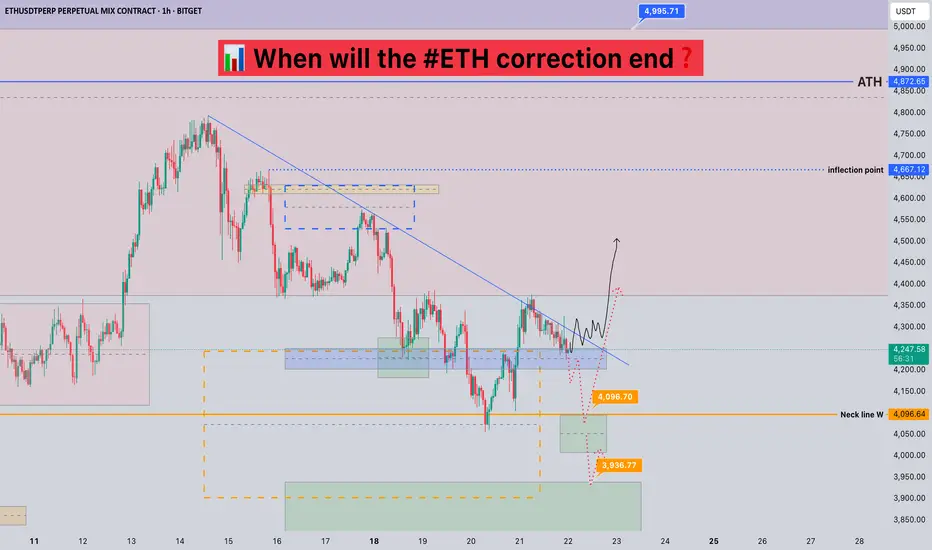
When will the #ETH correction end?📊 When will the #ETH correction end❓
🧠From a structural perspective, the bearish target hasn't been reached yet, so the risk of further decline remains. Further gains are possible only if the downtrend line is broken and the price stabilizes above the blue zone.
➡️ Short-term support could be around 3900-4100.
Let's see 👀
🤜If you like my analysis, please like 💖 and share 💬
BITGET:ETHUSDT.P
ETHEREUM TRADERS SHOULD ALLOW FED SET RATE ,RATHER THAN SPECULATING IT.THE CHANCES THEY WILL APPLY TYLOR RULE IS ON THE DESK.
The Taylor Rule is a monetary policy guideline developed by economist John B. Taylor in 1992. It provides a formula to help central banks, like the Federal Reserve, determine the optimal short-term interest rate based on economic conditions.
What is the Taylor Rule?
It links the central bank's target interest rate (the federal funds rate in the U.S.) to two key economic factors:
The difference between actual inflation and the central bank's target inflation rate (usually around 2%).
The output gap—the difference between actual economic output (GDP) and the economy's potential output.
The rule suggests that the central bank should raise interest rates when inflation is above target or when the economy is producing above its potential, to cool down inflation and avoid overheating.
Conversely, it advises lowering interest rates when inflation is below target or the economy is underperforming, to stimulate growth.
Why Does It Matter to the Fed in Rate Decisions?
The Taylor Rule provides a systematic, rules-based framework for setting interest rates, enhancing policy predictability and transparency.
It serves as a benchmark for policymakers to assess whether current rates are appropriate, balancing inflation control and economic growth.
The Fed often considers the Taylor Rule when making decisions but does not follow it mechanically, as real-world factors like financial stability and global economic conditions also influence policy.
During periods of deviation from the rule’s recommendation, the Fed may explain why it chose a different path, reflecting discretion and judgment.
The Taylor Rule helps anchor market expectations by providing a reference point for where interest rates "should" be, reducing uncertainty in financial markets.
AM WAITING ON SELL FROM THE ROOF .
HUNTER WAY.
#ETHEREUM

Ethereum's ATH: What's Next?Ethereum recently hit a new all-time high (ATH), but its upward momentum has met a significant resistance level. Based on this technical signal, there is a possibility that the price could pull back and correct to a support range of approximately $4,121 to $3,936.


Bearish signal ETH Eth stop at 4955 Tp at 4400 there is a double Top at 4900 range with the market showing Bearish signal in previous week in same price range … cryptocurrency is a very volatile market a break in trend always change the market direction 📉📉 Let’s Gooo
