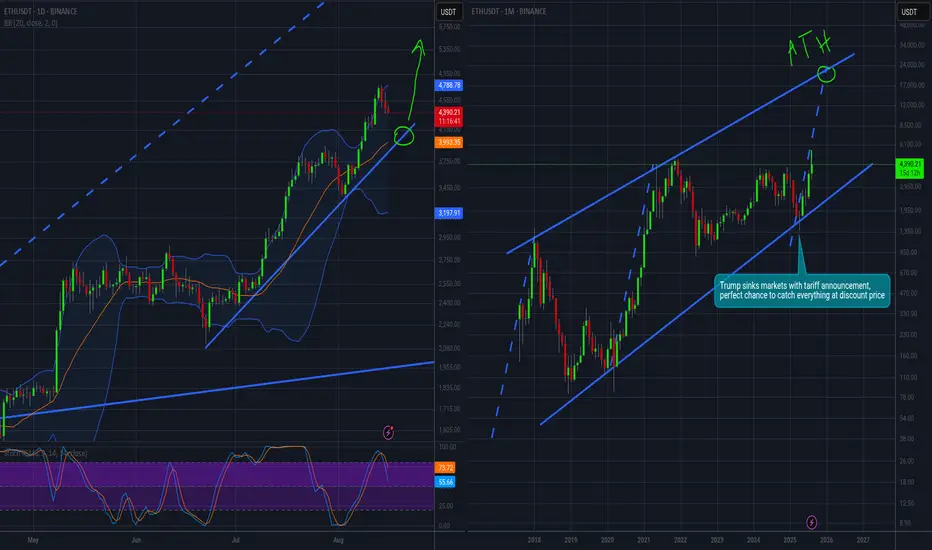
Ethereum Breaks 504 Days Long Resistance · The 2025 Bull MarketEther just broke a 504 days long resistance. The next one is the 2021 all-time high which happened a massive 1,372 days ago. Early November 2021.
Ethereum is breaking all resistance. One is already gone and the next one will be gone very soon, just this week is the first time that ETHUSDT is moving freely after breaking the high from March and December 2024. This was a price level around $4,100 and this was a tough barrier.
First in March 2024 Ethereum started to decline from this price to a low of $2,111. The second time happened with a $1,385 bottom. This time, ETHUSDT is already trading at $4,725 so there is no resistance left.
The last all-time high is not a resistance level of relevance. It does have some psychological effects because people track it but the market isn't likely to stop there for any meaningful amount of time. The action is headed straight up.
You know we are open and aiming for $11,000 but right now $6,000 followed by $7,300 is an easy goal. Go higher.
Do you think Ethereum was expensive when it traded around $2,400?
Remember, "trading at bottom prices"? Not anymore.
Ethereum is ultra-bullish now and there is no going back, a new all-time high is upon us and once Ether hits a new all-time high, all bets are off. Everything will speed up and all the smaller altcoins will start to follow.
The high increase in trading volume that tends to happen on the third wave of a bullish impulse is not present here. In fact, there is no significant rise in trading volume since July 2022. The weekly session in April produced high volume but not higher.
This is good. This means that the best is yet to come. We haven't seen much yet. We still have to experience the bullish force, strong momentum, the completion of the third wave and then finally the fifth wave.
Whatever you do, keep holding long-term.
Ethereum is going up.
Namaste.
ETHUSDT trade ideas

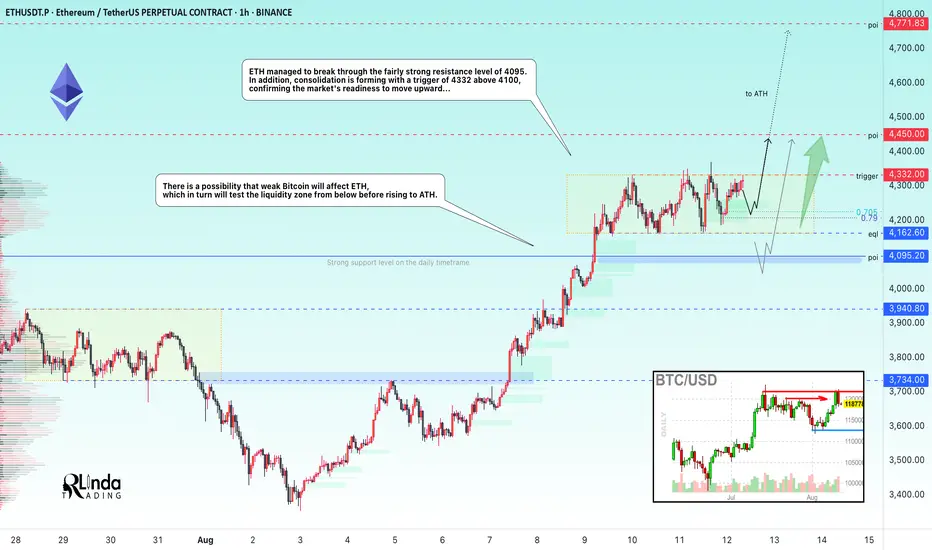
ETHUSDT → A new range has been opened. Onward to ATH!BINANCE:ETHUSDT is breaking through strong resistance formed in the 4090-4100 area on D1-W1. Consolidation is forming after strong growth, which can be seen as a positive sign.
Bitcoin has been looking quite weak recently against ETH, which continues to rally despite Monday's red market. ETH managed to break through the fairly strong resistance level of 4095, and after a strong 25% rally, the price moved into consolidation (trading range 4325-4160, with resistance at 4325 as the trigger). Technically, we see that the market has stopped updating local lows, and a fourth retest of resistance is forming with reduced volatility, which in general could lead to a breakout attempt. Consolidation of the price above the consolidation resistance could trigger further growth. A channel to the ATH is open...
Resistance levels: 4325, 4450, 4800
Support levels: 4220, 4162, 4095
ETH is quite strong and the market may not allow the price to fall too low, as there is a lot of excitement. However, I do not rule out the possibility that weak Bitcoin will affect ETH, which in turn will test the liquidity zone (4162 - 4095) from below before rising to ATH.
Best regards, R. Linda!
Market update for EthereumAs for BINANCE:ETHUSDT , setting a new ATH is only a matter of time — most likely today or tomorrow.
The price is currently in the resistance zone, with red candles appearing, so a slight pullback to 4,500 is possible before breaking the ATH. It’s easier to track this on a lower timeframe — just don’t even think about shorting the highs.
The first two targets have already been reached, and the final target is right at the ATH level.

Ethereum (ETHUSDT) Momentum AnalysisHi there, let's take a look at ETHUSDT.
📱 Technical Overview:
- *Current Price: Approximately 4285, approaching a significant resistance zone.
- *Resistance Level: Near 4348, which has historically acted as a resistance level where price struggles to break through.
- *Support Zones: Identified around key Fibonacci retracement levels as follows:
- 0.236 at 4046
- 0.382 at 3859
- 0.5 at 3707
- 0.618 at 3556
- 0.786 at 3340
🎙️ Outlook:
- The price is consolidating near resistance right now, suggesting a potential bullish breakout or a rejection leading to a pullback due to the pin-bar price rejection.
- Fibonacci retracement levels indicate critical support zones, where price may find stability in those areas if a drop in prices occurs.
- Prior to starting an upward trend again, I anticipate a potential decline towards the support at about 3800.
- The projected targets (TP1 and TP2) suggest a bullish scenario where, following a retracement, Ethereum could rally towards 4890.
🧩 # Potential Scenarios:
1. *Bullish Breakout: If ETH manages to clear the resistance at 4348 with strong volume, then a rally towards higher targets could occur.
2. *Pullback and Rebound: If the resistance holds, then we can anticipate a drop to support levels near 3857 or 3556. A strong bounce from these levels could set the stage for future upward moves.
3. *Failure to Hold Support: A break below support zones could lead to deeper corrections; thus, it will need monitoring.
Happy Trading
Khiwe.
Not trading advice.

Ethereum ETH price analysis📉 Three possible scenarios for #Ethereum CRYPTOCAP:ETH :
🟢 Bullish:
Minor correction to $3950–$4000, followed by a breakout to new all-time highs (ATH).
🟡 Neutral:
Drop to $3400, bounce to $3950 — and then the decision point: breakout or breakdown?
🔴 Bearish:
Deeper correction to $2650 — possibly the last great buying opportunity before the next major rally.
👉 Which scenario for OKX:ETHUSDT resonates most with you?
Let us know in the comments!

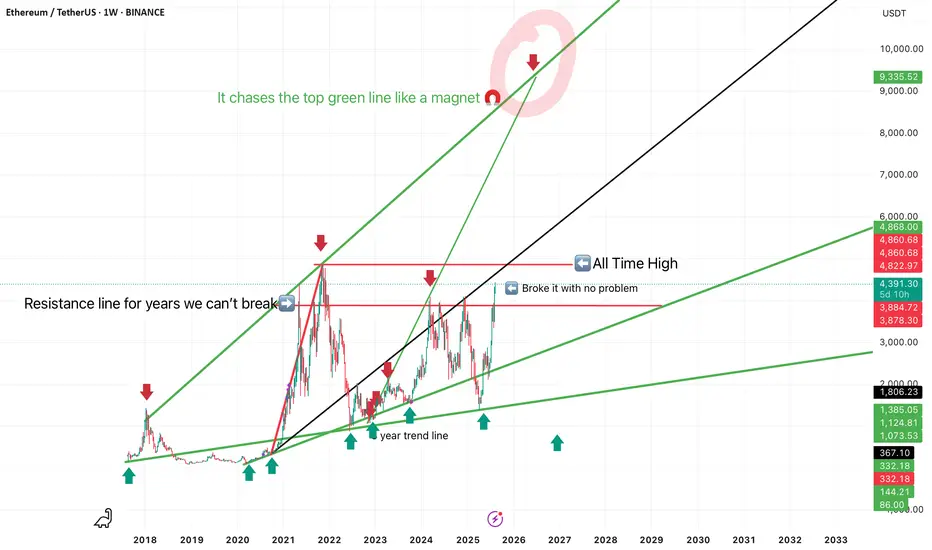
$Eth (Ethereum) road map to prices that will melt faces If history repeats itself, like it always does, then you should watch this beautifully play out, Ethereum is like a magnet to the top green line, but your resistance and support lines are tagged out. Do what you want with this and make sure you do your own research.
DeGRAM | ETHUSD above the resistance line📊 Technical Analysis
● ETHUSD broke above the long-term resistance at ~$4,027, confirming a bullish continuation from the rising purple trend channel.
● Price retested that breakout as support and is setting up for a measured move toward the key $4,926 supply zone, with on‑chart channel geometry and breakout structure supporting further upside.
💡 Fundamental Analysis
● Spot Ethereum ETFs surged with record trading volume of $2.725 B on August 11, signaling strong institutional and retail demand.
● Derivatives market is deepening—Ethereum futures open interest exceeded $30 B, while CME futures hit a record $7.85 B—as institutional flows fuel momentum.
● Corporate treasury adoption jumped sharply: small public companies now hold 966,000 ETH ($3.5 B), underscoring real‑asset confidence.
✨ Summary
Buy above $4,027; target $4,926. Setup remains valid while holding above $4,000.
-------------------
Share your opinion in the comments and support the idea with like. Thanks for your support!

$ETH Weekly Analysis – ATH soon?ETH is testing the upper boundary of the green zone (~4340–4350), which is acting as key resistance, very close to its ATH.
Scenarios for this trading week:
Bullish : a confirmed breakout and close above 4350 opens the door to the 4,600–4650 target zone, with strong resistance ahead at 4860 (previous all time high zone). If buyers show strength, we can see new All-time High (~4900-5000).
Sideways/Correction : price could move in the 4000–4200 range for consolidation.
Bearish : а drop below 4000 could push ETH down to 3500–3650, even toward the key support around 3300 if the selling pressure grows.
Daily RSI is at 74, that means it's deeply overbought, so be cautious about your long positions.
Disclaimer: The author’s opinion may not align with yours.
BYBIT:ETHUSDT

ETH Daily Recap & Game Plan – 15.08.2025ETH Daily Recap & Game Plan – 15.08.2025
📊 Market Sentiment
Overall sentiment remains bullish, supported by expectations of a 0.25% rate cut in the upcoming FOMC meeting. A weakening USD and increasing global risk appetite are creating favorable conditions for further upside in crypto assets.
Ethereum is approaching all-time highs, fueled by a $1B single-day ETF inflow. Additionally, rumors of potential SEC approval for Ethereum staking policy could directly boost ETH’s utility — strengthening the long bias.
📈 Technical Analysis
Price has started a retracement move after Bitcoin reached new all-time highs.
Currently, ETH is testing the daily demand zone (blue box) — a level where we may see a reaction. For confirmation, I want to see a 4H break of structure before initiating any trades.
Since it’s the weekend, I expect some choppy price action and possibly a deeper retracement. I’m watching two potential scenarios (Blue vs. Red).
📌 Game Plan
Scenario 1 (Blue)
→ Price sweeps 4H swing liquidity at 4255$, then rejects.
Scenario 2 (Red)
→ Price dips deeper, tapping the untested swing high at 4112$ and possibly into the equilibrium discount zone (0.5 Fibonacci), before rejecting.
🎯 Setup Trigger
Waiting for a 4H break of structure before entering any position.
📋 Trade Management
Stoploss: 4H swing low confirming the BOS
Target: Run directly toward all-time highs at 4867$
💬 Like, follow, and comment if you find this setup valuable!
Disclaimer: This content is for informational and educational purposes only and does not constitute financial, investment, or trading advice. Always do your own research before making any financial decisions.

ATH FOR Ethereum!!!Hello friends🙌
As you know, Ethereum has been on an upward trend these days and we can say that buyers have entered, but not completely...👀
🔊Now, considering the resistance that Ethereum is facing, namely the number 3900 to 4100, we need to see what reaction the price will see this time when the price reaches this resistance for the 4th time?
✔We will most likely make a small correction and this time this major resistance will be broken again and we will witness a higher ceiling.
✔Otherwise, I have an important and key support that we have identified for you and if the price drops, this support is a good area to buy again.
And finally, observe risk and capital management⚠
🔥Follow us for more signals🔥
*Trade safely with us*

ETH at resistance!Ok, finally ETH is making happy all his estimators but I jsut want to point out that it's close to ATH so maybe wait to see what happens before buying it. I'd wait for some short setup unless there's a stronk breakout!
I expect something like what I drawn there. I don't own a lot of ETH but remember that after ETH money will flows in big caps alts and that will make us happy.
Good luck!

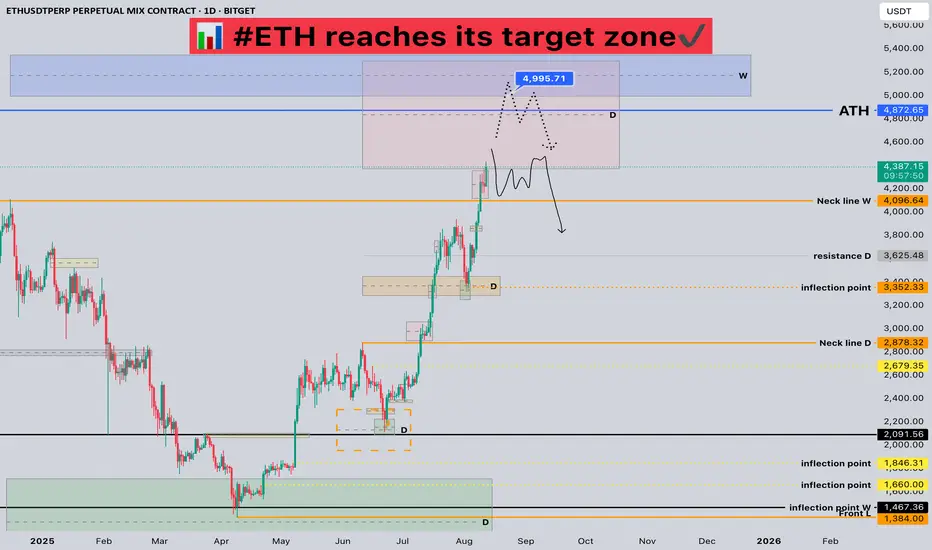
#ETH reaches its target zone📊 #ETH reaches its target zone✔️
🧠From a structural perspective, we've reached the daily bullish target zone, so we need to be wary of the risk of a pullback.
➡️Chasing the gains within the red resistance zone is not recommended, as the expectation of a daily pullback is very strong.
➡️If you want to participate in a short trade, you need to patiently wait for a bearish structure of the same cycle to emerge, or look for shorting opportunities near the overlapping resistance zone around 5000.
🤜If you like my analysis, please like 💖 and share 💬
BITGET:ETHUSDT.P
ETH's next volatility period: around August 28th
Hello, traders!
Follow us to get the latest information quickly.
Have a great day!
-------------------------------------
(ETHUSDT 1D chart)
This volatility period for ETH is expected to last until August 15th.
Therefore, caution is advised when trading.
The key question is whether the price can rise above the previous all-time high (ATH) of 4868.0.
Currently, the key support and resistance levels are 3900.73-4107.80.
Therefore, even if there is a further decline, if the price remains within the 3900.73-4107.80 range or higher, the upward trend is expected to continue.
Currently, the HA-High indicator is formed at 3708.87, so it's important to check whether a new HA-High indicator is formed if a further decline occurs.
The formation of the HA-High indicator indicates a decline from the high, so determining whether support is found near that level is crucial.
While ETH's volatility period is around August 28th, BTC's volatility period is around August 24th. Therefore, it's important to monitor how the price moves during this period.
-
Thank you for reading.
We wish you successful trading.
--------------------------------------------------
- Here's an explanation of the big picture.
(3-year bull market, 1-year bear market pattern)
I'll explain more in detail when the bear market begins.
------------------------------------------------------

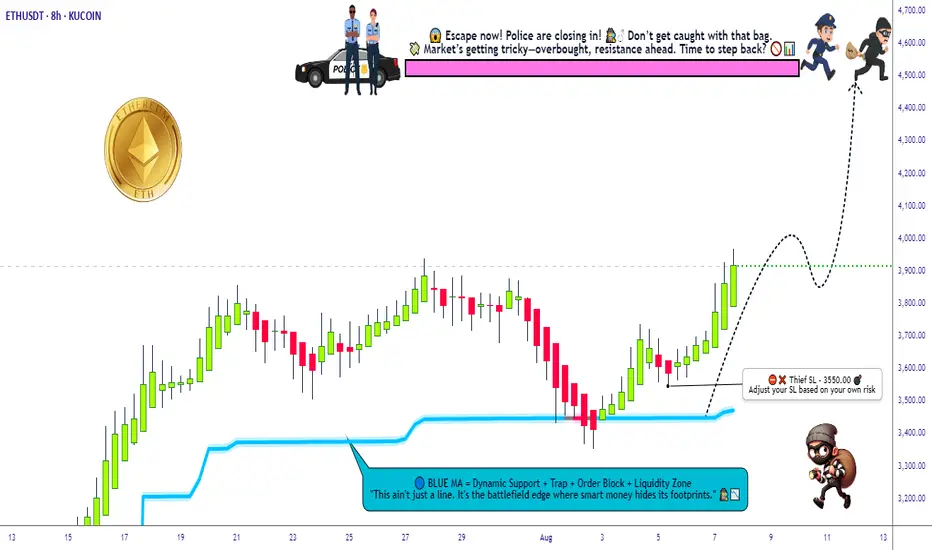
ETH/USDT Grid Plan » Bullish Loadout » Stealing the Top🚨ETH/USDT Crypto Heist Plan 🔓💰
Asset: ETH/USDT "Ethereum vs Tether"
Plan: 🟢 Bullish – Multi-Layered Entry Grid
Strategy: Thief-style limit orders (GRID / DCA stacking)
Entry: Any Dip is a Heist Opportunity 💸
Stop Loss: 🔻 3550.00
Target: 🎯 4500.00
👋 Hey Thieves & Money Makers!
Get your gear ready – it's time to loot the Ethereum Vault 💎🚀
🔥Thief Trader's ETH/USDT Master Robbery Blueprint🔥
This ain’t your average plan — we break in with layered entries, lock in on breakout volatility, and ride the bullish train to the moon 🌕.
💼 Entry Strategy:
No need to overthink. Any dip = loot zone!
Stack multiple limit orders like a pro (15M–1H level).
We're playing the grid game. The more dips, the bigger the stash! 🧱🪙
🚨 Stop Loss:
Set SL at 🔻3550 or under recent swing lows.
Adjust by risk appetite and how many entries you stack.
Thieves don’t chase – they calculate risk.
🎯 Target Zone:
We're eyeing the 4500 mark. But remember – exit before the vault shuts if momentum slows. 🏃♂️💨💰
🔁 Scalpers Alert:
Only long. Only bullish. Only profit. 🧲💥
Stack it, trail it, and let it run with a sniper's precision. 🎯🧠
📊 Market Context:
ETH bulls gaining control post-accumulation.
Strong on-chain metrics, solid macro tailwinds.
Bears trapped in the shadows – we move in daylight. 🐂🆚🐻
📰 Warning – News Bombs Ahead!
💣 Avoid fresh positions during high-impact events.
🎯 Use Trailing SLs to protect your loot.
Smart robbers never get caught unguarded.
💥BOOST This Idea if you're part of the robbery crew 🔐💰
Every boost powers our next move.
Let's rob the crypto market together – one breakout at a time! 🏴☠️📈🤑
Thief Trader™ – Locking Targets. Looting Charts.
💎🕵️♂️📊 #CryptoHeist #ThiefStyle #ETHBreakout #GridGang #BullMode
ETHEREUM bearish-divergenceA bearish divergence exists on Ethereum's daily RSI, but since $4,000 is broken, it should hold above that price.

ETHUSDTBINANCE:ETHUSDT is overall trend in the 4-hour timeframe is bullish, with strong buying momentum. The price is currently at the 4200 USD resistance, and if this level breaks, the next target will be around 4500 USD.
Supports:3950 USD, 3730 USD, 3350 USD
Resistances: 4200 USD, 4500 USD
⚠️Always apply proper risk management.


Can Ethereum Give Us Profit Before the Next Run to 4400?It feels safe to bid for BINANCE:ETHUSDT at 4100 right now and ride it up to 4400.
I will place my SL at 3.8k
Ignore this trade update if you don't know about position sizing and order scaling.
Let's see if this will cook.
What are your thoughts about this analysis? Let me know in the comments section.
If you like the analysis, like it and follow me for more trade updates.
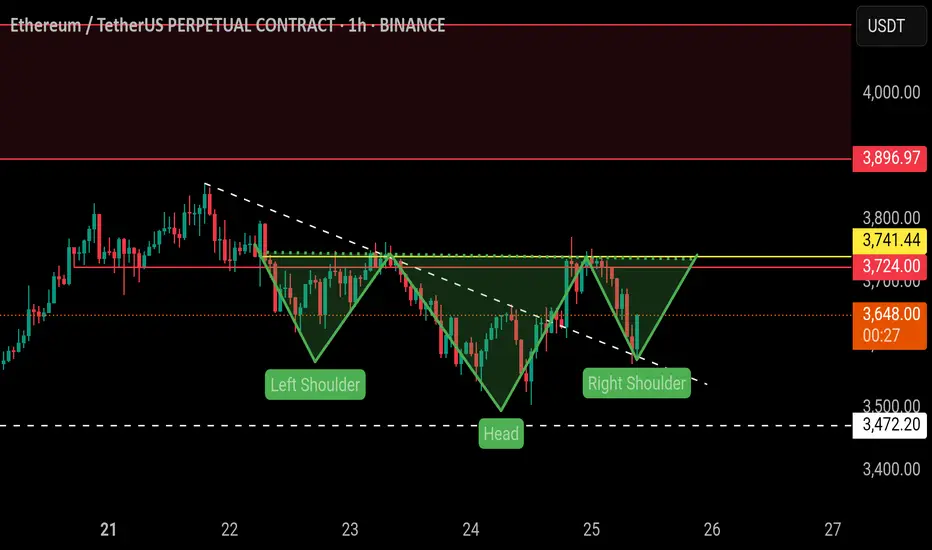
$ETH | Ready to fly (Inverted head and shoulders)BINANCE:ETHUSDT.P
On 1H TF, the price is forming inverted head and shoulders pattern, which is a strong bullish pattern.
The price has retested the trendline support and bounced back.
Expecting it to breakout above yellow line soon.
A breakout above the yellow line will be a bullish and pattern confirmation.
We can initiate a long entry from here.
Please do proper risk management and must use stop loss.
NFA, DYOR
Ethereum's Hits New All-Time High · Next Target $7,332Ether (ETH) is approaching its 2021 all-time high and wow!, this is awesome, think about it. One day we are witnessing a correction, Ethereum crashing for years lower below $2,000 and then even lower, below $1,500 and then what? After just several months Ethereum is already trading way high above $4,500 and ready to hit a new all-time high, catching up to Bitcoin and XRP; the rest of the altcoins market will follow.
Yes, a new all-time high but that was never the goal. The previous peak is only a resistance point, a reference point which we use to know how good we are doing, how far advanced we are in the current cycle but it is never the end. The all-time high is meant to be broken in each cycle and this is exactly what we are seeing today.
As soon as ~$4,900 breaks, ETHUSDT is likely to continue to straight up to face resistance right around $6,000. Stops should be just like the past. A few days red or sideways then back green. Always up with maximum force, the entire move.
The main resistance for this current advance is $7,332 but for the current cycle, new and updated numbers based on current market action and fresh data suggests that $11,318 is a possible target based on standard cryptocurrency bull market action. That is, we don't even need an extraordinary bull market to make Ethereum worth $11,111 per Ether token.
Ok. Market conditions look great. It's been a long ride... We've been tracking Ethereum for so many years now and this entire bullish recovery, cycle and wave. Let's continue to ride the market together... Let's trade!
Namaste.

ETH SHORTETH has gotten bearish recently by breaking 100 and 50 ema as well as creating a big bearish liquidity void
I have analyzed a 4H supply area which matches 3Day POC and hence why I will be placing my entries there.
Feel free to comment !

ETH - short to 4k, then 20k by ChristmasETH bollinger meridian band lining up with recent upward trend.
With institutional investors pigging out on Ethereum for the past few months, and the historical pattern of ETH all time highs, I expect a short term downtrend to 4000 and then shooting up towards 20k by Christmas.
Happy trading!
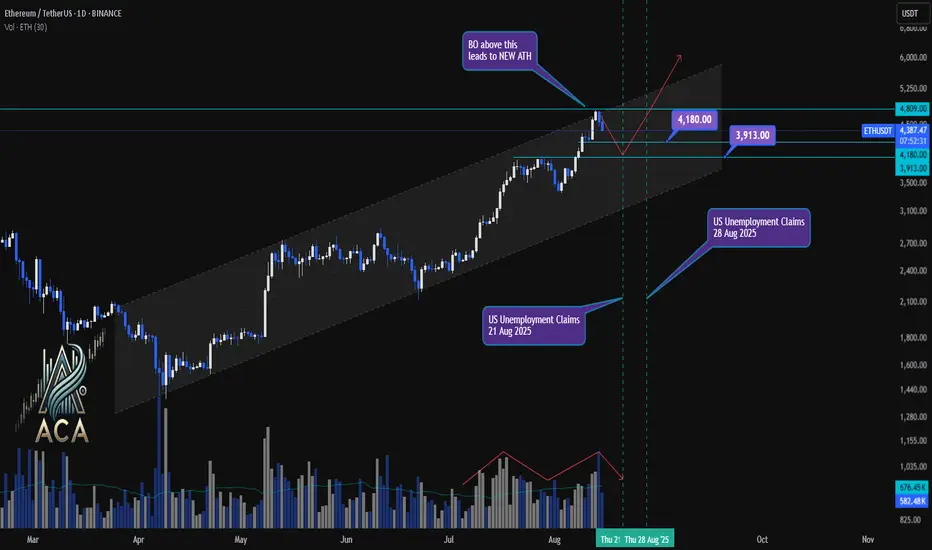
ETHUSDT 1D Chart Update | Channel Structure, Economic EventsETHUSDT 1D Chart Update | Channel Structure, Economic Events & ATH in Focus
🔍 Here’s the latest breakdown of ETH/USDT price action on the daily chart—channel dynamics, correction levels, and upcoming catalysts.
⏳ Daily Overview
Ethereum is trending strongly within an ascending channel, respecting both mid-level and upper resistance. After a local correction, price is rebounding with sturdy volume participation—signaling renewed interest from buyers.
📉 Correction Levels & Volume
- Recent correction found support at the $3,913 zone, with the $4,180 mark now acting as next key level.
- Volume has picked up on bullish candles, confirming the strength of this bounce.
- Correction appears healthy: price stayed within the channel, higher lows maintained.
📊 Channel, Economic Events & Breakout Setup
- ETH continues trading inside the established channel, posting higher highs and higher lows.
- Two major US economic events ahead—Unemployment Claims releases on Aug 21 and Aug 28, 2025—that could trigger volatility.
- Watch for a breakout (BO) above $4,809: crossing this sets the stage for a new all-time high (ATH).
🎯 Key Levels & Scenario
- $3,913: Correction support zone; ideal spot for high RR (risk/reward) long entries if retested.
- $4,180: Immediate resistance; flipping this could attract trend-following bulls.
- $4,809: Channel top and major breakout threshold. If price closes above, expect acceleration toward new ATH territory.
🚨 Conclusion:
ETH is pushing firmly inside its channel, with correction and volume patterns favoring bullish continuation. Key economic events may provide the volatility needed for a breakout move. Above $4,809, watch for new ATHs; dips to $3,913–$4,180 offer attractive re-entry zones for aggressive traders. Stay adaptive as August catalysts unfold.