ETHUSDT analysis - 1H FVG and OB SetupsETH has recently rejected from the 4,370 area, showing signs of short-term exhaustion.
On the 1H chart, a clear FVG is located around 4,100, which could act as a liquidity target if selling pressure continues.
Below that, we have a strong Bullish OB around 3,900, aligning with previous demand and potential reversal interest.
If price retraces into the FVG zone (4,100) and shows bullish reaction in lower timeframes, short-term buys could be considered targeting 4,300 – 4,370.
A deeper move into the OB at 3,900 would be a high-probability long setup for swing traders, with upside potential toward 4,500.
For now, structure remains bullish on higher timeframes, but short-term correction is possible before continuation.
📊 ProfitaminFX | Gold, BTC & EUR/USD & Crypto
📚 Daily setups & educational trades
ETHUSDT trade ideas

ETHUSDT 4H Breakout: Symmetrical Triangle Targets AheadMEXC:ETHUSDT
Key Elements:
Pattern: The chart shows a symmetrical triangle pattern formed by two converging trendlines connecting the highs (resistance) and lows (support). The breakout appears to have occurred upward from point D, with a measured move of 1.683 times the height of the triangle (from 0.619 to 4.49).
Price Levels:
Entry/Breakout Point (D): Approximately 4.49.
Stop Loss: Set at 4,333.59, just below the upper trendline and recent high.
Targets:Target 1: 4,047.34.
Target 2: 3,963.67.
Target 3: 3,651.82.
The price range spans from around 3,250 to 4,500 USDT.
Indicators:The triangle's height (0.619) and the breakout move (4.49) suggest a calculated target projection.
Green and red candlesticks indicate bullish and bearish periods, respectively.
Analysis:The upward breakout from the triangle suggests bullish momentum, with the price potentially aiming for the listed targets.
The stop loss at 4,333.59 is strategically placed to limit downside risk if the breakout fails.
The targets decrease incrementally, indicating a possible profit-taking strategy as the price progresses.

ETH Setup – Correction Ending? Big Bullish Move Loading?#ETH is currently in a downtrend on the higher time frame, completing a healthy correction. On the 1H chart, we can clearly see:
✅ Bullish divergence forming
✅ Price testing a strong support zone
✅ Buyers stepping in at key levels
These are strong signs that #Ethereum may be preparing for a bullish reversal. If momentum continues, #ETH could potentially aim for new ATHs in the coming months.
Trade Plan
Wait for a clean breakout above the resistance level
Confirm with a successful retest
Enter long positions with proper risk management
Remember: patience is key! The confirmation breakout will give us the highest probability entry.
What’s your #ETH outlook? Do you think we’ll see new ATHs this cycle or more downside first? Drop your thoughts in the comments!
#ETH #Ethereum #Crypto #Altcoins #BTC #Trading #PriceAction #TechnicalAnalysis #CryptoTrading #Breakout #Bullish

Ethereum has successfully breached its all-time highEthereum has successfully breached its all-time high, closing the weekly candle with strength above the barrier. This breakout marks a significant structural shift in price action, reinforcing the broader bullish trend that has been in place for months. While lower-timeframe charts show some rejection from the all-time high, the higher-timeframe perspective remains extremely constructive, with conditions favoring continuation higher as long as critical support levels hold.
Key Technical Points:
- All-Time High Breakout: ETH has closed above its prior all-time high, signaling renewed bullish momentum.
- Key Weekly Support at $3,800: This level aligns with the 0.618 Fibonacci retracement, creating a strong confluence support zone.
- Trend Structure Intact: Ethereum continues to print higher highs and higher lows, keeping the broader trend bullish.
The weekly close above the all-time high is a major milestone for Ethereum, representing a breakout from a psychological and technical resistance that has capped price action for months. Although short-term intraday charts show rejection wicks near the highs, the ability of bulls to maintain acceptance in this region is a positive sign of underlying demand.
The $3,800 zone stands out as the next major area of interest should Ethereum undergo a pullback. This level is particularly important given its confluence with the 0.618 Fibonacci retracement, a level often associated with healthy corrective reversals before continuation. A reversion into this zone would not invalidate the broader trend, but rather provide a buying opportunity for swing traders looking to position for higher targets.
Volume remains the key confirming factor for sustainability. While the breakout has been significant, follow-through requires increasing bullish participation. If buyers can back this breakout with continued volume expansion, the path toward price discovery and significantly higher valuations opens up. Conversely, failure to see volume confirmation could lead to temporary consolidation above the prior high, but the structural bullish bias would remain intact.
From a trend perspective, Ethereum has shown resilience by consistently printing higher lows and reclaiming previous resistance zones as support. This pattern underscores the strength of the current rally and points to the likelihood of continued bullish pressure in the weeks ahead.
What to Expect in the Coming Price Action:
Ethereum is positioned for further upside as long as it holds acceptance above its prior all-time high. A healthy pullback into the $3,800 support zone would be considered a strong buy opportunity, with the broader trend pointing toward consecutive higher highs. Traders should monitor volume closely, as a strong influx of participation will confirm the breakout’s validity and fuel continuation into new discovery levels.

Basssssssssss Ethereum!If we can close above $5,000 for the week, then the targets are on the table! Come on, Ethereum, start the altcoin bull run!

ETH hit new ATH what’s next? While Ethereum ( CRYPTOCAP:ETH ) has just achieved a new All-Time High (ATH), its price action is currently challenging a significant weekly resistance level. This level corresponds to the upper boundary of its established upward channel. The coming hours/days will be critical, testing the underlying momentum necessary to sustain the breakout or if a retracement is imminent.

ETHUSDT - IdeaPrice consolidating within this channel since ETH made ATH, could it be possible that we see a new high next week?
The speculators would like to think we're going to 10k but realistically, what is everyone's EOY target for ETH?
Do keep in mind September has been a bad month for ETH since inception, can it be different this time around?
"ETH's price history reveals a persistent and often brutal September pattern. Since 2016, ETH gains in August are regularly wiped out in September. In 2017, ETH rallied 92% in August, then dropped -21.65% in September, after China announced a ban on ICOs."

eth short?Even though Ethereum is so strong, I would like to see it reach $4,500 again and then go up to $7,000. If not, I am willing to lose a little capital.

Ethereum's ATH: What's Next?Ethereum recently hit a new all-time high (ATH), but its upward momentum has met a significant resistance level. Based on this technical signal, there is a possibility that the price could pull back and correct to a support range of approximately $4,121 to $3,936.

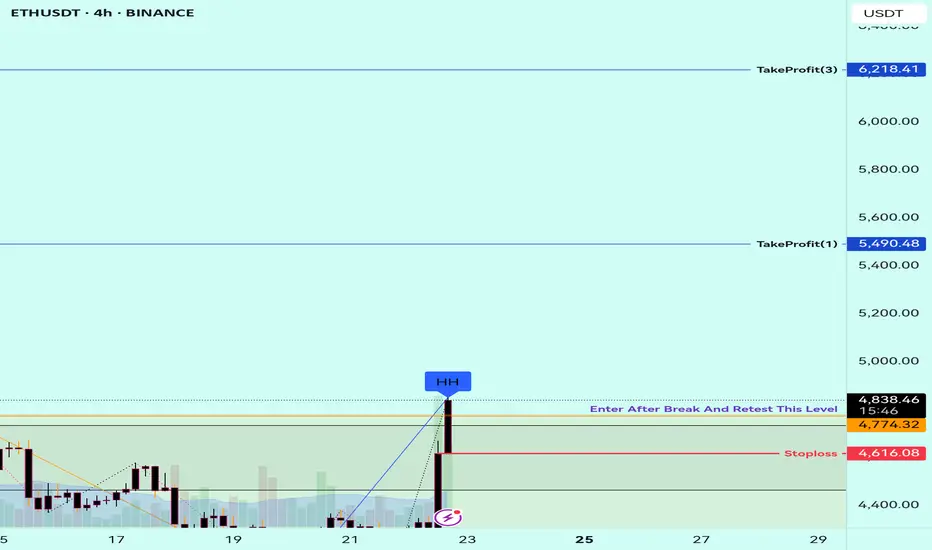
ETH (1D) – Medium-term TargetsETH continues to respect the daily uptrend and bounced cleanly off support. Key breakout level is 4,808 - above here opens Fibonacci extensions toward 5,007 → 5,261 → 5,541.
Pullback support sits in the 4,441–4,651 zone (0.5–0.786 retrace). As long as this area and the trendline hold, bias remains bullish into the 5.25–5.55k supply band.
Invalidation: Daily close below 4,441.
Bias: Bullish while above trendline.
Note: Note a financial advise

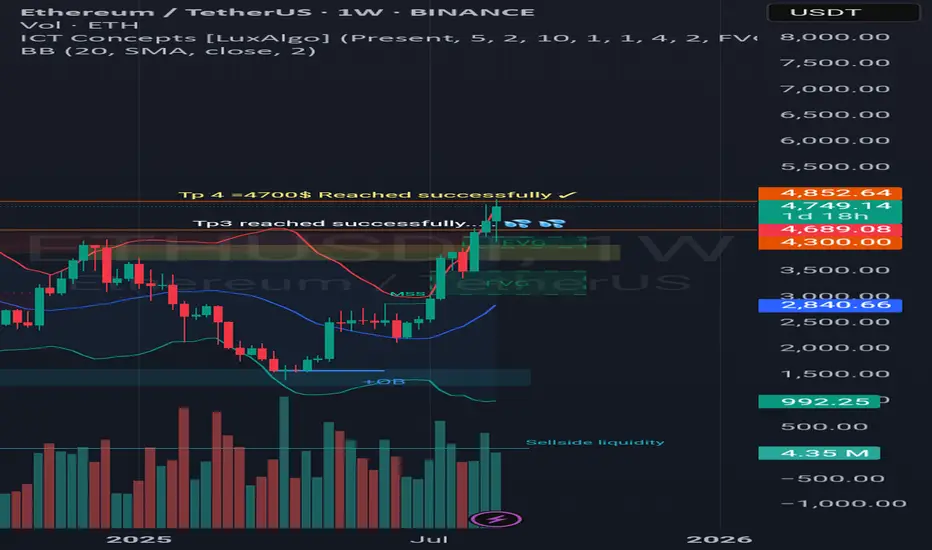
Update of analysis of ETH/USDT Hello sexy friends, ETH very successful filling the tp4 and get to 4700$.
Next TP is over the 10,000$
The goal is coming soon... please wait spring is near ... 💋
ETH 4H👁️This is an untradable zone. Although short positions are possible, it's not advisable to trade bearish pullbacks within an uptrend with strong fundamentals. The 4500 zone seems attractive to me; it's worth monitoring closely to rejoin, gauging mass sentiment and predicting market-makers' moves.

this is how I see $ETH 1D OBV Ethereum 1D OBV break out . How I view the OBV which is a leading indicator. Ethereum to 7k

Ethereum (ETHUSD) – Technical Outlook with Key FundamentalsDescription:
Ethereum (ETH) is the second-largest cryptocurrency by market capitalization and a leading blockchain for decentralized applications, smart contracts, and DeFi ecosystems. Its network is continuously evolving, with Ethereum 2.0 upgrades focusing on scalability, security, and sustainability. Market participants often view ETH not only as a digital asset but also as a fundamental infrastructure for the Web3 economy.
This analysis highlights potential technical levels and market structure for ETH. Traders are closely monitoring price action to assess possible continuation or reversal scenarios, taking into account both short-term momentum and broader market conditions.
⚠️ Disclaimer:
This content is for educational and informational purposes only. It does not represent financial advice or investment recommendations. Always conduct your own research and risk management before making trading decisions.
ETH - Ranges overviewWe’ve finally broken through 4K on ETH and we are currently trading around new highs.
From here let’s see how we play out.
IF we break through 5K and hold expect us to continue higher towards new all time highs at 6K and higher - on the longer term.
IF we fail to hold the “support” (sellside liquidity) around 4K-3.5K expect us to trade back lower.
As always when in new highs territories…do not BECOME A VICTIM OF EUPHORIA.
Position yourself and be PATIENT. THE MARKET WILL SHOW YOU ITS HAND.
Stay safe and never risk more than 1-5% of your capital per trade. The following analysis is merely a price action based analysis and does not constitute financial advice in any form.

Ethereum held key level ┆ HolderStatOKX:ETHUSDT is retesting the $4000 breakout level after a 14% pullback. With strong bullish structure and flag formations in the past, this level acts as key support. If it holds, ETH could aim for $4780 next, with $5000 as the larger target.

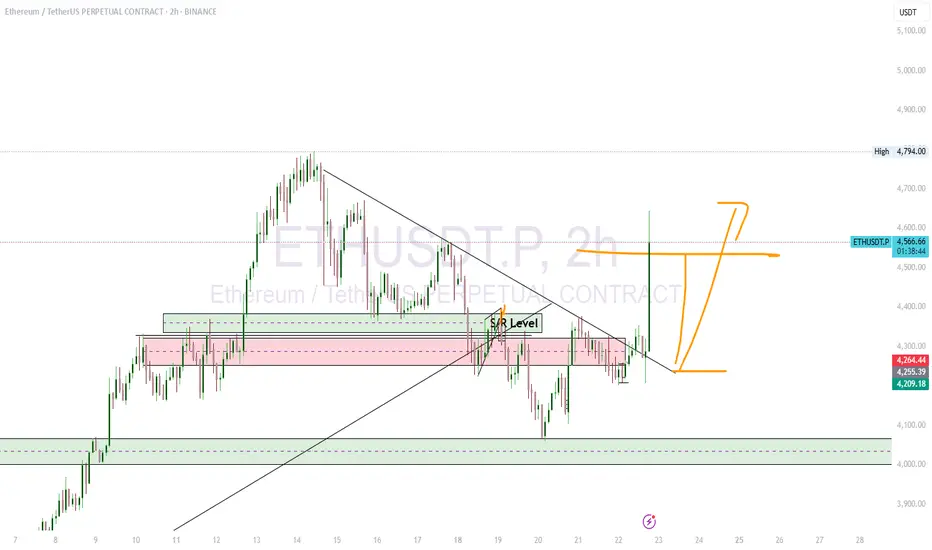
ETH/USDT Chart Analysis CRYPTO:ETHUSD ETH/USDT shows a strong upward move after a period of consolidation and a breakout from a descending trendline.
Bullish Momentum: The price has moved significantly higher from the S/R level and is currently trading at the higher end of the recent range.
Impulsive Move: The recent candle is a large green candle, indicating strong buying pressure and an impulsive move to the upside.
Potential Pullback: As mentioned in the previous analysis, the price may experience a pullback or a retest of the broken trendline. The strong move up could be followed by some profit-taking before a continuation of the trend. This is a common pattern in breakouts.
Key Levels: The price action confirms that the S/R level around $4,284 is a critical area. As long as the price stays above this level, the bullish structure remains intact. A break below this level could signal a false breakout and a return to the previous range.
ETH RangeI'm looking for something like this on ETH. A distribution into supply that turns into an accumulation to maybe even target the highs. I'm waiting for confirmations/invalidations and confluence via BTC and USDT.D. But there is also better demand below. If i don't see accumulation here i will target lower.

ethereum very bullishEthereum is finally starting to show its worth. It has received so much hate, but it will skyrocket again. Get ready.

For those who are long-term investors (not short-term traders), ETH maintains the key support at $3,800—which appears to be a critical Fibonacci and horizontal level—we could indeed see a bullish move toward $5,000, representing about a 16% gain from current levels. This target makes sense technically, as it would test the prior all-time high area and potentially break the descending trendline visible on the chart.
For those who are long-term investors (not short-term traders), you can consider buying ETH in parts from the current price (~$4,300 range) down to $3,850 to average in on any dips, while setting a stop loss at $3,800 to protect against a breakdown. This strategy allows for dollar-cost averaging into strength if the uptrend resumes or weakness if it tests support, but always manage position sizes based on your risk tolerance.

Analysis update.As we mentioned in yesterday’s analysis, the price stuck to the upper boundary of the higher timeframe channel and showed a tendency to break upward. With one candle, it finally broke above the channel, and now we should wait for breakout confirmation before considering a long position.


ETH - 1H Elliott Wave Analysis - 21.08.25Greetings and welcome to another Ethereum analysis.
For Ethereum we got two scenarios. Both bullish.
Case 1:
We assume the last top which we created during the 14th of August was our blue Wave 3 and the recent correction our blue Wave 4 as red ABC. The Wave 4 support area goes down to the 0.618 FIB at 3976 USD which is the invalidation of this scenario. Next we want to see a bounce which would start the blue Wave 5 which should take us to new ATH.
Case 2:
Alternatively we could count the blue 5 wave move up finished in which case the blue Wave 3 would be the blue Wave 5 and the move up was our white Wave 3 which means we started the white Wave 4 correction. In this scenario we assume the move down was only the yellow Wave A of a bigger correction as yellow ABC. The yellow B could be in but we think this would be a rather shallow and short B so we doubt it has finished already. We also want to make aware that we were very close to making a new ATH which could lead to the B Wave to overshoot and take out the ATH before starting the Wave C down.
We do lean towards the 2nd scenario where we would see a deeper correction as yellow ABC which would take us to the price area of 3300 USD to 4000 USD. For further clarity we need to observe the price action on the lower timeframes but at the moment it looks rather corrective than impulsive which would fit case 2 better. Short term we would like to see a bounce in either case.
Thanks for reading.
NO FINANCIAL ADVICE.
