ETHUST.P trade ideas
SHORT ETH🔷 Setup Summary: SFP + Key Volume Combo
1. Context:
Pattern: Double Top + SFP (Swing Failure Pattern)
Timeframe: Likely M15–H1 (possibly during Asian/European session)
Background: Price breaks previous high slightly (liquidity grab), then sharply reverses — a clear trap.
2. Confirmation:
A clear Key Volume candle appears at the top — signaling market maker action.
A strong rejection candle (pinbar or engulfing) confirms the SFP.
Price fails to hold above the new high — trap confirmed.
3. Entry Strategy:
Entry: After the SFP confirmation candle closes.
Stop Loss: Above the SFP high or Key Volume wick (a “valid” SL, not necessarily tight).
Take Profit:
Short-term: 3R (if trading intra-session).
Long-term: Target demand zone or Daily support if trend supports it.
4. Risk Management (per system guidelines):
Max risk per trade: 1–2% of account.
If setup invalidates: cut the loss immediately, don’t widen SL or overtrade.

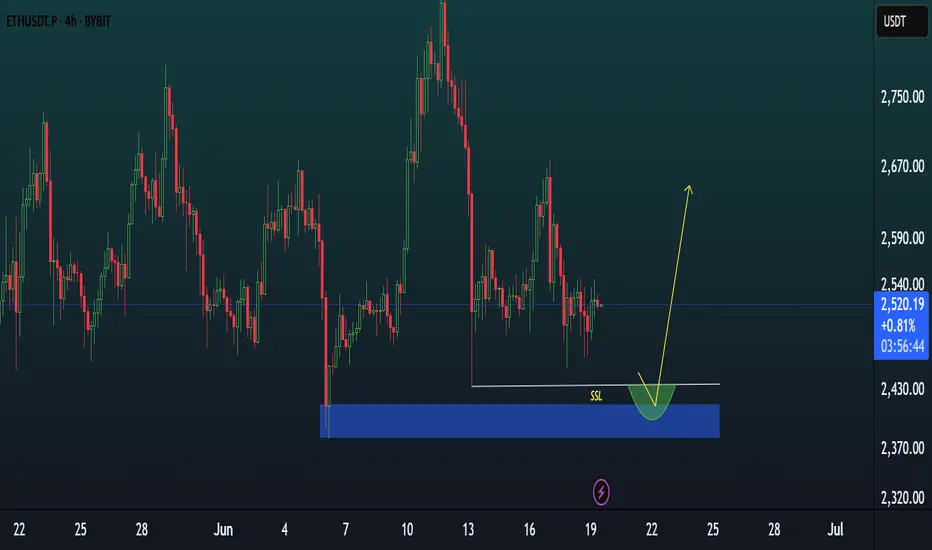
Update on ETHTP hit quicker than expected.
LTF intraday is currently short. Targetting the area where the HTF is more likely than not kicking in for the next leg towards the upside!
Not financial advice.
Onwards!
CRYPTO:ETHUSD
CRYPTO:BTCUSD


Ethereum, Bullish Breakout Expected Any Moment Now!Look at this, the first peak for Ethereum happened 13-May after the start of the recovery and the end of the downtrend. The lowest point happened five days later on 18-May and there has been no new lows since. Ethereum has been in a bullish consolidation pattern, a classic bullish flag.
This kind of dynamic clearly reveals a bullish bias and certainly, Ethereum is already trading pretty low compared to its last high.
A new and most interesting signal comes from the stock COIN, for Coinbase. This stock went ahead and produced a very strong bullish breakout yesterday with a green candle reaching +16%. COIN's chart and ETH are almost identical, exactly the same. Since these two move together, we can expect Ethereum to follow suit and do the same. We can expect a bullish breakout to happen any day now. Consolidation has been going long enough. It is time for the market to grow.
Some of the smaller altcoins continue to move forward, this is a signal that should not be ignored.
Namaste.

ETH: Short 19/06/25Trade Direction:
ETH Short
Risk Management:
- 0.5%
Reason for Entry:
- Failure to reclaim weekly open
- Loss of weekly open, monthly open, and Monday low
- H2 timeframe oversold but within a reclaimed bearish order block
- Clear bearish grind price action aligning with higher timeframe bearish trend
- Higher confidence in shorts at current level than higher up
Additional Notes:
- Total market cap looks heavy, global situation especially middle east is continuing to see a risk off mindset for risk assets like crypto.
- Until price gives me a reason not to have to assume this is continuing bearish.
- Potential to short higher if this fails

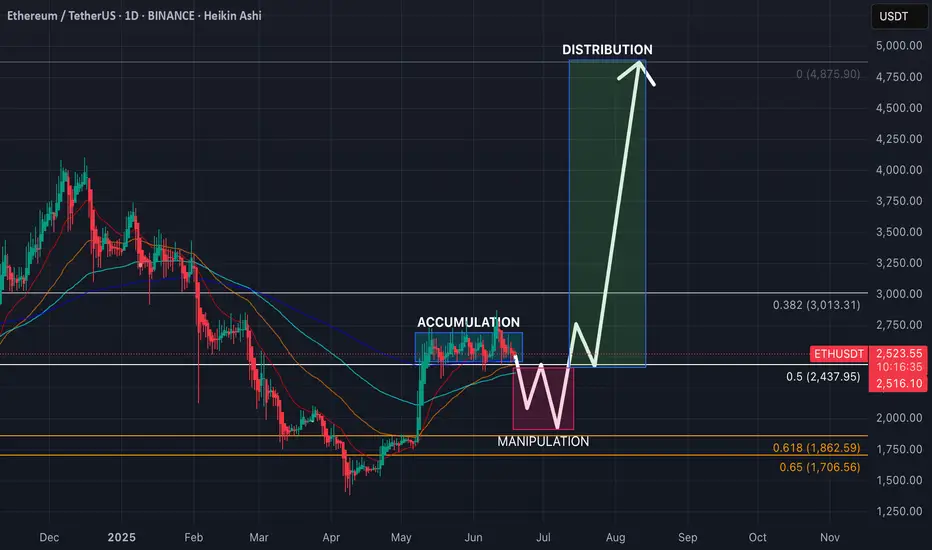
ETH: 6th consolidation week, AMD!?Ethereum is super slow these days, ranging tightly between $2430 and $2800 for weeks after a recovery. Current price action shows signs of preparation for the next BIG move, but in what side!?!!
Let’s break this down using the AMD model:
🔸 Accumulation
We saw ETH bottoming out in April after a deep correction. Since then, price reclaimed the 200 EMA and consolidated just above the 0.5 Fib level at $2437. This horizontal zone has been the accumulation range base.
🔸 Manipulation
Currently, ETH is testing the lower part of this range. Based on the chart structure, a possible liquidity squeeze breaking $2437 (mid-level) so we expect bearish trap for late sellers and non-believers before a viiolent reversal. This would be the classic “spring” move often seen in Wyckoff chart structures.
🔸 Distribution (later stage)**
If (or when) ETH breaks above $2800 and gets new attention with strong volume, this can lead to a mind blown fuses expansion — targeting the psychological $3000 and after recovery to previous ATH zone. Previous ATH at $4875 is the main target. Reasonably, this would be the final stage of distribution before a probable pump and altseason madness starts. But we are far for that right now, expect it not earlier than mid-autumn.
🧠 Key Technicals:
Okay, my Heikin Ashi candles show weakening — which means that we are close to the start of the Manipulation phase.
RSI pulling back, resetting momentum for the next move.
Fibonacci zones:
0.5 = $2437
0.618 = $1862
0.65 = $1706
🔮 Trade Idea (not financial advice):
A fake move below $2437 followed by fast and immediate recovery would be an ideal long entry.
Cancel trade if daily close below $1860, we can get lower this time.
TP? Well, depends on your belief. If btc made almost 2x from previous high, $3000 / $3500 / $4000 / $4500 / $5000 could be good? ETH could see even 8-8.5k this cycle, but its super positive outlook on current market structure.
📊 Summary:
ETH is showing classic AMD structure:
Accumulation (in progress for 6 weeks, 6 fn weeks!) ⏳
Manipulation (going down) 📉
Distribution (recovery + growth) 🚀
Some while ago, ETH was already playing simillar games, so why it should be different this time?
Breakout will come only after weak hands are shaken out, only after retail traders will sh*t their pants we will see growth.
Hopefully we will see immediate growth from current levels, but I'm more realist this time.
Ciao!
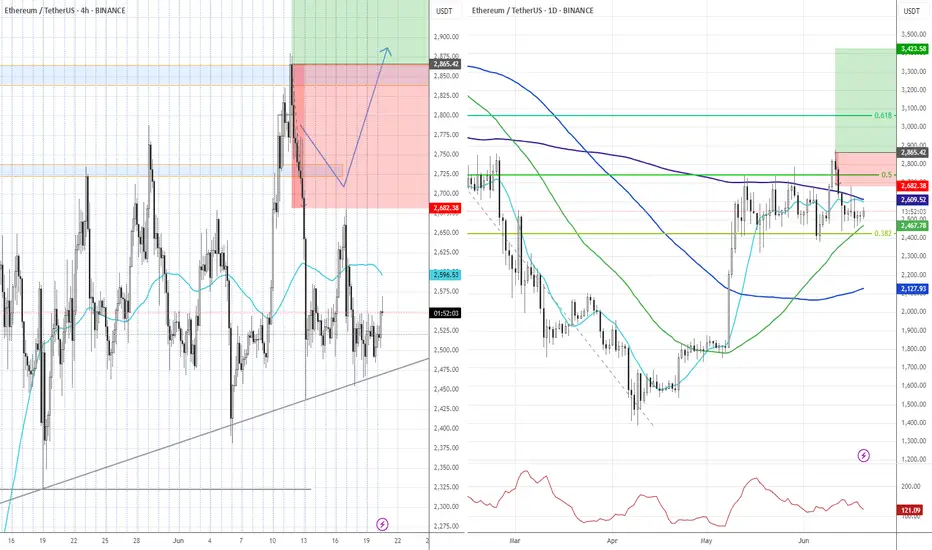
Potential Long Setup for EthereumEther stabilized in a slightly positive trend after breaking the previous uptrend. Since mid-May, this flattish trend channel has continued, offering some trading opportunities within it.
When Ethereum approaches the lower line and the 50 EMA crosses above the 50 SMA, an ETHUSDT surge has followed each time since the channel formed. Traders could expect a similar move again. However, the key risk is potential negative pressure on stock markets due to geopolitical concerns and the correlation effect on the crypto market and a break of the channel.

ETH-----Buy around 2530, target 2580 areaTechnical analysis of ETH contract on June 19:
Today, the large-cycle daily level closed with a small positive line yesterday, the K-line pattern was a single positive line with continuous negatives, the price was below the moving average, and the attached indicator was dead cross. The big trend of decline is still very obvious, but for now, the continuation and strength are relatively poor, which is also the reason why the price is simple and easy to wash; the short-cycle hourly chart yesterday's European market price fell and did not break down, the US market price supported the rebound, the current K-line pattern is continuous positive, and the attached indicator is golden cross, so there is a high probability that it will rise and break the high during the day.
Today's ETH short-term contract trading strategy:
Buy at the current price of 2530 area, stop loss at 2495 area, and target 2580 area;

Ethereum Daily Chart = Coiled SpringSitting on the 200 EMA.
3x liquidity sweeps below — no breakdown.
Red dots stacking above = pressure cooker.
📉 Break $2.45K → dump
🚀 Break $2.7K → $3K squeeze
Big move coming. Don’t blink.

HolderStat┆ETHUSD accumulationBYBIT:ETHUSDT is compressing in an ascending triangle, pivoting around 2 500. A decisive break above 2 520 tees up 2 800–2 900 continuation, while closing back under 2 430 would negate the immediate setup but leave macro structure bullish.

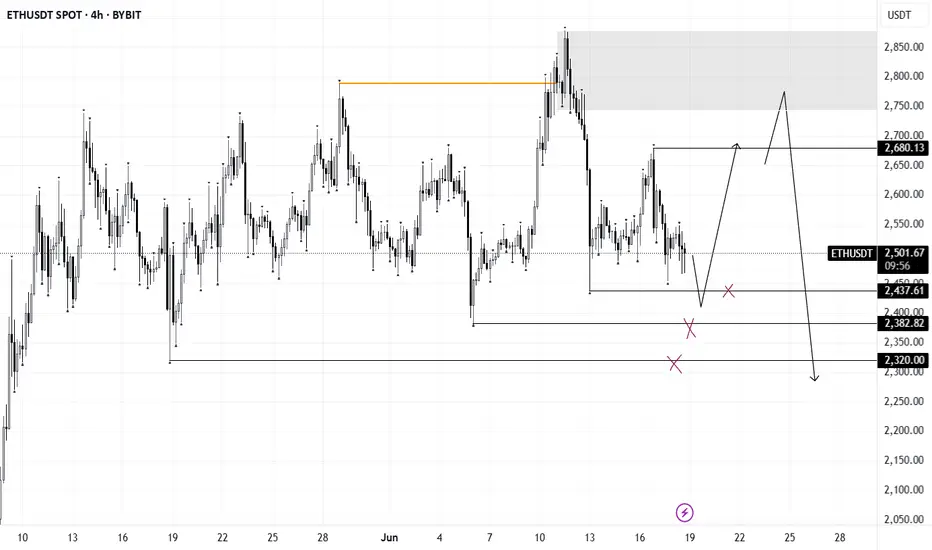
$ETH / USDT – 4H Time Frame Analysis 3,000 INCOMING?? CRYPTOCAP:ETH / USDT – 4H Time Frame Analysis
Structure: Bullish Flag | Outlook: Neutral-Bullish | Target: $3000?
🔹 Chart Overview
-Pattern: Bullish Flag (continuation structure)
Current Range:
- Supply Zone: $2,680.00 – $2,786.21
- Demand Zone: $2,319.79 – $2,417.61
Price Action:
- Tight consolidation between higher lows and lower highs, forming a symmetrical triangle within a flag structure.
Trend:
- Consolidation, but within a macro uptrend (prior strong rally).
Volume Profile:
- Anchored Volume shows high participation around $2,540–$2,600.
OBV:
- Flattening, signaling indecision and potential energy buildup.
Key Psychological Levels:
$2,860: Minor resistance from past S/R flips.
$3,000: Major round-number psychological resistance.
📐 Technical Confluences
Fibonacci Retracement:
- The 0.618 golden pocket aligns with the support trendline, reinforcing this as a critical zone.
Fair Value Gaps (FVG):
- Above Price: Acts as a magnet in bullish continuation.
- Below Price: Risk zone if price drops; aligns with liquidity and trendline support.
- Liquidity Zone: Aligned with 0.5–0.618 retracement; strong reaction expected.
📈 Bullish Scenari o
Breakout of Pennant Resistance:
- A clean break above $2,786 (supply zone & swing high) with volume.
Close above Upper FVG and Liquidity Zone:
- Confirms bullish intent. Targets psychological level at $2,860, then $3,000.
Volume Confirmation:
- OBV uptick and high breakout volume would validate the move.
Bullish Target Zones:
TP1: $2,860 (psych level + previous resistance)
TP2: $3,000 (major psychological level)
TP3: $3,120–$3,180 (1.618 Fib extension)
📉 Bearish Scenario
Rejection from Current Supply or Liquidity Zone:
- Fails to break above supply; rolls over from the upper pennant line.
Break Below Support Trendline:
- Break below golden pocket and $2,417.61 demand zone.
Invalidation of Bullish Flag:
- A breakdown below $2,319.79 (swing low) invalidates the bullish flag and may signal a trend reversal.
Bearish Target Zones:
TP1: $2,200 (local volume gap + structure support)
TP2: $2,060–$2,120 (previous accumulation zone)
TP3: $1,950 (macro support & last strong demand)
✅ Summary
Structure:
- Price is compressing within a bullish continuation pattern, awaiting breakout confirmation.
Bias: Slightly bullish unless the swing low at $2,319 is broken.
Confirmation Needed:
- Break above or below pennant boundaries with volume.

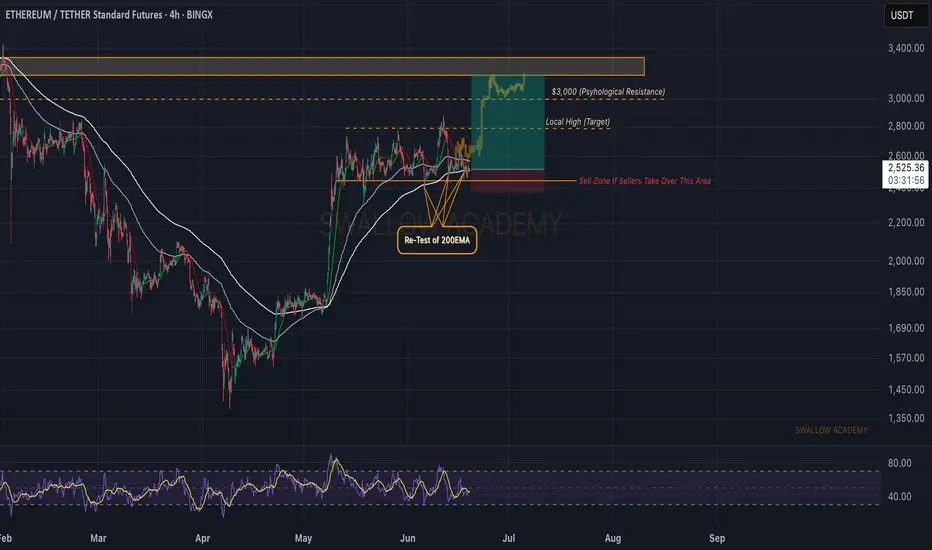
Ethereum (ETH): Golden Buy Zone | Buyers Taking ControlBuyers are taking control near the 200EMA, which could give us a really good bounce to upper zones from here on.
We see whales accumulating the ETH, which confirms our saying that Ethereum has not yet reached its potential.
The key zone is the 200EMA as of now.
Swallow Academy
ETH NEXT BUYZONE.ETH has created a wick and below that is a huge liquidity cluster. I want price to fill that liquidity cluster and then upside.
ETH - BOOM or Toink?Okay Mostly boom down, but a toink to get over most peoples liquidity and get sorted up, the probable move is this as per me

Crypto at a Crossroads: BTC, ETH & SOL – 3 Charts, 3 Messages📊 Market Overview:
The crypto market often moves together — but BTC, ETH, and SOL are telling 3 very different stories right now. From Bitcoin’s coiled spring to Ethereum’s indecision and Solana’s struggle — this divergence could define the next major trend.
1️⃣ Bitcoin (BTC): The Market’s Trigger
BTC is tightening in a Symmetrical Triangle after a powerful uptrend — a textbook Bull Pennant.
🔼 Lower highs + higher lows = pressure build-up
🔇 Volume drying up → classic pre-breakout setup
⚡ A decisive move (esp. above $ 108K) will likely lead the entire market
Bias: Bullish continuation likely, but prepare for either direction.
2️⃣ Ethereum (ETH): The Waiting Game
ETH is stuck in a rectangle range between $ 2,450–$ 2,800.
😐 Flat MAs = no short-term trend
📉 ETH is neutral → waiting for BTC to move first
Strategy: React to breakout or breakdown from range boundaries.
3️⃣ Solana (SOL): The Weakest Link
SOL shows clear signs of reversal and relative weakness.
⚠️ Double Top near $185 in May
🔻 Lost multi-month trendline
🛡️ Testing critical support at $ 140–145
🌀 Attempting a Rounding Bottom (accumulation?) but still below key MAs
Watch: Support must hold. Break below = major downside risk.
🎯 Trade Strategy:
If BTC Breaks Up (above $ 108K):
🚀 Long BTC → Targets: $ 118K–$ 120K
✅ Long ETH above $ 2,800
🧨 Aggressive Long SOL above $ 160 (trendline reclaim)
If BTC Breaks Down (below $ 104K):
⚠️ Short BTC → Targets: $ 100K, $ 98K
⚠️ Short ETH below $ 2,450
🚨 High-conviction Short SOL below $ 140 → Potential drop to $ 100 zone
❌ Invalidation:
📉 Bullish thesis invalid if BTC breaks below triangle
📈 Bearish invalidated if BTC breaks up (Stop loss above $112K)
🔚 Final Word:
BTC is the market’s steering wheel — ETH is parked, SOL is stalling.
⏳ The triangle is near apex. A breakout will ripple across all coins.
Which direction are YOU betting on? Bullish or Bearish? Drop your view below!

Coinbase #COIN gives a hint for crypto Coinbase #COIN gives a hint of what path awaits #ETH in the coming days

ETH/USDTETH remains in a consolidation phase. Attention is on the nearest liquidity zone — a sweep or reaction here could signal the next move. Failure to reclaim and hold above the $2600 level on the weekly close opens the door for a potential drop into the $2000–$2300 range, aligning with a possible manipulation phase before reversal.
Longs or shorts only considered upon clear confirmation and valid setup. No rush — let the market come to you.
ETH – Rounded Distribution Before the Punch Higher?What we’re seeing here is a potential fakeout setup within a value zone.
Notice the rounded top formation — looks bearish — but price refuses to break the low. This often sets the stage for a sharp reversal.
Structure Breakdown:
Volume profile shows acceptance in current range
Rounded top shape implies weakness — but no breakdown = trap potential
Price holds a higher low inside the range = absorption
Green box marks ideal long entry area — well-defined invalidation below
Bullish case:
We’re watching for that reclaim of the mid-level → quick push into the upper range
Target zone = 2,618 (clean inefficiency fill + local top)
Bearish trap scenario invalidated if price closes below red box (stop hunt level)
Strategy bias:
This is a compression-reversal trap — fake weakness to trap shorts, then launch.
Patience pays here — if it reclaims and consolidates at the mid, it’s time to ride.
📊 More setups like this, early in structure, are shared inside the account description. Tap in for the breakdowns.

ETH | BULLISH Pattern | $3K NEXT ??Ethereum has established a clear bullish pattern in the daily as we're seeing an inverse H&S:
The war issues across the globe must also be considered. So far, it's been bullish for crypto but this can also change overnight since it's a very volatile situation - and crypto being a very volatile asset.
For the near term, I believe ETH is due for another increase - at least beyond the current shoulder. This is IF we hold the current support zone:
It seems to be a bit of a slow burn with ETH for this season's ATH. In the ideal world, we'd either:
📢 consolidate under resistance (bullish)
📢make a flag (bullish)
📢OR smash right through the resistance.
But there's likely going to be heavy selling pressure around that zone.
__________________________
BINANCE:ETHUSDT

ETH at critical levelsCRYPTOCAP:ETH is at the bottom of the structure, great risk-to-reward ratio. However, the bearish thesis needs to consider a dip to 2kish level. To make the DCA strategy work best, buying on dips is vital.
Full TA: Link in the bio

ETH(20250618) market analysis and operationTechnical analysis of ETH contract on June 18:
Today, the large-cycle daily level closed with a small negative line yesterday, and the K-line pattern continued to fall. The price was at a high level but had no strength and continued trend. Instead, it was easy to fall under normal pressure. The attached indicator was dead cross, and the big trend was still very obvious. In this way, we are more optimistic about the price continuing to fall and breaking the low point in the future; the short-cycle hourly chart fell continuously yesterday, and the European session continued to break the previous day's low point in the US session. It is still in a corrective trend, but according to the current trend, it is highly likely to continue today. Whether it can break down the low point of last week needs to be paid attention to. There is no room for operation during the day, so wait and see today, focusing on the strength and weakness of the European session and the unemployment data in the evening.

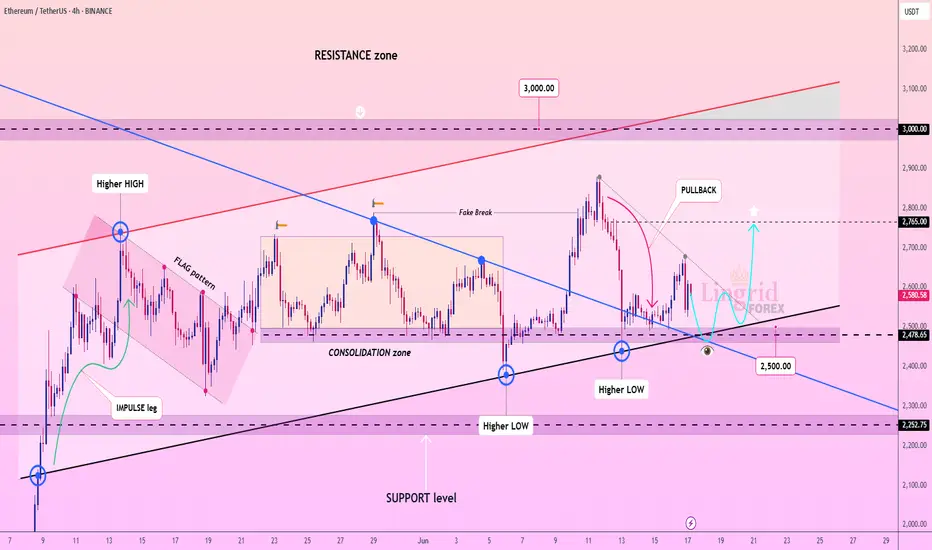
Lingrid | ETHUSDT potential Bullish Trade from the ConfluenceBINANCE:ETHUSDT is retesting a key support area near 2500 following a deep pullback from the 2765 rejection zone, while holding above a multi-week ascending trendline. The recent bounce has not yet invalidated the bullish structure, and the confluence with the downward breakout level adds significance to this zone. A higher low above 2480 could trigger a sharp reversal back toward the 2765 resistance.
📈 Key Levels
Buy zone: 2475–2520
Sell trigger: breakdown below 2450
Target: 2765
Buy trigger: breakout above 2620
💡 Risks
A breakdown below 2475 would cancel the bullish setup
Lack of volume on bounce attempts may signal weakness
Macro events or BTC drop could drag ETH lower regardless of setup
Traders, if you liked this idea or if you have your own opinion about it, write in the comments. I will be glad 👩💻