ETH Holding Long-Term Support – Road to $4K Open?CRYPTOCAP:ETH has successfully bounced from a long-term rising trendline that has acted as strong support since 2020. This trendline has historically triggered major bullish moves, and it’s doing its job once again.
Notably, ETH has also reclaimed the mid support/resistance level, which had previously acted as a key flip zone in past market cycles.
With both the trendline and horizontal support holding, the structure looks bullish. If momentum continues, ETH could head toward the upper resistance line, potentially targeting $4,000+ in the coming months.
The trend remains intact — this bounce could mark the start of a major leg up.
ETHUST.P trade ideas

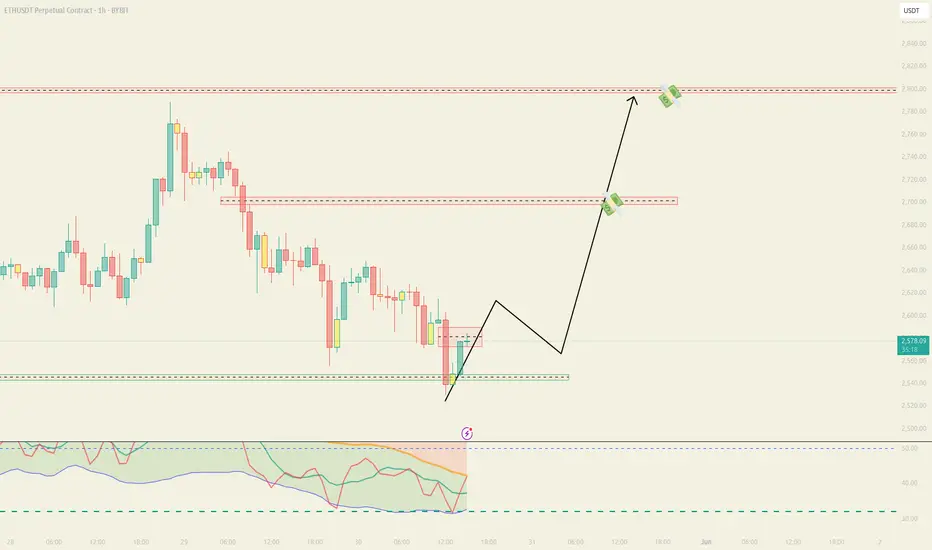
ETHUSDTPERP (Ethereum vs USDT Perpetual, Bitget, 1h)1. Main Trend
Currently, the short-term trend is bearish:
The price is below both the 50 and 200-period moving averages.
The recent movement shows a clear breakdown below previous support levels.
2. Key Levels
Major support: 2,473 (evident from recent lows and corresponding to the lower limit of the Bollinger Bands).
Key resistance:
2,549/2,550 (coinciding with the 50-period MA and the middle BB band).
2,589/2,614 (200-period MA and previous base of consolidation).
Breakdown: There was a clear breakdown below 2,550.
Breakout: Watch for break above 2,589/2,614 for a short-term reversal.
3. Technical Indicators
RSI: 38.83, in slight oversold territory, suggesting the selling may be slowing but with no strong bullish divergence yet.
MACD: Still negative and below zero, but the distance between the lines is narrowing—potential early sign of weakening bearish momentum.
Bollinger Bands: Price currently at or slightly below the lower band, indicating a possible technical bounce.
4. Risk / Opportunity
Suggested trading plan:
Following a sell-off and with RSI in the lower range, there is a possibility for a technical rebound (mean reversion), but the overall setup is still fragile.
Trading setup:
Asset: ETHUSDTPERP
Direction: LONG (attempting a technical bounce, a risky countertrend trade)
Entry: 2,520 (current price/just below 2,525)
Stop-loss: 2,473 (below the recent low, validated by the lower Bollinger Band)
Take-profit:
Level 1: 2,550 (test of resistance/mid BB band)
Level 2: 2,589 (area near the 50-period MA and previous support now turned resistance)
Confidence: Low
Additional notes:
This is a contrarian trade; the main trend is still bearish.
Avoid heavy exposure; consider small size or wait for bullish confirmation above 2,550/2,589 for a safer long.
No strong pattern detected, only technical oversold conditions on the hourly indicators.
If you prefer a trend-following setup:
Short on a pullback between 2,550 and 2,589 with a stop above 2,614 and targets at 2,473/2,450.
Summary: Short-term LONG setup for a potential bounce, but with elevated risk. Main trend remains bearish: be cautious and use strict risk management!

Bitcoin : Bullish Again? Bitcoin is riding the BUY ZONE .
Bitcoin 4hrs Bearish TIME Cycle is about to end , prepare to bounce .
Bitcoin 4hrs tf Cycle is in its final stage so a good bounce its just around the corner .
Bears beware your TIME is ending pack your things and get out of the way. You've been warned.

ETH 1W – Long above 200MA | Retest or Launch?ETH just broke two major barriers:
✅ Closed above the 200MA on the weekly
✅ Broke out of the pink zone, which marks the textbook double top base from June & December 2024
That pink box held price for months — a structural pivot that now flips from resistance to possible support.
Price paused into the 50MA, which typically doesn’t offer heavy resistance on the 1W.
If we see a pullback, I’m watching for a wick into the 200MA or even into the pink zone. Otherwise, this might just go vertical if macro stays calm.

Ethereum Wave Analysis – 30 May 2025- Ethereum reversed from resistance zone
- Likely to fall to support level 2400.00
Ethereum cryptocurrency recently reversed down from the resistance zone lying between the resistance level 2800.00 (which has been reversing the price from February), upper daily Bollinger Band and the 50% Fibonacci correction of the downward impulse from December.
The downward reversal from this resistance zone formed the daily Japanese candlesticks reversal pattern Shooting Star.
Ethereum cryptocurrency can be expected to fall to the next support level 2400.00 (which stopped the previous wave (2) earlier in May).


ETH – Approaching Key Support (4H)⚠️ CRYPTOCAP:ETH has dropped over 5% after getting rejected at resistance and is now nearing a crucial lower trendline support on the 4H chart.
👀 A solid hold here could spark a sharp rebound 🚀, while a break below might drag it down to test deeper support levels 🔥.
Stay focused and monitor the price action for the next move!


ETHUSDT - UniverseMetta - Signal#ETHUSDT - UniverseMetta - Signal
W1/D1 - Potential completion of the 1st wave on W1. If today closes without updating the last maximum, a fractal will form on D1, which may indicate the beginning of a potential correction from the level.
H4 - Formation of a 3-wave structure + breakout of the trend line. Stop behind the maximum of the 2nd wave, with possible false breakouts.
Entry: 2549.53
TP: 2412.82 - 2224.40 - 2035.28 - 1858.21
Stop: 2662.86

Ethereum (ETH): Gameplan Remains Same | We BullishEthereum is still above the 200EMA line, where we see some decent amount of buyside volume. We are looking for the $3000 area as our target, which we think will be reached within days so currently we keep this game plan as long as we are above the EMAs.
Swallow Academy

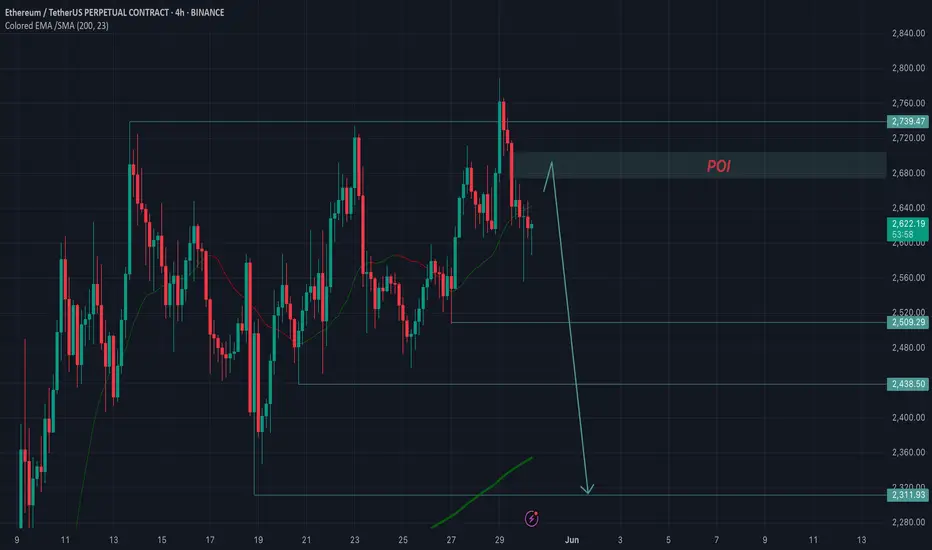
ETH SHORTCRYPTOCAP:ETH 4H
Signs of distribution are observed. If the designated zone of interest (POI) is reached, I plan to open short positions
Local targets: $2509.46, $2442.40, $2323.21, $2271.50
I would add this to the fact that I expect the CRYPTOCAP:BTC correction to continue
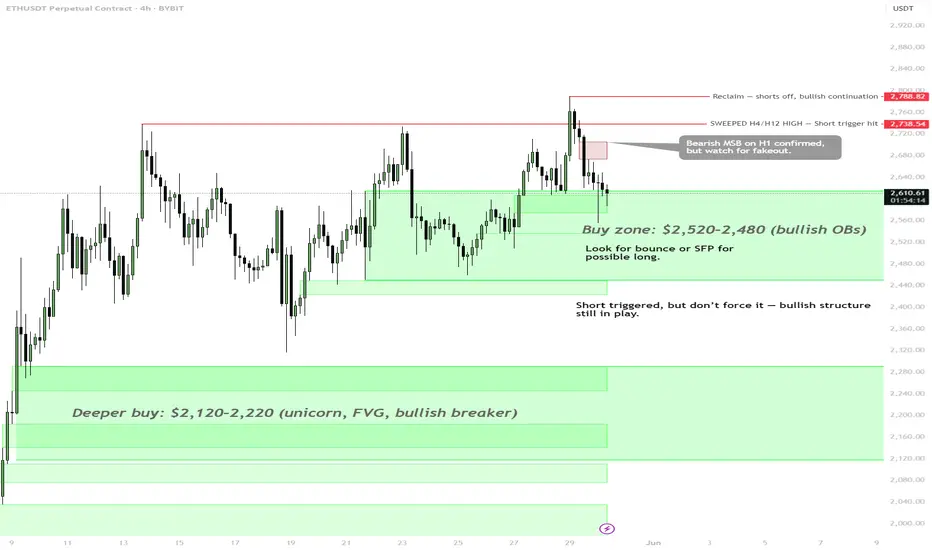
ETH — Setup After MSB and Range SweepPrice swept the H4 and H12 range highs around $2,738–2,768, triggering a short setup. However, the bullish market structure remains intact, and the short play was not strongly confirmed. A bearish MSB on the H1 is active, but a fakeout remains possible.
Key Zone:
🟩 Buy Zone: $2,520–2,480
This area aligns with bullish order blocks and serves as the first area of interest for a potential long position. Watch for SFP or strong bounce.
🟩 Deeper Buy Zone: $2,120–2,220
A cluster of confluences — unicorn pattern, FVG, and bullish breaker. Ideal for larger swing positioning if the market offers deeper correction.
Trade Plan:
• If price holds $2,520–2,480 with confirmation → potential long setup
• If this zone fails, next interest lies in the $2,120–2,220 region
• Flip back above $2,768 → invalidates short thesis, bullish continuation likely
Note:
Short was triggered after sweep, but don't force it — structure still favors bulls on higher timeframes.
📌 Clean levels, clear invalidation, and multiple scenarios mapped — a solid setup for patient traders.
Ethereum @ 20M MAEthereum on monthly time frame has reached to the 20MA & the 61% of Fibonacci. Because of April hammer candle & May 50% raise candle, we might see June close above $3200 and a rally after that to about $8000.

ETHUSDTPERP (Ethereum Perpetual on Bitget)1. Main Trend
Currently, the 1-hour timeframe shows a sideways/weakly bullish trend:
After a price drop, there is a recovery toward the moving average, but without clear directionality.
Price is above the 200 SMA but lacks a strong momentum.
2. Key Levels
Supports: 2,580 (200-period moving average and previous congestion area), 2,550 (local low and lower Bollinger Band).
Resistances: 2,663 (50-period moving average and upper Bollinger Band), 2,718 (recent local high).
Potential breakouts: A significant breakout above 2,663 could open the way toward 2,718–2,750; conversely, a breakdown below 2,580–2,550 increases downside risk.
3. Technical Indicators
RSI: Currently at 48, generally neutral (neither overbought nor oversold), indicating no extremes.
MACD: MACD and Signal lines are very close and below zero, with no clear crossover; signals weakness/indecision.
Bollinger Bands: Price has re-entered the bands after a downward extension; volatility is contracting.
4. Risk/Reward & Trade Signal
Direction: Long (moderate) — opportunity for a technical bounce at the support area.
Entry: 2,605–2,615 (just above static and dynamic support).
Stop-loss: 2,579 (slightly below the recent low and the 200 SMA).
Take-profit 1: 2,663 (first target, aligns with the 50 SMA and immediate resistance).
Take-profit 2: 2,718 (recent high for an extended move).
Confidence: Medium (no strong signals, but a good setup for a technical rebound).
Additional notes: No distinctly bullish or bearish patterns, but there is an attempt to hold support with a possible rebound. Watch for low volatility and potential “fake moves” as price interacts with the moving averages. This trade is suited for intraday/short-term strategies.
Trade Signal Summary
Parameter Value
Asset ETHUSDTPERP
Direction Long
Entry 2,605–2,615
Stop-loss 2,579
Take-profit 1 2,663
Take-profit 2 2,718
Confidence Medium
Notes Rebound at 200 SMA and key support, watch for potential fake breakouts.
If the price decisively breaks and closes below 2,579, the strategy should be reconsidered and a short position might be evaluated.

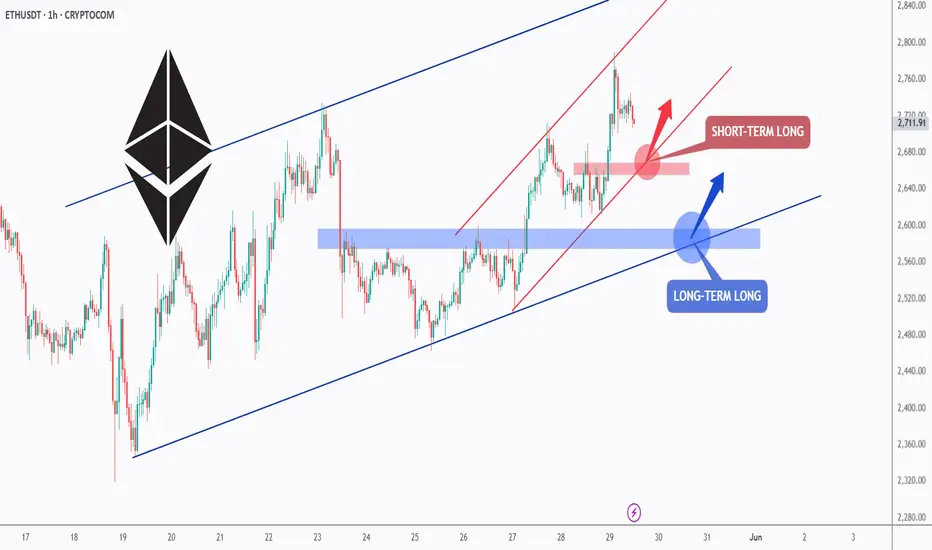
ETH - Long Anyway, Short-term and Long-term!Hello TradingView Family / Fellow Traders. This is Richard, also known as theSignalyst.
📈ETH has been overall bullish trading within the rising blue channel from a long-term perspective and within the rising red channel from a short-term perspective.
Moreover, the red and blue zones are strong support and structure!
🏹 Thus, the highlighted blue and red circles are strong areas to look for buy setups as it is the intersection of the lower zone(s) and trendline(s).
📚 As per my trading style:
As #ETH approaches one of the circles, I will be looking for bullish reversal setups (like a double bottom pattern, trendline break , and so on...)
📚 Always follow your trading plan regarding entry, risk management, and trade management.
Good luck!
All Strategies Are Good; If Managed Properly!
~Rich
ETHEREUM AT A CRUCIAL INFLECTION POINT:CRYPTOCAP:ETH has been grinding just below a major resistance zone (~$2,850) after breaking out of a long-term descending channel.
This is the final barrier before a potential rally towards $4,000.
What to Watch:
Resistance: ~$2,850
Break above = momentum likely to accelerate
Rejection = possible pullback to retest breakout zone (~$2,400–$2,200)
Structure is strong, but confirmation is key. Bulls must clear this ceiling with volume.
Patience. React to a breakout or rejection — don’t front-run.

ETH | New ATH on the cards | Fibonacci $7K TARGET Ethereum is gearing up towards the upside and we're seeing another resistance zone being crushed.
While BTC is trading sideways, we can expect ETH to play catch-up:
Don't miss yesterday's update on DOT:
_____________________________

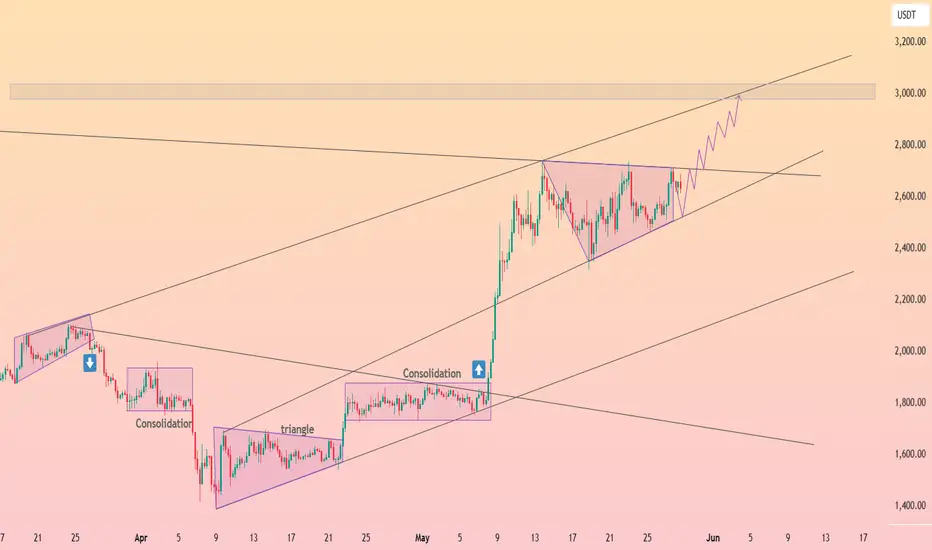
HolderStat┆ETHUSDCRYPTOCAP:ETH momentum check: After breaking consolidation, Ethereum rides an ascending wedge, clinging to support while eyeing the 3000 supply band overhead. Earlier triangle pops hint bulls may punch resistance. Chart bias and TA remain constructive.
ETH.USDT - 1HAs you can see in the chart, ETH failed to stabilize above the 2750 level in the 4-hour timeframe, causing a false break and showing a reverse reaction. It seems that the RSI is also seeing price divergence. If the 2612 level is lost and stabilized below this level, there is a potential for further decline for Ethereum.

Ethereum is Approaching a Key Support!Hey Traders, in today's trading session we are monitoring ETH/USDT for a buying opportunity around 2,650 zone, Ethereum is trading in an uptrend and currently is in a correction phase in which it is approaching the trend at 2,650 support and resistance area.
Trade safe, Joe.

Ethereum (ETH): Breakout Happened | Buyers Taking OverWe have had a decent breakout from the local high area, and now we are heading for the retest of that broken zone.
So far everything goes as planned. We are looking for a successful retest here and then a steep movement to upper zones here.
Swallow Academy

Ethereum Tests Triangle Resistance Amid Positive NewsflowEthereum is attempting to break out of an ascending triangle, supported by the recent U.S. tariff court ruling that came just hours ago. The 2740–2756 zone remains key, and despite a brief spike above, resistance is still holding. If a breakout is confirmed, the next major target lies at 3075. To reach that level, a new trend channel may form, potentially running parallel to the triangle’s lower line.
While Ethereum is benefiting from both the court decision and Nvidia’s strong earnings, the bullish momentum from the ruling may not last long. Therefore, Ether bulls should be cautious with leveraged long positions despite the favorable technical setup.
