ETHUSDT SWING TRADE SetupWait for the entry and must use sl, if sl hits then wait for candle closure, candle managed to close above the SL, still there is lot of supply zone for eth till 2.7k, So fakeout also possible. I will comment the update, SO closely follow me.
ETHUST.P trade ideas
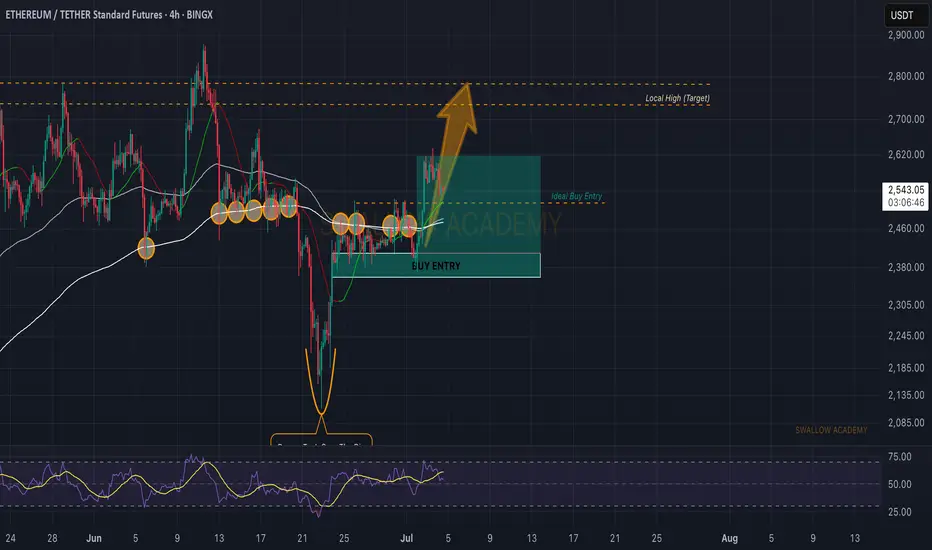
Ethereum (ETH): Good Bounce | $2800 IncomingWe had a rather sharp but clean breakout recently where price has shown us that buyers are dominating currently, pushing the price toward the local high at $2800. This is our current target and so far ETH had been perfoming more than well.
Swallow Academy

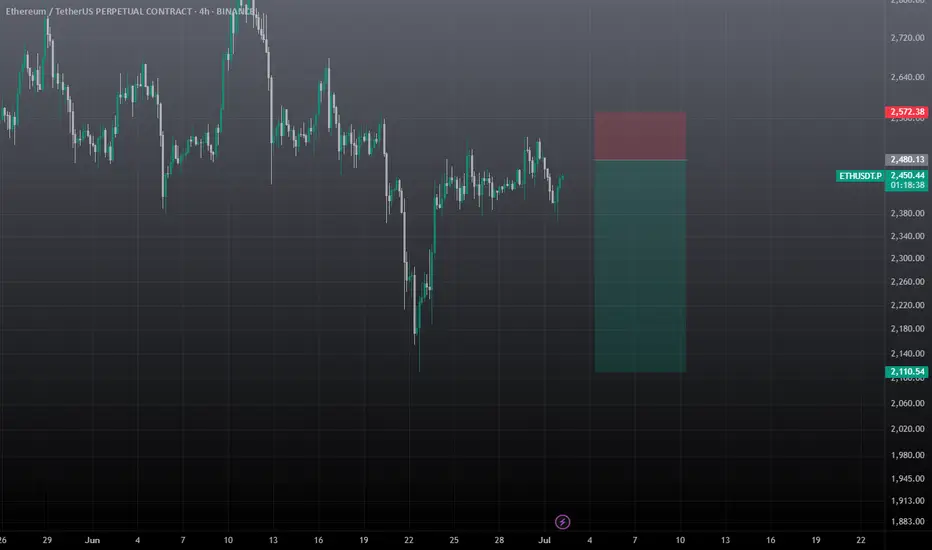
Wait for ETH to rebound to $2528-2542 and place a short order.Short
$2528~$2542
Take Profit
$2480, $2460
Stop Loss
$2555
If the price falls below $2510, do not chase short, wait for a rebound.

Important Support and Resistance Areas: 2419.83-2706.15
Hello, traders.
Please "Follow" to get the latest information quickly.
Have a nice day today.
-------------------------------------
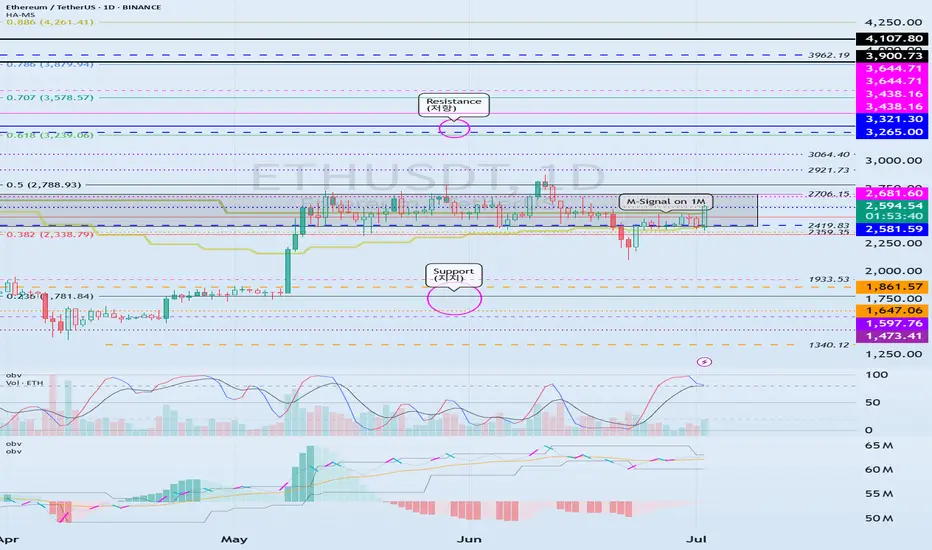
(ETHUSDT 1D chart)
The key is whether ETH can find support in the 2419.83-2706.15 area and rise.
This is because this section is the section that needs to be supported in order for a full-fledged uptrend to begin.
Therefore, if you are trading ETH, you can proceed with a purchase when support is confirmed in the 2419.83-2706.15 section.
-
Thank you for reading to the end.
I hope you have a successful transaction.
--------------------------------------------------
- Here is an explanation of the big picture.
(3-year bull market, 1-year bear market pattern)
I will explain the details again when the bear market starts.
------------------------------------------------------
ETHEREUM ETHUSDT is awaiting a directional bias .but at the moment it has to break a weekly supply roof and sustain the gains as buy confirmation.

ETH | Long | 3 Hrs | Target: 2,540This technical analysis is for informational and educational purposes only. It does not constitute financial advice. Remember to always research and consult with a professional before making investment decisions. Good luck! 📈💼🚀

ETH BEARISH AT RESISTANCE ETH rejecting daily resistance, likely price will look to find supports at zones marked below
DYOR

Ethereum Technical Analysis – Key Support Levels to Watch!🚨 Ethereum Technical Analysis – Key Support Levels to Watch!
After a strong rally in recent days, Ethereum (ETHUSDT) is now experiencing a healthy correction. The $2,440 zone is currently acting as a crucial support level that could determine the next move.
📉 If price breaks below this level, the next major support lies around $2,270, which could become a key area for bulls to step in again.
💡 All the important support and resistance levels are clearly highlighted on the chart. This is a must-watch zone for short-term traders!
🔔 Follow for more daily updates on Ethereum, Bitcoin, and altcoin setups!
#ETH #Ethereum #CryptoAnalysis #TradingView #TechnicalAnalysis #ETHUSDT

Ethereum (ETH): $2800 Is Next TargetEthereum had a good rally where buyers took control over EMAs, whereafter a successful retest, buyers are back in the game (hopefully).
We are starting to look for another long entry on the COINER at $2,600; once we see a proper BOS in this region, we will be opening a long position.
Swallow Academy
Momentum Reload: Next Scale-InHello traders,
First position still floating. The scale-in has been executed. The structure is clear, and the positioning, sequence, and entry are all solid. I'm comfortable taking a potential loss on this position. Stops from the previous trade have been moved to the current stop-loss level, making the overall position risk-free.
I'll release a video soon to walk you through the details.
Stay safe chads! Peace
MEXC:ETHUSDT.P
BINANCE:ETHBTC
CRYPTOCAP:TOTAL
Ethereum in JULYEthereum should close above $3000 by the end of July to stay in the bull run, Monthly candle is so important now.

Q3 Could Be Big for #ETH, Breakout Watch ON#ETH bounced exactly from the 0.5 level of Fib Retracement, as expected.
Now it appears to be gearing up for its next breakout move!
After weeks of chopping inside a falling channel, ETH is showing signs of strength. It's reclaiming key levels and slowly pushing toward the breakout zone near $2,520.
A breakout above this resistance could trigger a sharp move toward $2,880 and beyond.
However, bulls need to hold the $2,300 zone, a drop below might delay the pump.
Structure is bullish, just needs confirmation.
IMO, Q3 could be massive for ETH.
Like & retweet for more updates.
#Ethereum

When does Bolran start?Read carefullyhello friends👋
💰Many of you are asking when Bolran will start or if it will start at all, we decided to explain it to you in a full post.
Well, you can see the Ethereum chart moving in a channel, and with a drop, it created a big fear that a fall is coming, and meanwhile, the buyers returned the price to above 2000 dollars with a strong and unexpected return.
✅️Now the price is stuck in the specified box between 2200 and 2500, and if this range is maintained, the price will easily move up to the range of 3200 in the first wave, and if it fails to maintain this range, the price will fall below 1500 dollars.
🧐Now, in our opinion, due to the rapid return of the price from the channel, this failure is a fake channel and the range will be maintained, and we are likely to see Ethereum rise in the coming weeks.
🤔You know that Ethereum is the leader of altcoins, and if it grows, important altcoins will grow, which is the beginning of Bolran, and there are important altcoins that can be used for good profit.
🌟You can join us if you like.🌟
🔥Follow us for more signals🔥
*Trade safely with us*

ETH needs support now. ETH is holding up by a thread. There are signs of weakness in the market, and if the Ethereum price breaks below support, it is likely we will see follow-through.
Full TA: Link in the BIO
#ETHUSDT: Time For Big Price Distribution! Get Ready $5000ETH is currently in distribution and is on our target list. We expect a smooth price movement, potentially reaching $3100, $3800, and $5000. Use the entry zone to take a position; anything below the entry will invalidate the idea. Please use accurate risk management while trading.
Like, comment, and share this idea to encourage us to post more.
Team Setupsfx_

Ethereum (ETH): Hovering Near EMAs | Might Be Good Buying SpotEthereum is still hovering near local lines of EMAs, where we are expecting to see a volatile breakout very soon.
Now we have 2 buy entries, where the best option is after breaking the local resistance area, which is above the EMAs but overall, with the current buyside dominance we have had, we are seeing good chances for the price to reclaim the $2800 within days from here on.
Swallow Academy

3 days of breakoutafter three days of break out and a break of daily level to the opposite side. it high probable that it will continue the break

FRD/FGDFRD happen when there is a red day after 2 or more breaks of daily high to the up side. after the trigger to the downside, it will be highly likely to continue to breakdown

false break set upafter 2 higher highs or more has been made then a day trades above the previous day's high but close back inside the range, it is D1. after the break of previous day low, it is high probable that it will continue the reversal

doing the homeworktesting 3days of breakout, frd,fgd, day one false break with the break of daily level as trigger to start to build position. for entry . buy if it dip below daily vwap during the sessions. stop is above the high or the low of the signal day. targeting the second push. for inside day, trying to capture the false break back to the other side or daily high or low 90% winrate. let see when I apply it in real time

ETHUSDT WEEKLY UPDATE — PART 1
When Conviction Fails: Apex Rejection, Hidden Redistribution, and the Illusion of Demand
Good morning, good afternoon, good evening, wherever you're tapping in from. Now, as always, I’m not here to waste your time with unnecessary waffle. Let’s get straight into it and unpack this mess step-by-step.
THE APEX REJECTION | MORE THAN JUST A WICK
So picking up from last week's update, we find ourselves right at the crossroads, and not the romantic kind either. What we’re looking at right now so far, is a clean yet 100% conclusive rejection from the apex of a key macro structure.
This isn’t just any level. This is the intersection of vertical momentum and horizontal memory, the apex of a triangle that’s been forming for months. This is where bullish intent was supposed to hold, supposed to assert dominance, but instead, what did we get? A strong push into resistance, a failure to fix above it, followed by exhaustion and signs of institutional unloading.
Now, to the untrained eye, this may look like a pullback, or even a healthy correction. But we’re not here to look at charts with retail goggles. We’re here to track the true intent behind the price action, and if you know your schematics, this is screaming redistribution. And not just any redistribution, the kind that happens right before the market changes its personality.
WHERE ARE WE IN THE SCHEMATIC?
If we overlay Wyckoff logic on top of this structure, it's very clear:
We’ve had our PSY (preliminary support).
Followed by a spring, a shakeout, and a fake rally.
Now we’re dancing around what appears to be the UTAD (upthrust after distribution) — but weaker.
This isn’t classic distribution, it’s redistribution masked in macro confusion.
Here’s the thing this range isn’t just price consolidation, it’s behavioural conditioning. This long, choppy sideways movement is designed to wear out both bulls and bears, making them question their bias, mismanage their risk, and either overstay or exit too early.
The market is methodical, not random. These candles aren’t accidents, they are footprints of algorithmic trap setting, and right now, it looks like the net is about to close.
VOLUME TELLS THE TRUTH
Let’s not forget volume. Look at the weekly volume through this recent push:
Decreasing volume on the rallies,
Higher volume on the red closes,
And multiple spikes that failed to carry price past resistance.
That’s your dead giveaway. You don’t need to be a wizard, just follow the clues. Price is being pushed, not lifted. Demand isn’t stepping in, liquidity is being removed. This isn’t smart money accumulation, if confirmed by the endd of this week, this most recent move up cout be doing of smart money unloading, Quietly and Efficiently.
THE MARKDOWN IS PRIMED
Let’s now address the elephant in the room, the range low and point C of the triangle on the 4H.
T hat’s where liquidity is sitting.
That’s where the market’s next objective lies.
We’ve now failed to reclaim the apex, the wick was slapped down, and unless something significant shifts, the next logical move is to sweep that C point, take out the emotional support, and either:
Tap into true demand (if it exists), or
Begin the cascade toward the final green demand zones between 2,150–2,070, which we marked weeks ago.
And don’t forget, this sweep may not be clean. We could get a fakeout bounce mid-range — enough to bait in more longs, only to roll over again.
PSYCHOLOGICAL LAYER
What’s happening here isn’t just technical, it’s emotional warfare. This entire range has been one long gaslight for the average trader. Between the failed breakouts, failed breakdowns, and chaotic intraday behaviour, retail has been turned into liquidity.
And if you’re still trying to long blindly at the top of this, hoping for 3k ETH without a confirmed structure reclaim, then respectfully, you’re the product right now.
Coming next in Part 2:
A full breakdown of the 4H macro setup
Analysis of the internal range mechanics
Recalculated fib zones
Where the liquidity pockets are
What the most probable path is short, medium, and long-term
Stay tuned — I’ll keep the flow coherent, structured, and aggressive. No fluff. No hopium. Just structure, psychology, and execution.

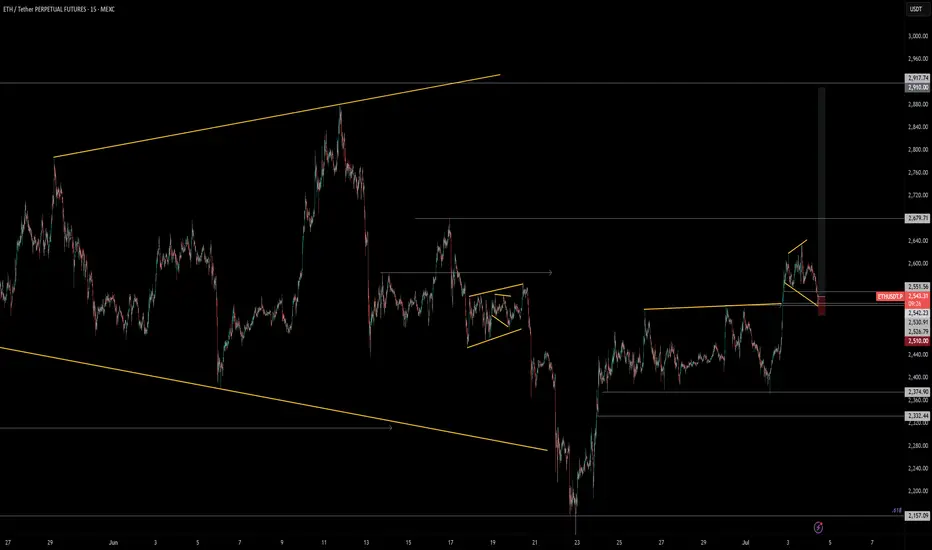
Weekly trading plan for EthereumBINANCE:ETHUSDT Last week, price mostly traded in a range. For this week, I've updated key levels, marked them on the chart, and modeled several scenarios. We can expect a pullback—possibly a deeper correction—before another push toward resistance levels. If price breaks the local low but then reclaims the weekly pivot point, I'll consider opening long positions without waiting for a deeper pullback.
Write a comment with your coins & hit the like button and I will make an analysis for you
The author's opinion may differ from yours,
Consider your risks.
Wish you successful trades ! mura

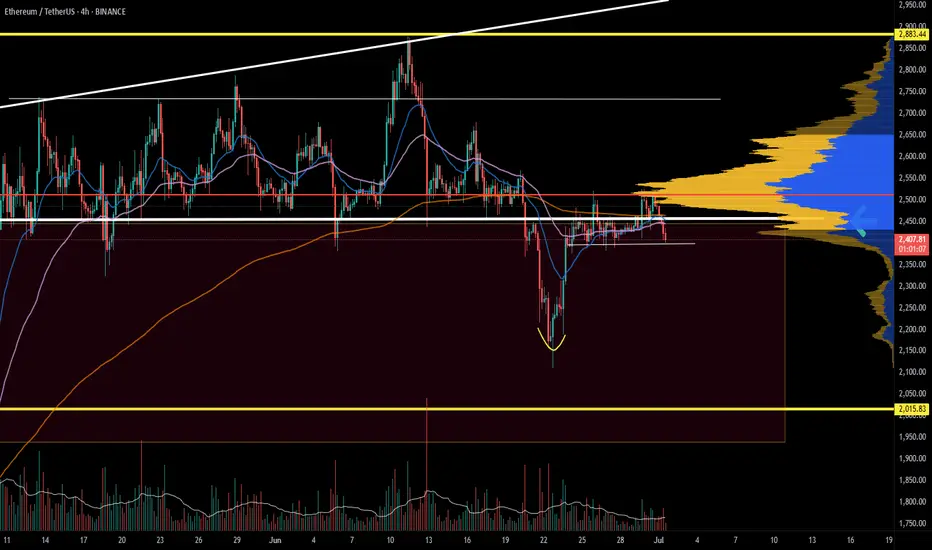
Ethereum Leveling Map — ETH/USDT 1DNo directional bias for Ethereum, but will use levels to spot entries for intraday.
Right now located at POC and seems balanced for both sides.
Potential Adam&Eve setup in development.
Quality levels for support $2150, 2000, 1800, 1500.
Resistances $2700, 3000, 3500, 4000
Keep in mind it will follow BTC price action by most of time.
Happy trading
