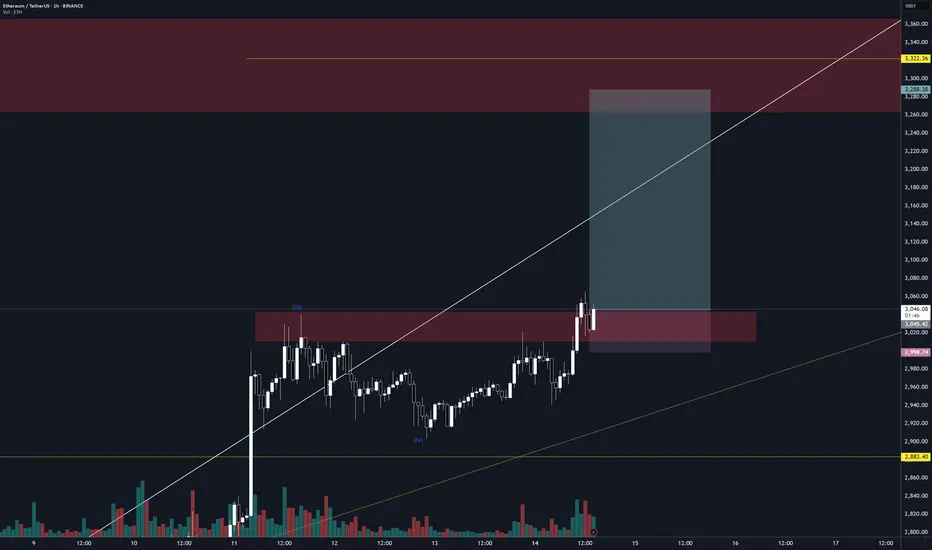
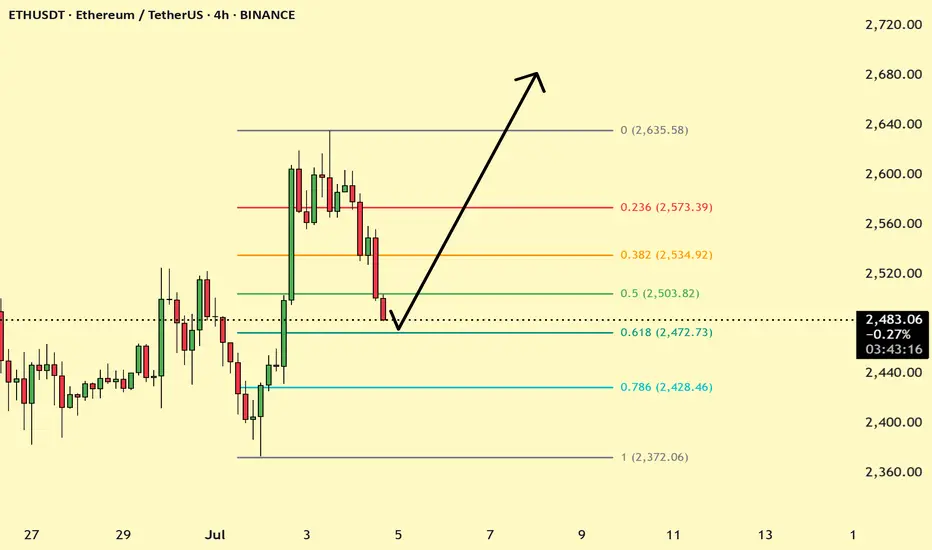
Weekly trading plan for EthereumBINANCE:ETHUSDT Price has broken through the psychologically significant $3,000 level, but we're now seeing a clear 4-hour RSI divergence. Historical patterns suggest this divergence has a high probability of playing out. Expect potential correction initiation within the next 48 hours
Should the rally continue toward final targets:
The existing divergence may strengthen
A daily timeframe divergence could form
I'll await confirmation before considering short positions
As always, manage your risk wisely
ETHUST.P trade ideas

$ETH LONG POSISI I see potential In CRYPTOCAP:ETH Hi break high , i will take hi for retectment area and order block .
If u want entry area see on chart

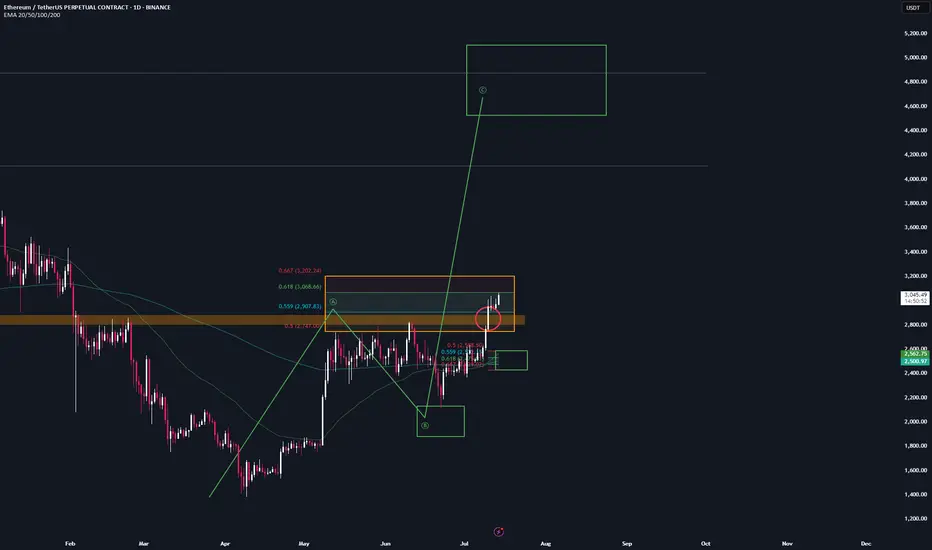
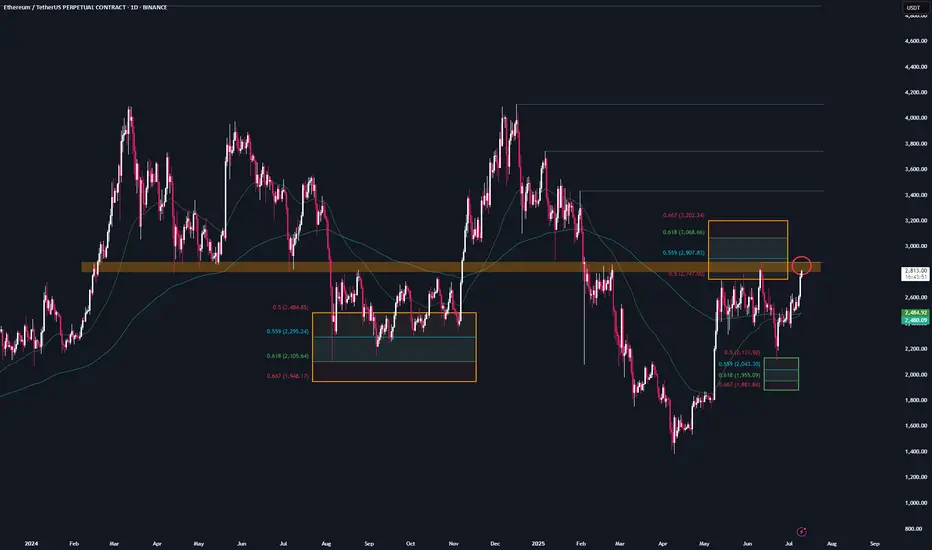
ETH - Trade setup📌 After the breakout from the last high at 2.9k, a bullish sequence (green) has now been activated.
📊 These setups typically occur no more than twice per year on any given altcoin, so I’ll be aggressively buying each level at the B-C retracement area.
Trademanagement:
- I'm placing long orders at each level. ((If the price continues climbing, I’ll adjust the trend reversal level (green) accordingly and update my limit orders.)
- Once the trade reaches a 2 R/R, I’ll move the stop-loss to break-even.
- From a 3 R/R onward, I’ll start locking in profits.
✅ I welcome every correction from here on —
but I won’t enter any new positions at these top levels.
Stay safe & lets make money
new long order on etheth backtest-ed, eth/btc looking good to move, btc reached new all time high.
Good to go ? ./.
ETHUSDT BUY / Long SetupThis 4hrs candle closes above the mentioned level, then took long from 50% fib level of the fvg, and put sl below the recent swing low, I will update the trade whether it's active or not? tp towards 3.3-3.4k , while btc.d getting recked so becareful shorting any altcoin.

ETH – $7k Target in Sight
7k incoming on CRYPTOCAP:ETH —timing is up in the air, but the chart looks stellar.
A decisive break above $3,500 should kick off aggressive expansion.
Meanwhile, ETHBTC has been rallying hard off its lows; I’m eyeing a 50% gain against BTC over the next 2–3 months.
Holding through this strength makes sense—it’s been a long time since we’ve seen these setups.

ETH – Watching the $2,900 Trigger for ATHsJust need BINANCE:ETHUSDT to break above $2,900 for the next trigger.
Feeling confident it will chew through the current supply zone.
Plenty of other coins are already showing clear direction, and Ethereum should follow.
Be patient—I doubt ETH will challenge the #1 spot, but a move above $2,900 opens the door to a potential new ATH.

$ETH IS GOING TO MAKE ATHsBitcoin amd Etheureum will continue to rise until Ethereum clears these highs. The market is not done yet.
Although, I expect Bitcoin to retrace and consolidate more, i expect more bullish scenario’s than Bearish.

ethusd to 70 000 or 700 and 70 in two Months we seeEthereum in parallel channel and huge bull flag. if in next two months it will break out of the 4000 could go to 75000.
If not will range in channel till 700 and breaking down would mean even 70 and lower

Ethereum Idea and Buying Plan⚪️ CRYPTOCAP:ETH
We mentioned earlier that our goal is 3290 - 3473 which is the gap formed in CME contracts
⭕️ Currently, for speculative thinking or looking to enter the support range after all this rise is between 2789.57 to 2685.87
🚨 The important thing is to stay above 2326 to support the continuation of the rise strongly
🔼 The key to the rise will be maintaining movement above 3000 on the 4h and 1d frames
📄 The closest targets for this model, upon meeting the conditions, are 3356 reaching the range of 3567 - 3857

ETH Ethereum (ETH/USDT) Technical Analysis (April 29, 2025)
🔵 Trend Analysis:
Overall trend remains bearish on the daily timeframe.
ETH is trading below the Ichimoku Cloud, indicating continued downward pressure.
The price is struggling around $1,790, facing strong resistance and unable to break into bullish territory.
🌫️ Ichimoku Cloud Insight:
Kumo (Cloud) is thick and bearish ahead, suggesting strong resistance at higher levels.
Conversion Line (Tenkan-sen) and Base Line (Kijun-sen) are flat, showing a range-bound market recently.
The Lagging Span (Chikou Span) is below the price and the cloud, confirming bearish sentiment.
📏 Fibonacci Retracement Levels:
ETH is retracing after a heavy downtrend.
Key Fibonacci levels:
0.236 at ~$1,721 — already surpassed.
0.382 at ~$1,927 — acting as a next resistance.
0.5 at ~$2,093 and 0.618 at ~$2,260 — higher resistance zones.
Immediate local resistance sits near the $1,927 - $1,930 region.
🔥 Support and Resistance:
Strong range support near $1,700 is marked (labeled "Eth range support 1700" on the chart).
Resistance above at:
~$1,809 (local highs and the edge of Ichimoku Cloud).
~$1,927 (Fibonacci 0.382).
If ETH breaks below $1,700, the next major support is at $1,621 and even deeper at $1,387.
⚡ Momentum (RSI Indicator):
RSI 14 is at 54.37, slightly above neutral (50), suggesting mild bullish momentum.
RSI above 50 usually indicates buyers are gaining slight control.
RSI has risen recently, but without strong divergence from the price action, meaning strength is moderate, not explosive.
📊 Volatility:
Volatility has compressed recently (visible from smaller candlestick sizes).
Price action remains in a tight range between $1,750 and $1,810.
A breakout from this range could trigger larger moves.

Introducing ETH-BCH Strategy (Powered by BCH)
Strategy Summary: BCH-ETH Rotation Logic with Risk Controls
This strategy trades ETHUSDT, based on relative strength and market signals from BCH, ETH, and BTC, using 2-hour candles. It aims to identify favorable ETH long entries when BCH shows relative outperformance and specific market conditions are met.
🔹 Entry Logic
A long position on ETH is triggered when:
BCH shows stronger short-term return than ETH
BCH volume exceeds average
ETH RSI is below 70, indicating no overbought signal.
Either:
MACD (BCH) is bullish (MACD > Signal), or
ETH has dropped sharply in recent 48 hours
ETH price is in a relaxed lower Bollinger zone
🔹 Exit Logic
A position is exited if any of the following are met:
Trailing Stop Loss
Take Profit
Sell Signal:
BCH is underperforming BTC
ETH is in the upper Bollinger zone
🔹 Other Features
Uses Bollinger Bands on ETH for buy/sell zones.
Avoids immediate re-entry or back-to-back trades to reduce noise.
Strategy tracks trailing highs to dynamically exit via stop loss.


Ethereum Wave Analysis – 11 July 2025- Ethereum broke resistance zone
- Likely to rise to resistance level 3140.00
Ethereum cryptocurrency recently broke the resistance area lying at the intersection of the key resistance level 2885.00 (which has been reversing the price from February) and the resistance trendline of the daily up channel from June.
The breakout of this resistance zone accelerated the active impulse waves 3 and (3).
Given the predominantly bullish sentiment seen across the crypto markets, Ethereum cryptocurrency can be expected to rise to the next resistance level 3140.00 (former support from December and January).

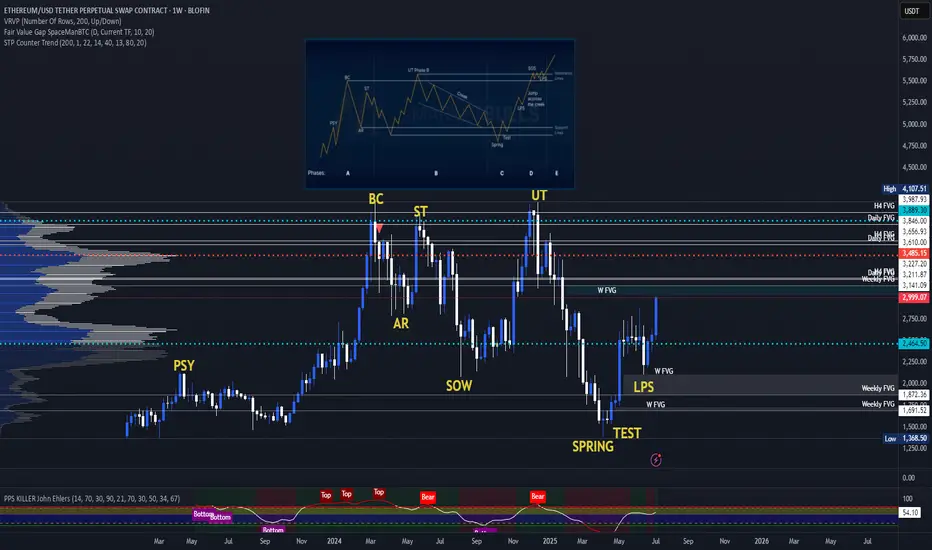
ETH Wyckoff Re-AccumulationETH (and many of the major altcoins) has a macro re-accumulation going on right now. The targets would be well beyond our current all-time highs. There has been a lot of bullish news recently with large investors buying heavily into ETH, which should act as a catalyst to jump-start the mark-up phase of this re-accumulation and "Jump Across the Creek" as they say.
ETH Long / Buy SetupAs of many times mentioned that, will short eth above 3k or 3k, but it still shows Bullish momentum no sign of weakness, maybe this entry triggers during weekend due too low volume, search for ifvg, if any 1D or 4hr Bullish fvg truns into bearish ifvg then will take short on ETH. For now will take long with SL and proper risk management.

EthusdEasy target here if it can keep pushing above 3k and the weekly ends above it it will sure go to 4k where is a good point to sell . Alt season it’s starting now
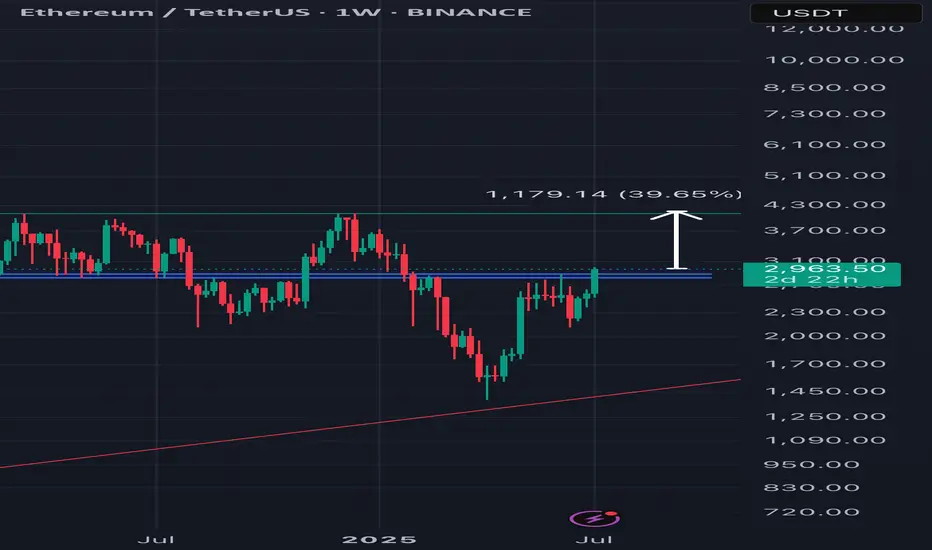
ETH is at a crucial areaETH is currenty retesing its key support & resitasnce area over the last 2 years, every breakthroiugh let to an major rally
Once we can close above it expect bullish moomentum to contiue to new ATH reagions
#ETH Update #2 – July 10, 2025🟢 #ETH Update #2 – July 10, 2025
Ethereum has formed a new high above its previous impulsive leg. Although this peak is lower than the one a month ago, the current structure looks healthy. During this move, ETH left an imbalance around the 2373 level, which aligns closely with a potential retracement zone. Volume appears to be decreasing or reaching exhaustion, suggesting the rally may be losing strength. A correction towards 2685 could be on the table. For now, the setup does not favor either a long or short position.

ETH/USDT Long term ContinueAbsolutely! Here's your Ethereum long position analysis in English based on the chart you shared:
🧠 My Position – Long at $2,590
📍 Current Price: ~$2,605
👉 That means you're currently ~$15 in profit (small gain for now).
📊 Chart-Based Technical Analysis (1D timeframe)
✅ Key Support Levels
$2,423 – Fibonacci 0.382 level
$2,450–$2,475 – Close to the 50 EMA (blue line)
These zones serve as strong support, holding the price up.
🚀 My Entry Strength
You entered at $2,590, which is:
Above EMA 20 (red) — bullish short-term signal
Right in the tight moving average cluster (20/50/200) — often a sign of an upcoming breakout
📈 Risk/Reward Ratio
Entry: $2,590
Stop-Loss: $2,575 → Risk: $115
TP1: $2,743 → Reward: $1530
R/R ratio for TP1: ~1
✔️ Overall: Very good entry with balanced risk.
🔔 Recommendations:
If ETH moves above $2,650, consider moving SL to break-even ($2,590) — protect your capital
Near $2,743, you could:
Close 50% of my position
Or use a trailing stop to lock in more profit

#ETH Ascending Triangle📊#ETH Ascending Triangle 📉
🧠From a structural perspective, the bullish target near the neckline support area has been achieved, so there is an expectation of a pullback.
➡️From a graphical perspective, there is an ascending triangle superimposed inside the ascending wedge. Generally, we regard such models as bearish models. Therefore, with the support of multiple decline expectations, we should not chase the rise here! ! !
🤜If you like my analysis, please like 💖 and share 💬 BITGET:ETHUSDT.P

ETHUSD At 0.618 fib If holds can go 2680 ETHUSD recently in uptrend as par to correction the price has reached 0.618 Fib and price maty reverse if the bulls are Strong let us see....
ETHEREUM ROADMAPI tried to predict based on previous time periods and elliot waves.
Please note that my analysis is not short-term. Of course, there may be short-term correction waves in Ethereum.
* The purpose of my graphic drawings is purely educational.
* What i write here is not an investment advice. Please do your own research before investing in any asset.
* Never take my personal opinions as investment advice, you may lose your money.
