EURCAD - Follow the Bears!Hello TradingView Family / Fellow Traders. This is Richard, also known as theSignalyst.
📈EURCAD has been overall bearish , trading within the falling red channel and it is currently retesting the upper bound of the channel.
Moreover, it is rejecting a weekly resistance marked in blue.
📚 As per my trading style:
As #EURCAD is around the red circle zone, I will be looking for trend-following sell setups on lower timeframes. (like a double top pattern, trendline break , and so on...)
📚 Always follow your trading plan regarding entry, risk management, and trade management.
Good luck!
All Strategies Are Good; If Managed Properly!
~Rich
Disclosure: I am part of Trade Nation's Influencer program and receive a monthly fee for using their TradingView charts in my analysis.
EURCAD trade ideas

MORNING FORECASTING LESSONSIt's important to recognise that the position of our trades is just as critical as the entry point. We need to clearly understand how to get involved and have a solid grasp of our trade setups. of our trade setups!

HEAD & SHOULDER PATTERN SPOTTED IN EUR/CADHEAD & SHOULDER PATTERN SPOTTED IN EUR/CAD.
Price is expected to remain bearish in upcoming trading sessions.
On higher side 1.61100 level may act as a key resistance level.
On lower side market may hit the target of 1.58150.

EUR-CAD Bullish Wedge! Buy!
Hello,Traders!
EUR-CAD is trading in an
Uptrend and the pair formed
A bullish wedge pattern and
Now we are seeing a bullish
Breakout from the wedge so
We are bullish biased and we
Will be expecting a further
Bullish move up
Buy!
Comment and subscribe to help us grow!
Check out other forecasts below too!
Disclosure: I am part of Trade Nation's Influencer program and receive a monthly fee for using their TradingView charts in my analysis.

EURCAD - Strong Reversal Impulse off Double TopEURCAD has created bearish price action with a strong reversal impulse pushing down from the double top level. Waiting for a continuation to confirm a sell opportunity with a good R:R.
Good Luck

EURCAD: Bearish After the News 🇪🇺🇨🇦
EURCAD may drop from a solid daily resistance.
As a confirmation signal, I spotted a bearish engulfing candle
on a 4H time frame after its test.
The formation of this candle is accompanied by multiple negative
German fundamentals.
Goal - 1.5976
❤️Please, support my work with like, thank you!❤️
I am part of Trade Nation's Influencer program and receive a monthly fee for using their TradingView charts in my analysis.

EURCAD: Expecting Bearish Continuation! Here is Why
Balance of buyers and sellers on the EURCAD pair, that is best felt when all the timeframes are analyzed properly is shifting in favor of the sellers, therefore is it only natural that we go short on the pair.
Disclosure: I am part of Trade Nation's Influencer program and receive a monthly fee for using their TradingView charts in my analysis.
❤️ Please, support our work with like & comment! ❤️

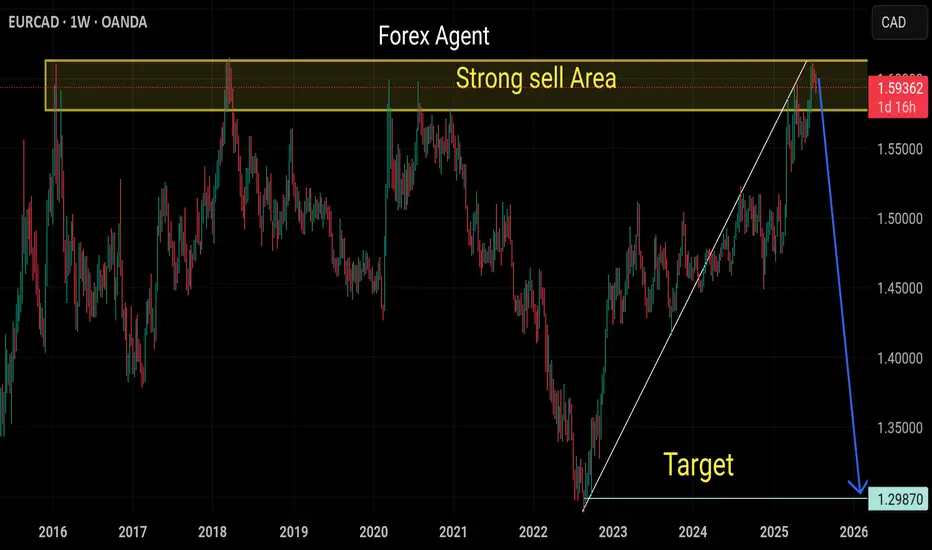
Sell eurcadStrong sell expected from next month
Monthly overbought indicators
Strong selling area minimum drop expected 500 pips

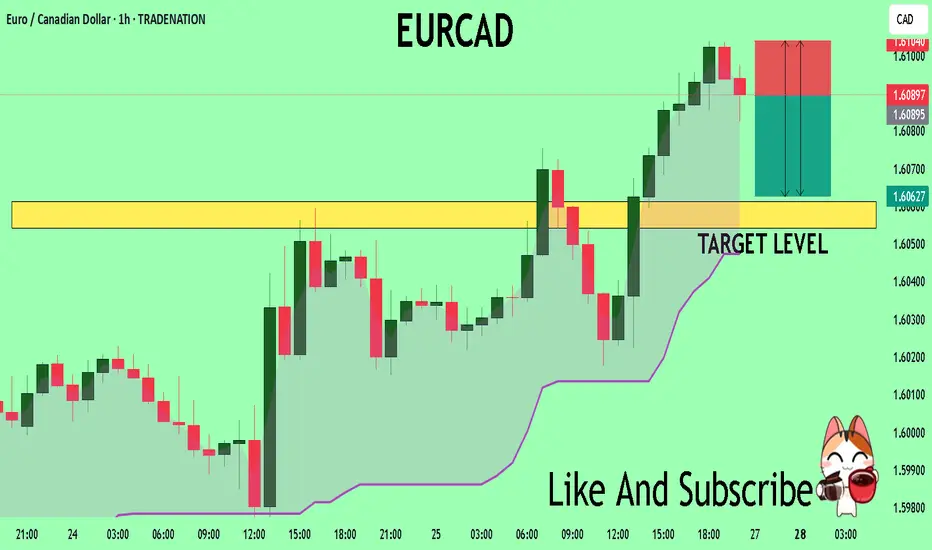
EUR/CAD Tests Resistance — Bullish Breakout in Sight?EUR/CAD appears to be showing bullish momentum and is likely heading toward the 1.6110 level. Currently, the pair is testing a key resistance zone. If the price manages to break above this resistance with strong volume or confirmation, we could see further upside continuation toward the next target at 1.6110. Traders should watch for a clear breakout and possible retest of the broken level turning into support, which could provide a good entry point for long positions.

EURCAD Long TradeOANDA:EURCAD
Long trade, with my back testing of this strategy, it hits multiple possible take profits, manage your position accordingly.
TP-1: 1.59517
TP-2: 1.59726
This is good trade, don't overload your risk like greedy, be disciplined trader, this is good trade.
Use proper risk management
Looks like good trade.
Lets monitor.
Use proper risk management.
Disclaimer: only idea, not advice

EUR/CAD: Shorting the Climactic Rally Near 1.6000The strong rally in EUR/CAD has pushed the pair into extreme territory, approaching a major psychological and structural resistance zone. While momentum has been strong, this looks like a potential climactic or "blow-off" top, offering a highly favorable risk/reward opportunity to short the pair in alignment with the weak underlying Euro fundamentals.
The Fundamental Why 📰
The core thesis remains bearish for the Euro. The European Central Bank (ECB) maintains a distinctly dovish tone, signaling a willingness to ease policy further to support a slowing Eurozone economy. This fundamental headwind suggests that extreme rallies in Euro pairs are often exhaustive and present prime shorting opportunities.
The Technical Picture 📊
Major Supply Zone: The price is entering a critical multi-month supply zone between 1.5950 and the key psychological level of 1.6000. This is a major ceiling where significant selling pressure is anticipated.
Fibonacci Extension: This area aligns with a key Fibonacci extension level (1.272) from the last major impulse wave, a common zone where trending moves become exhausted and reversals begin.
Pronounced RSI Divergence: A clear bearish divergence is forming on the daily chart. As price makes this final push to a new high, the Relative Strength Index (RSI) is making a significantly lower high, signaling a deep exhaustion of buying momentum.
The Counter-Trade Rationale 🧠
This is a high-level fade. We are positioning for a reversal at a major, technically significant ceiling. The extreme price extension, combined with clear momentum divergence, indicates that the risk of buying at these highs is substantial. By shorting here, we are betting that the powerful technical resistance and weak fundamentals will trigger a significant correction.
The Setup ✅
📉 Pair: EUR/CAD
👉 Direction: Short
⛔️ Stop Loss: 1.63230
🎯 Entry: 1.59490
✅ Take Profit: 1.52008
⚖️ Risk/Reward: ≈ 2:1

EURCAD Will Go Down! Short!
Please, check our technical outlook for EURCAD.
Time Frame: 15m
Current Trend: Bearish
Sentiment: Overbought (based on 7-period RSI)
Forecast: Bearish
The market is approaching a significant resistance area 1.608.
Due to the fact that we see a positive bearish reaction from the underlined area, I strongly believe that sellers will manage to push the price all the way down to 1.607 level.
P.S
The term oversold refers to a condition where an asset has traded lower in price and has the potential for a price bounce.
Overbought refers to market scenarios where the instrument is traded considerably higher than its fair value. Overvaluation is caused by market sentiments when there is positive news.
Disclosure: I am part of Trade Nation's Influencer program and receive a monthly fee for using their TradingView charts in my analysis.
Like and subscribe and comment my ideas if you enjoy them!

EURCAD 1H longEURCAD 1 H made a beatiful sharp drop, now stalling arround some good support levels.
When such a drop happens with no pullback formed yet I'm happy to buy the way down.
Because the pullback has to come soon buyers step in at the support levels.
My plan is simple I open a manual grid at the support levels I draw and aim for a 2R profit
Current grid 3 levels
1 market order
2 buy limits
Tp 2R
extra confirmation RSI is oversold

EURCAD The Target Is DOWN! SELL!
My dear subscribers,
EURCAD looks like it will make a good move, and here are the details:
The market is trading on 1.6089 pivot level.
Bias - Bearish
My Stop Loss - 1.6104
Technical Indicators: Both Super Trend & Pivot HL indicate a highly probable Bearish continuation.
Target - 1.6061
About Used Indicators:
The average true range (ATR) plays an important role in 'Supertrend' as the indicator uses ATR to calculate its value. The ATR indicator signals the degree of price volatility.
Disclosure: I am part of Trade Nation's Influencer program and receive a monthly fee for using their TradingView charts in my analysis.
———————————
WISH YOU ALL LUCK
EUR-CAD Risky Short! Sell!
Hello,Traders!
EUR-CAD is trading in a
Strong uptrend so we are
Bullish biased long-term
However a strong horizontal
Resistance is ahead at 1.6110
And the pair is overbought
So after the retest of the
Resistance we will be
Expecting a bearish correction
Sell!
Comment and subscribe to help us grow!
Check out other forecasts below too!
Disclosure: I am part of Trade Nation's Influencer program and receive a monthly fee for using their TradingView charts in my analysis.

EURCAD Wave Analysis – 24 July 2025- EURCAD reversed from support zone
- Likely to rise to resistance level 1.6100
EURCAD currency pair earlier reversed up from the support zone between the key support level 1.5950 (former monthly high from April), 20-day moving average and the 38.2% Fibonacci correction of the upward impulse from May.
The upward reversal from this support zone started the active minor impulse wave iii – which belongs to the intermediate impulse wave (3) from the end of 2024.
Given the overriding daily uptrend, EURCAD currency pair can be expected to rise to the next resistance level 1.6100 (which stopped the previous impulse wave i in June).

EURCAD Looking for longs after breakoutAs you can see the price its trying to be in a consolidatioon zone and gave formed a double bottom too that we can posibly get buys on tomorows london sesion

EURCAD is BearishPrice was in a strong uptrend, however now it seems that bulls are exhausted, the notion is further validated by a double top reversal pattern with bearish divergence. If previous higher low is broken with good volume, then we can expect a bearish reversal as per Dow theory. Targets are mentioned on the chart.

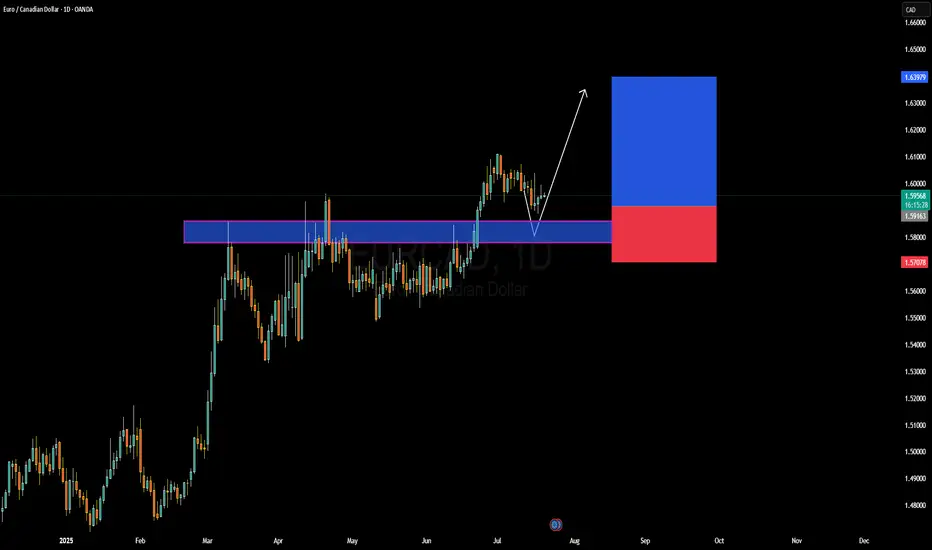
EURCAD Forming Bullish ContinuationEURCAD has recently respected a key demand zone and is now beginning to show early signs of bullish continuation. After a clean breakout above the 1.5900 resistance level earlier this month, price retested this structure and held strongly, creating a textbook bullish rejection wick. This price behavior suggests the pair is gearing up for another impulsive leg to the upside. I'm watching for follow-through momentum targeting the 1.6390–1.6400 zone in the coming weeks, aligning with the risk-to-reward setup visible on the chart.
From a fundamental perspective, the euro remains relatively supported following recent ECB comments signaling a more patient stance on future rate cuts. While inflation in the Eurozone has shown some signs of easing, policymakers remain cautious, especially with energy prices fluctuating again. On the other side, the Canadian dollar has been under pressure due to weaker-than-expected domestic growth and the Bank of Canada’s more dovish tone. Crude oil, which typically supports CAD, has been consolidating with no strong bullish drive lately, limiting CAD’s upside potential.
Technically, the current structure favors bullish continuation. The clean rejection from the previous resistance-turned-support, combined with bullish price action forming a higher low, reinforces the bullish setup. As long as the 1.5900 zone holds, this remains a high-probability long trade setup with potential to deliver strong profits in alignment with the trend.
Watch for daily closures above 1.6000 to confirm the next leg higher. Momentum indicators are flattening, and with liquidity sweeping both sides recently, it’s primed for a move. EURCAD remains on my radar for a swing buy opportunity, with the setup offering excellent technical confluence and favorable fundamental backing.
Sell eurcadStrong sell expected in next few weeks
Already too overbought in monthly and weekly time frame
Buy trend Already breaks and retested again
Strong selling area

Sell eurcadStrongly sell expected from this marked area
Monthly and weekly overbought pair
Ready for the bearish correction now
Daily and weekly trend breaks and retested
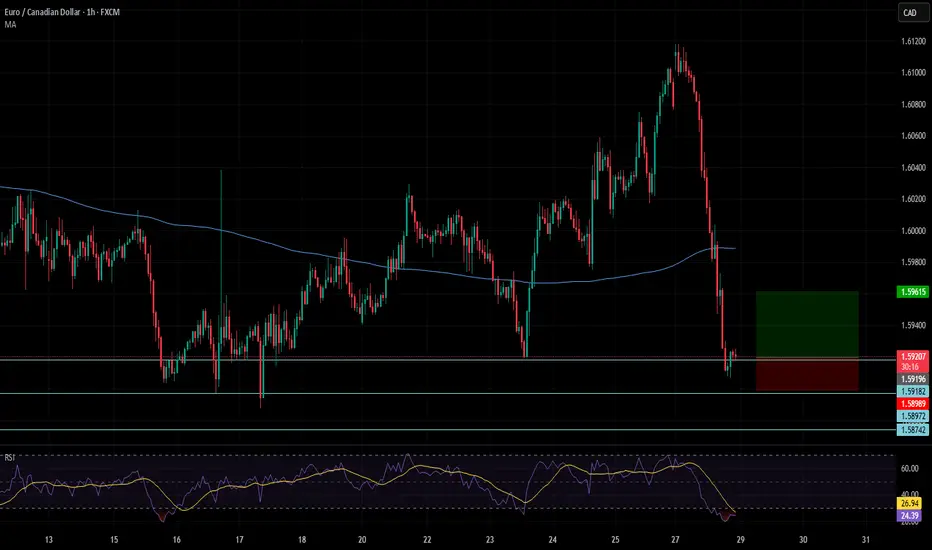
EURCAD Buyers In Panic! SELL!
My dear friends,
My technical analysis for EURCAD is below:
The market is trading on 1.6005 pivot level.
Bias - Bearish
Technical Indicators: Both Super Trend & Pivot HL indicate a highly probable Bearish continuation.
Target - 1.5956
About Used Indicators:
A pivot point is a technical analysis indicator, or calculations, used to determine the overall trend of the market over different time frames.
Disclosure: I am part of Trade Nation's Influencer program and receive a monthly fee for using their TradingView charts in my analysis.
———————————
WISH YOU ALL LUCK
