EUR/CAD is Poised for a DeclineThe pair is trading within a channel and remains below the Ichimoku cloud. Recently, it failed to break above this channel, and with the formation of a bearish candle, EUR/CAD looks ready to drop toward 1.545.
EURCAD trade ideas

EUR/CAD For Bullishyou can go long now
or
wait for pull-back near by entry point and then go long
general trend is up trend
have fun :)

EURCAD Bearish Breakdown – More Downside Potential Ahead?# EURCAD Bearish Breakdown – More Downside Potential Ahead?
**Analysis:**
EURCAD has broken below a key support level at **1.5710**, which previously acted as a consolidation base. This breakdown could signal the start of a deeper bearish move.
The market structure is clearly shifting to the downside, with **lower highs and lower lows** forming. If bearish momentum continues, the price could drop toward the psychological zones around **1.5000** and potentially **1.4500**.
---
**Key Technical Highlights:**
- **Breakdown level:** 1.5710 (former support)
- **Structure:** Bearish
- **Target zone:** 1.5000 – 1.4500
- **Invalidation:** Bullish recovery above 1.5710
---
**Trade Idea (Not Financial Advice):**
Watch for retests below 1.5710 to confirm bearish continuation. Short positions may be considered with proper risk management.
---
> **Disclaimer:**
> This analysis is for educational and informational purposes only and does not constitute financial advice. Always do your own research before making trading decisions. Trading involves risk, and past performance is not indicative of future results.

EurcadAs we can see we hv t ime frame on a down trend am waiting for 4h to change direction ans then retest on de resistance zone den we sell
EURCAD - Bearish Double TOPHello Traders !
The EURCAD failed to break the resistance level (1.59934 - 1.59334).
The price formed a double top pattern.
Currently, The neckline is broken !
So, I expect a bearish move📉
________________
TARGET: 1.54350🎯

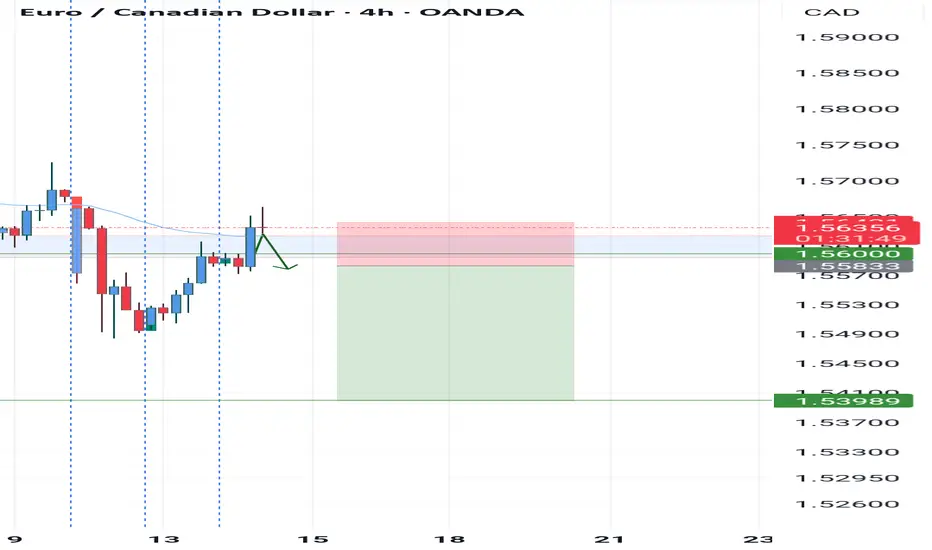
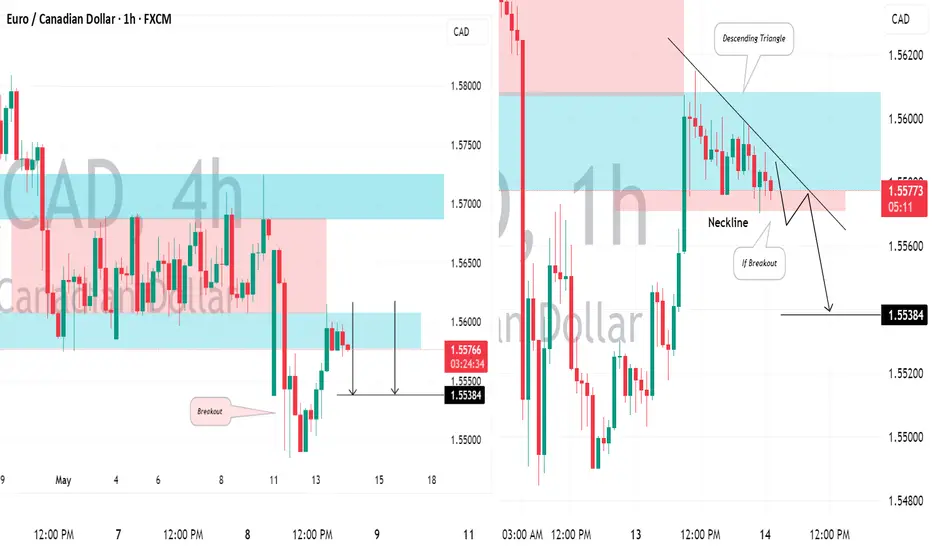
EURCAD: Your Trading Plan For Today⚠️EURCAD is currently testing a recently violated horizontal support level within a trading range.
It is highly likely that this broken structure has now become resistance.
We will look for a confirmation to sell upon a bearish breakout of the neckline of a descending triangle pattern on the 1-hour timeframe.
A close of the hourly candle below 1.5545 will confirm this violation, with an anticipated bearish continuation targeting at least 1.5538.
RISK ON = STRONG AUD...BUT I prefer EURCAD SELLS!!!All the information you need to find a high probability trade are in front of you on the charts so build your trading decisions on 'the facts' of the chart NOT what you think or what you want to happen or even what you heard will happen. If you have enough facts telling you to trade in a certain direction and therefore enough confluence to take a trade, then this is how you will gain consistency in you trading and build confidence. Check out my trade idea!!
www.tradingview.com

EURCAD SELL SETUP EC with the strong break of structure, now on the retest here we could get another potential bearish wave down to the next area of structure! Solid bearish engulfing on the daily as well, and trend line break here...


EURCAD SELL TRADE PLAN📈 🔥 EURCAD TRADE PLAN 🔥
📅 Date: May 05, 2025
📋 Trade Plan Overview:
* Type: Intra-Day
* Direction: Sell
* Confidence: ⭐⭐⭐⭐ (82%)
* Risk:Reward: 3.1:1
* Status: Awaiting Confirmation
Guidance:
Prioritize this plan due to high structural and volume alignment + sentiment skew. Total portfolio risk = 0.50%.
Primary Trade Plan: Intra-Day – Sell
📈 Market Bias & Trade Type
* Bias: Bearish
* Trade Type: Continuation
*
🔰 Confidence Level
* ⭐⭐⭐⭐ (82%)
* Reason: H4 OB + liquidity sweep + internal BOS + D1 bearish structure
* Breakdown: OB 30%, Liquidity 22%, Volume spike 15%, Macro 15%
*
📌 Status
Awaiting Confirmation
📍 Entry Zones
🟥 Primary Sell Zone: 1.5675–1.5695 (H4 OB + 61.8% Fib)
🟧 Secondary Zone: 1.5715–1.5740 (FVG + inducement)
❗ Stop Loss
1.5758 (Above OB + 1x H1 ATR buffer ~60 pips risk)
🎯 Take Profit Targets
* 🥇 TP1: 1.5580 (95 pips, 1.6:1, internal liquidity)
* 🥈 TP2: 1.5490 (185 pips, 3.1:1, clean liquidity pool)
* 🥉 TP3: 1.5400 (275 pips, 4.5:1, D1 swing low)
📏 Risk:Reward
* TP2: 3.1:1
* TP3: 4.5:1
🧠 Management Strategy
* Risk 0.50% of $ ($ , lots)
* SL to breakeven after TP1
* TP1 = 50%, TP2 = 30%, TP3 = 20% trailed
* Exit if H4 BOS against plan or VIX > 25
* Max portfolio risk capped at 3%
⚠️ Confirmation Criteria
* H1 bearish engulfing inside zone
* Volume spike on H1/M30
* Optional: RSI div on M30
* Ideal Entry: London session (2–5 AM NY)
* Avoid 1hr before/after CAD news
⏳ Validity
* Intra-Day Plan: Valid 12–18 hrs from tap
* Expires: May 06, 2025 (NY close if not triggered)
❌ Invalidation
* 1H close above 1.5760
* Macro CAD sentiment shift or DXY flips direction
🌐 Fundamental & Sentiment Snapshot
* COT: EUR heavy long, CAD neutral
* DXY: Softening bias (risk-on)
* Retail: 74% long EURCAD (contrarian)
* Cross-Pair: EURUSD unaligned, GBPCAD bearish
* Cross-Market: Crude Oil firm, supports CAD
* Macro: No ECB/BoC news today
* Sentiment Score: +7/10
* Historical Win Rate (setup type): ~78%
📋 Final Trade Summary
EURCAD is in a bearish continuation with clean structural rejection zones forming on H4. Liquidity sweep + OB confluence + bearish order flow aligns with CAD macro stability. Execution pending confirmation via H1 candle + volume. Maintain strict risk and avoid news overlap.

EURCAD ShortEURCAD is now net short on the regression break.
I am considering my options on the whole market.

Fake change of character The market just created order block liquidity then collected it to push the market to the down side at the bos
EURCAD no3 view, bearish continuation still to expect
OANDA:EURCAD last two analysis on EURCAD doing, going good, will be attached, having now one more update and new view.
Price at end is break RAISING WEDGE and BEARISH FLAG, pushing strong bearish, strong volumem and momentum is gathered and still here having strong bearish expectations.
SUP zone: 1.57200
RES zone: 1.53000, 1.51600

EURCAD is BullishEURCAD price action is giving bullish signals. After breaking out of the falling channel, price has formed a mini inverted head and shoulder on the 30 second chart

EURCADEURCAD Daily chart is in a correction phase. The price has a chance to test the resistance zone 1.57436-1.57940. If the price cannot break through the 1.57940 level, it is expected that the price will drop. Consider selling the red zone.
🔥Trading futures, forex, CFDs and stocks carries a risk of loss.
Please consider carefully whether such trading is suitable for you.
>>GooD Luck 😊
❤️ Like and subscribe to never miss a new idea!

Strong sell eurcadComplete detailed sell structure
Monthly selling area weekly buy trend broken and retested successful

EURCAD Set To Fall! SELL!
My dear followers,
This is my opinion on the EURCAD next move:
The asset is approaching an important pivot point 1.5672
Bias - Bearish
Technical Indicators: Supper Trend generates a clear short signal while Pivot Point HL is currently determining the overall Bearish trend of the market.
Goal - 1.5648
About Used Indicators:
For more efficient signals, super-trend is used in combination with other indicators like Pivot Points.
Disclosure: I am part of Trade Nation's Influencer program and receive a monthly fee for using their TradingView charts in my analysis.
———————————
WISH YOU ALL LUCK

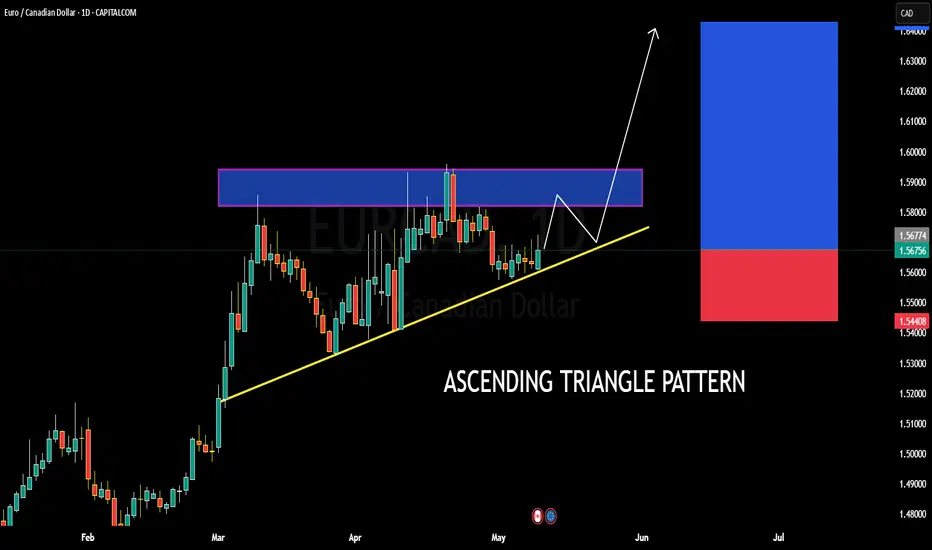
EURCAD BULLISH OR BEARISH DETAILED ANALYSISEURCAD is currently trading around 1.5600 and is consolidating within a textbook ascending triangle pattern on the daily timeframe. This setup signals a strong bullish bias as the pair continues to form higher lows, tightening under a key horizontal resistance zone between 1.5730 and 1.5770. Price is respecting the ascending trendline very well, indicating buyer strength. A breakout above this resistance zone could open the doors for a clean rally toward the 1.6400 psychological level, offering a strong risk-to-reward opportunity.
From a fundamental standpoint, the euro is gaining traction as recent Eurozone economic indicators suggest improving sentiment and a potential shift in ECB tone toward neutral. Meanwhile, the Canadian dollar remains pressured by falling crude oil prices and softening domestic data, including disappointing employment numbers this week. This divergence in fundamentals aligns well with the bullish technical structure for EURCAD, creating a high-probability scenario for buyers.
Looking ahead, a confirmed breakout above 1.5770 with volume could trigger a strong bullish impulse. The measured move from the triangle’s base supports a projection toward the 1.6400 area, making this setup attractive for swing traders aiming to ride the next leg higher. Risk should remain controlled below 1.5440, where the ascending structure would be invalidated.
I’m closely monitoring the price action near the breakout zone. Patience is key, but once we see bullish momentum pushing through the resistance, this trade setup has the potential to deliver a solid upside run. EURCAD remains one of my top bullish forex plays going into mid-May.
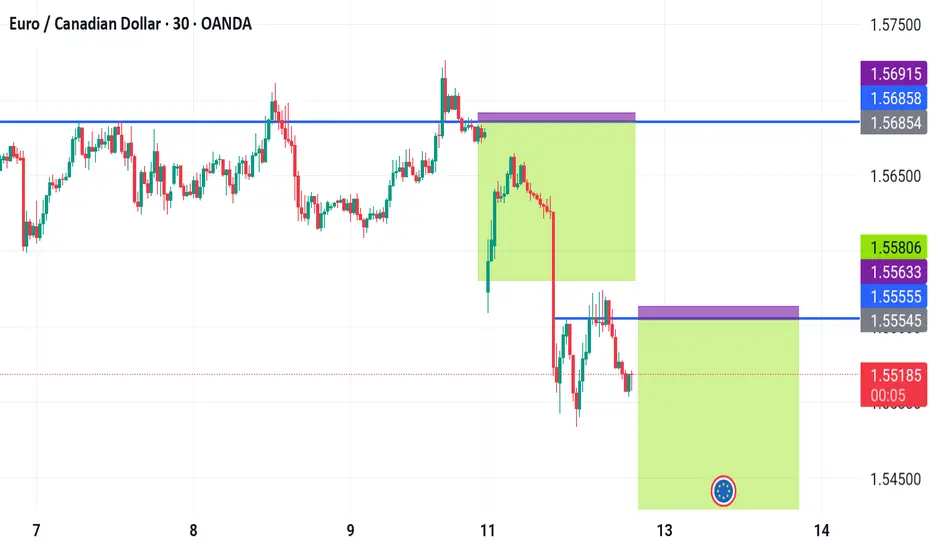
EURCADPrice looks like its near a support zone dating back to around mid March of this year. Price has recently been rising on decreasing volume. Since price broke the previous high of mid March, price is trading sideways as well. Looking for a retracement for price to reach the target zone on the chart.

09.05.25 Morning ForecastPairs on Watch -
FX:EURCAD
FX:USDCHF
FX:EURUSD
FOREXCOM:COFFEE
Heads up guys!! I will be heading to Greece today so next week my morning forecast videos may not be as consistent, due to internet and just not having my full equipment, so I will do my very best to get some forecasting posted for you all!
A short overview of the instruments I am looking at for today, multi-timeframe analysis down to what I will be looking at for an entry. Enjoy!

EUR_CAD MOVE DOWN AHEAD|SHORT|
✅EUR_CAD is consolidating
Beneath the horizontal resistance
Of 1.5700 and as we are bearish
Biased we will be expecting
A further bearish move
Down towards the target
Below around 1.5573
SHORT🔥
✅Like and subscribe to never miss a new idea!✅
Disclosure: I am part of Trade Nation's Influencer program and receive a monthly fee for using their TradingView charts in my analysis.

Will EURCAD rise from a strong Support LevelHello Traders
In This Chart EURCAD HOURLY Forex Forecast By FOREX PLANET
today Gold analysis 👆
🟢This Chart includes_ (EURCAD market update)
🟢What is The Next Opportunity on EURCAD Market
🟢how to Enter to the Valid Entry With Assurance Profit
This CHART is For Trader's that Want to Improve Their Technical Analysis Skills and Their Trading By Understanding How To Analyze The Market Using Multiple Timeframes and Understanding The Bigger Picture on the Charts
