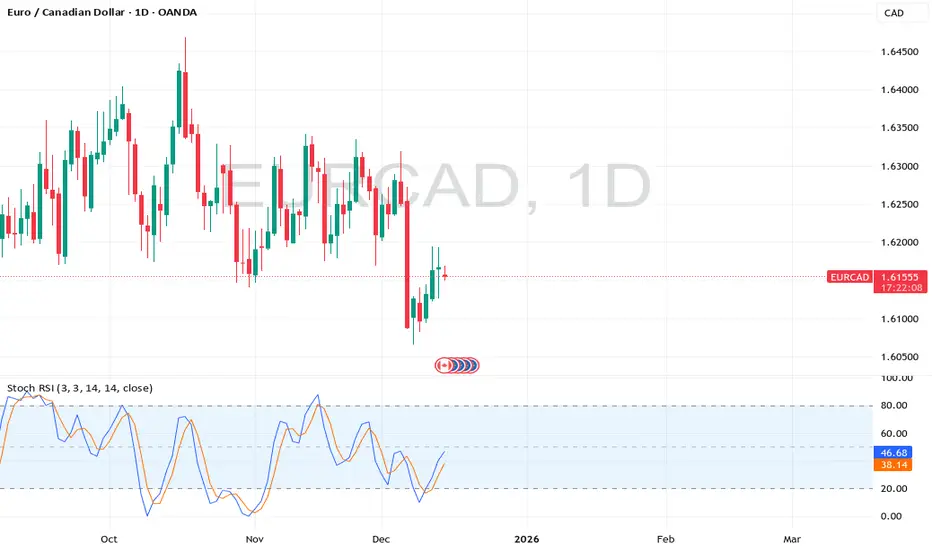
EURCAD: Bearish Rally Continues 🇪🇺🇨🇦
EURCAD turned strongly bearish on Friday.
The price broke and closed below a significant daily support cluster.
There is a high probability that the market will continue falling next week.
Next support - 1.6047
❤️Please, support my work with like, thank you!❤️
I am part of Trade Nation's Influencer program and receive a monthly fee for using their TradingView charts in my analysis.
Euro / Canadian Dollar
No trades
Trade ideas

Is the Euro Gaining Strength Against the CAD Again?🎯 EUR/CAD SWING TRADE SETUP | FOREX OPPORTUNITY 💱
━━━━━━━━━━━━━━━━━━━━━━━━━━━━━━━━━━━━━━━━━━
📊 ASSET: EUR/CAD (Euro vs Canadian Dollar)
⏱️ TIMEFRAME: Swing Trade (Multi-Day Hold)
🎬 SETUP: Bullish Reversal - Weighted Moving Average Pullback
📈 BIAS: BULLISH ✅
━━━━━━━━━━━━━━━━━━━━━━━━━━━━━━━━━━━━━━━━━━
🔍 TRADE PLAN BREAKDOWN
📍 ENTRY STRATEGY - "Layering Method" (Multiple Limit Orders)
For optimal entries, use the THIEF layering strategy with staggered limit buy orders:
✅ Layer 1: 1.61800 (Initial Entry)
✅ Layer 2: 1.62000 (Aggressive Entry)
✅ Layer 3: 1.62200 (Dip Entry)
🎯 Tip: Customize layers based on your account risk & trading style
🛑 STOP LOSS
📌 Primary SL Level: 1.61500
⚠️ Note: Adjust your stop loss according to YOUR risk tolerance & strategy. This is a reference level only. Risk management is YOUR responsibility.
🎁 TAKE PROFIT TARGET
🚀 Target Level: 1.64000
📌 Reason: Moving averages acting as dynamic resistance + overbought zone + potential trap breakout
⚠️ Note: Set YOUR own profit targets based on market structure & personal strategy. This is NOT financial advice—always manage risk responsibly.
💡 KEY CONFLUENCE FACTORS
✓ Bullish weighted moving average pullback
✓ Support zone hold at entry levels
✓ Risk/Reward ratio favorable for swing trading
✓ Multiple entry confirmation points
━━━━━━━━━━━━━━━━━━━━━━━━━━━━━━━━━━━━━━━━━━
🌐 CORRELATED PAIRS TO WATCH
1️⃣ OANDA:USDCAD (US Dollar vs Canadian Dollar) 🇺🇸🇨🇦
📊 Inverse Correlation: When USD/CAD rises → EUR/CAD likely falls
💥 Why It Matters: CAD movements drive both pairs; monitor for conflicting signals
🔗 Watch Level: 1.4200+ = CAD strength headwinds for EUR/CAD
2️⃣ FX:EURUSD (Euro vs US Dollar) 🇪🇺🇺🇸
📊 Direct Correlation: Both share EUR component
💥 Why It Matters: EUR strength here = EUR/CAD bullish confirmation
🔗 Watch Level: 1.0800+ = EUR strength = EUR/CAD support
3️⃣ BLACKBULL:WTI Crude Oil 🛢️📈
📊 Positive Correlation: CAD is commodity-driven (oil exporter)
💥 Why It Matters: Oil rally = CAD strength = EUR/CAD pressure
🔗 Watch Level: Oil $75-80/barrel = possible CAD headwind
4️⃣ $S&P500 (SPY/ES) 📊📉
📊 Risk Sentiment: Risk-on = CAD rally, Risk-off = CAD weakness
💥 Why It Matters: Market volatility directly impacts commodity currencies
🔗 Watch Level: SPY weakness = possible CAD weakness = EUR/CAD tailwind
5️⃣ TVC:GOLD (XAU/USD) 🏆💰
📊 Inverse with USD: Gold up = USD weakness = EUR/CAD strength
💥 Why It Matters: Safe-haven flows affect both pairs differently
🔗 Watch Level: Gold $2,100+ = possible EUR strength
━━━━━━━━━━━━━━━━━━━━━━━━━━━━━━━━━━━━━━━━━━
👍 LIKE | 💬 FOLLOW | 📌 SAVE FOR UPDATES
Your trading success is YOUR responsibility. Trade with conviction & proper risk management. ✨

EURCAD higher bearish expectations
OANDA:EURCAD last what we are see is be break of DESCENDING TRIANGL, currently price on trend line, expecting here break of same.
SUP zone: 1.62800
RES zone: 1.60500, 1.60000

EURCAD SHORT POSITIONEURCAR SHORT POSITION
base on technical and chart base
trendline and candle stick

EURCAD 3H SELL IDEAEURCAD Needs to Grab More liquidity from the downside before it can continue buying,
We have a tight stop loss because london has swept the asia High

EUR/CAD: Bullish Movement Continues?!The 📈EURCAD pair has recently formed an ascending triangle pattern, following a successful test of a significant intraday horizontal support level.
The violation of its neckline suggests a strong presence of buyers in the market.
It is anticipated that the pair will continue its upward trajectory, potentially reaching at least the 1.6311 marked.

Buy EUR/CAD at bottom of channel.The EUR/CAD is approaching the bottom of a channel which is also the same level as the 100 Daily Moving Average. Seems a good place to buy to push the price action back up to recent highs.
Buy Limit : 1.6170 bottom of channel
Stop : 1.6058 under strong support
Profit : 1.6450 before previous high
Risk 1 : 2.5 / Stop is 112 pips

EURCAD Expected Growth! BUY!
My dear subscribers,
This is my opinion on the EURCAD next move:
The instrument tests an important psychological level 1.6182
Bias - Bullish
Technical Indicators: Supper Trend gives a precise Bullish signal, while Pivot Point HL predicts price changes and potential reversals in the market.
Target - 1.6228
About Used Indicators:
On the subsequent day, trading above the pivot point is thought to indicate ongoing bullish sentiment, while trading below the pivot point indicates bearish sentiment.
Disclosure: I am part of Trade Nation's Influencer program and receive a monthly fee for using their TradingView charts in my analysis.
———————————
WISH YOU ALL LUCK

EURCAD is in The Bullish TrendHello Traders
In This Chart EURCAD HOURLY Forex Forecast By FOREX PLANET
today EURCAD analysis 👆
🟢This Chart includes_ (EURCAD market update)
🟢What is The Next Opportunity on EURCAD Market
🟢how to Enter to the Valid Entry With Assurance Profit
This CHART is For Trader's that Want to Improve Their Technical Analysis Skills and Their Trading By Understanding How To Analyze The Market Using Multiple Timeframes and Understanding The Bigger Picture on the Charts


EURCAD: Bearish Continuation is Expected! Here is Why:
Our strategy, polished by years of trial and error has helped us identify what seems to be a great trading opportunity and we are here to share it with you as the time is ripe for us to sell EURCAD.
Disclosure: I am part of Trade Nation's Influencer program and receive a monthly fee for using their TradingView charts in my analysis.
❤️ Please, support our work with like & comment! ❤️

Potential BEARSIn our humble opinion we think that, the market is making some sort of correction and in turn, printing out a good harmonic pattern, so we think the market is setting up for a good dive. Until then, we stay Dovish in this pair at least for some good pips

buy eurcadlow probability setup on eurcad so i wouldnt risk much. should price continue going up, im expecting a 62% retracement of the 4hr candle at some point within the week where price would then continue with the up trend

Bearish reevrsal off key resistance?EUR/CAD is rising towards the pivot, which acts as an overlap resistance that aligns witht he 127.2% Fibonacci extension and could reverse to the 1st support.
Pivot: 1.62915
1st Support: 1.62393
1st Resistance: 1.63225
Disclaimer:
The opinions given above constitute general market commentary and do not constitute the opinion or advice of IC Markets or any form of personal or investment advice.
Any opinions, news, research, analyses, prices, other information, or links to third-party sites contained on this website are provided on an "as-is" basis, are intended to be informative only, and are not advice, a recommendation, research, a record of our trading prices, an offer of, or solicitation for, a transaction in any financial instrument and thus should not be treated as such. The information provided does not involve any specific investment objectives, financial situation, or needs of any specific person who may receive it. Please be aware that past performance is not a reliable indicator of future performance and/or results. Past performance or forward-looking scenarios based upon the reasonable beliefs of the third-party provider are not a guarantee of future performance. Actual results may differ materially from those anticipated in forward-looking or past performance statements. IC Markets makes no representation or warranty and assumes no liability as to the accuracy or completeness of the information provided, nor any loss arising from any investment based on a recommendation, forecast, or any information supplied by any third party.


EUR/CAD SENDS CLEAR BEARISH SIGNALS|SHORT
EUR/CAD SIGNAL
Trade Direction: short
Entry Level: 1.626
Target Level: 1.624
Stop Loss: 1.628
RISK PROFILE
Risk level: medium
Suggested risk: 1%
Timeframe: 1h
Disclosure: I am part of Trade Nation's Influencer program and receive a monthly fee for using their TradingView charts in my analysis.
✅LIKE AND COMMENT MY IDEAS✅

EURCAD shortEURCAD has been bearish on the higher timeframes(weekly and daily)so all I had to wait for was retest of the head and shoulders pattern on the 4hr timeframe to continue with the bearish trend.

Bearish drop off?AUD/CHF is reacting off the resistance level, which is a pullback resistance and could drop from this level to our take profit.
Entry: 0.91626
Why we like it:
There is a pullback resistance level
Stop loss: 0.91861
Why we like it:
There is an overlap resistance level.
Take profit: 0.91181
Why we like it:
There is a pullback support level that is slightly above the 100% Fibonacci projection.
Enjoying your TradingView experience? Review us!
Please be advised that the information presented on TradingView is provided to Vantage (‘Vantage Global Limited’, ‘we’) by a third-party provider (‘Everest Fortune Group’). Please be reminded that you are solely responsible for the trading decisions on your account. There is a very high degree of risk involved in trading. Any information and/or content is intended entirely for research, educational and informational purposes only and does not constitute investment or consultation advice or investment strategy. The information is not tailored to the investment needs of any specific person and therefore does not involve a consideration of any of the investment objectives, financial situation or needs of any viewer that may receive it. Kindly also note that past performance is not a reliable indicator of future results. Actual results may differ materially from those anticipated in forward-looking or past performance statements. We assume no liability as to the accuracy or completeness of any of the information and/or content provided herein and the Company cannot be held responsible for any omission, mistake nor for any loss or damage including without limitation to any loss of profit which may arise from reliance on any information supplied by Everest Fortune Group.

EURCAD Daily market outlookEUR/CAD Daily Outlook
On the daily chart, the previous support level has been broken and is now acting as resistance. Price is currently retesting this zone, which suggests a continuation of the bearish trend.
For today’s session, my bias remains to the downside, with an intraday target around 1.6100—a significant psychological level and major round number.
As always, ensure you calculate your own risk-to-reward ratio before entering any position. Trade responsibly and happy trading!

Emergency Update #1 Dont Short this one The reason is because the signal has reversed i feel
so sad because i was hoping i found a good top
to Short this one but the signal
has reversed because the bulls
have won the fight
this means the crowd has won..
So even if we was against the crowd the crowd has
won
If you where short exit this trade immediate.
Rocket boost this content to learn more
Disclaimer: Trading is risky please use a simulation trading account
before you trade with real money.

Is EUR/CAD Ready for Takeoff After the ATR Pullback?💶💰 EUR/CAD: The Pullback Heist Setup | Swing/Day Trade
🎯 THE SETUP
Pair: EUR/CAD (Euro vs Canadian Dollar)
Market: Forex | Timeframe: Flexible (Swing/Day Trade)
Bias: 📈 BULLISH — Confirmed via ATR Pullback Retest
📊 GAME PLAN
The setup identifies a bullish pullback retest structure with ATR (Average True Range) confirmation, creating a high-probability entry zone. This is your "heist opportunity" — multiple entry layers maximize your chances of catching the move.
🎬 ENTRY STRATEGY: LAYERED LIMIT ORDERS
Think of it like stacking chips at the table — multiple small bets beat one big bet:
🔴 Layer 1 at price level 1.61400 — First reconnaissance move to test the waters and gauge initial momentum.
🔴 Layer 2 at price level 1.61600 — Confirm momentum building as price holds and retests the zone.
🔴 Layer 3 at price level 1.61800 — Build your core position as conviction strengthens with each layer filled.
🔴 Layer 4 at price level 1.62000 — Final accumulation layer to complete your position size.
Note: Adjust layers based on your position sizing and risk tolerance. Start with what fits your account!
🛑 STOP LOSS PLACEMENT
Thief SL: 1.61000
⚠️ Risk Disclaimer: Stop loss is your safety net, not a guaranteed protection. Set it based on your personal risk management rules and account capital. Your risk, your rules!
🎁 PROFIT TARGETS
🟢 TARGET 1 (TP1) at 1.63200 — This is where the Hull MA acts as an overbought zone, signaling time to lock in 60% of your position. This is your first checkpoint to secure profits before things get spicy.
🟢 TARGET 2 (TP2) at 1.64500 — This level is the "Police Barricade" — a strong resistance cluster with overbought conditions brewing. This is where the TRAP zone activates. Don't get greedy here! Escape with your remaining 40% of profits and live to trade another day.
⚠️ Profit Target Note: These are suggested levels based on technical structure. Your take-profit strategy is YOUR decision. Trade responsibly!
🔗 CORRELATED PAIRS TO WATCH (Use as Confluence)
📍 USD Strength Indicators
💵 FX:EURUSD — Key Correlation: Inverse relationship. If EUR/USD rallies, EUR/CAD typically strengthens (bullish for setup). When the Euro pumps against the Dollar, CAD strength becomes less relevant, giving EUR/CAD room to fly.
🍁 OANDA:USDCAD — Key Correlation: Direct inverse. USD/CAD weakness = EUR/CAD strength. Monitor USD/CAD for divergence — if it's breaking down while our setup fires, that's GOLDEN confluence.
📍 Commodity Pairs (Loonie Movement)
🛢️ OANDA:USDCAD (Oil Sensitivity) — Canadian Dollar is heavily influenced by crude oil prices. Oil strength = CAD strength = potential headwind for EUR/CAD. Check oil charts before entering! Rising oil can kill your bullish trade.
🍁 OANDA:CADJPY — Reflects broader CAD sentiment across majors. Monitor for divergence signals. If CAD is rallying across the board, EUR/CAD might struggle against the Loonie.
📍 Technical Synergy
🔄 OANDA:EURGBP — Shows Euro strength relative to other majors. If EUR/GBP is bullish, EUR/CAD confluence improves significantly. This is your Euro strength confirmation.
📉 TVC:DXY (Dollar Index) — Broader USD weakness supports Euro strength. Watch for DXY breakdown below key support — when the Dollar bleeds, the Euro typically thrives.
Key Point: Use these pairs as confirmation tools, not entry signals. Multi-pair confluence = higher probability trades.
🔑 KEY TECHNICAL POINTS
✅ ATR Pullback Retest — Price returned to support + ATR shows volatility compression = reversal setup that signals buyers stepping in.
✅ Layered Entry Strategy — Reduces average entry price and eliminates emotional FOMO trading by spreading your risk intelligently.
✅ Multiple Profit Targets — Risk-to-reward ratio calculated at 1.63200 (TP1) and 1.64500 (TP2) with proper scaling strategy.
✅ Overbought Zone Identified — Hull MA and resistance cluster at 1.64500 = natural exit point before the reversal crushes your profits.
⚡ QUICK RULES FOR THIS HEIST
DON'T enter all layers at once — patience is the thief's best friend. Spread them out!
DO move stops to breakeven after first target hit — locks in your win and removes risk.
DO scale out at resistance levels (don't hold to the end) — never let profits become losses.
DON'T average down below the stop loss — that's how traders blow up accounts.
DO respect the "Police Barricade" resistance — it's there for a reason and will stop you out if you ignore it!
📌 TRADE MANAGEMENT CHECKLIST
Set limit orders at all 4 layers (1.61400, 1.61600, 1.61800, 1.62000)
Stop loss placed at 1.61000 with proper position sizing
First target exit ready at 1.63200 (60% of position)
Second target exit ready at 1.64500 (remaining 40%)
Risk-to-reward ratio calculated before entering
Trade size appropriate for account size and risk tolerance
💡 WHY THIS SETUP WORKS
The confluence of pullback retest + ATR confirmation + multi-level resistance creates a high-probability zone where smart money typically enters. By using layered entries, you're not betting the farm on one price level — you're working with market structure, not against it. This is how professionals trade without the emotional baggage. You're stacking the odds in your favor by letting price come to you through multiple layers.
✨ If you find value in my analysis, a 👍 and 🚀 boost is much appreciated — it helps me share more setups with the community!
#EUR/CAD #ForexTrading #SwingTrading #DayTrading #ThiefOG #TechnicalAnalysis #ATR #BullishSetup #TradingStrategy #ForexSignals #PullbackRetest #LayeredEntry #RiskManagement #TradingCommunity
Happy Trading, Thief OG Crew! 🎭💰

Update on EURCADWe've been waiting for almost 14 days for the price to either get supported or break the support, and now at the end of the week it’s finally making a very weak penetration. But for us, it’s already too late since the week has ended. We’ll analyze it again in next week’s watchlist, hoping that the move finally begins next week.
