EURCAD X MODEL SETUPSold EurCad after seeing the grab of the previous daily high and there was a 4H fvg to target lower.
EURCAD trade ideas

EURCAD: Short Signal Explained
EURCAD
- Classic bearish pattern
- Our team expects retracement
SUGGESTED TRADE:
Swing Trade
Sell EURCAD
Entry - 1.4994
Stop - 1.5060
Take - 1.4879
Our Risk - 1%
Start protection of your profits from lower levels
❤️ Please, support our work with like & comment! ❤️

CURRENTLY MAKING HH HLTHE MOVEMENT IS CURENTLY BULLISH. Price is bouncing up and down based on horizontal support and resistance.

Potential bullish rise?EUR/CAD has reacted off the support level which is an overlap support and could rise from this level to our take profit.
Entry: 1.4921
Why we like it:
There is an overlap support level that is slightly above the 38.2% Fibonacci retracement.
Stop loss: 1.4842
Why we like it:
There is a pullback support that is slightly above the 61.8% Fibonacci retracement.
Take profit: 1.5043
Why we like it:
There is a pullback resistance level.
Enjoying your TradingView experience? Review us!
Please be advised that the information presented on TradingView is provided to Vantage (‘Vantage Global Limited’, ‘we’) by a third-party provider (‘Everest Fortune Group’). Please be reminded that you are solely responsible for the trading decisions on your account. There is a very high degree of risk involved in trading. Any information and/or content is intended entirely for research, educational and informational purposes only and does not constitute investment or consultation advice or investment strategy. The information is not tailored to the investment needs of any specific person and therefore does not involve a consideration of any of the investment objectives, financial situation or needs of any viewer that may receive it. Kindly also note that past performance is not a reliable indicator of future results. Actual results may differ materially from those anticipated in forward-looking or past performance statements. We assume no liability as to the accuracy or completeness of any of the information and/or content provided herein and the Company cannot be held responsible for any omission, mistake nor for any loss or damage including without limitation to any loss of profit which may arise from reliance on any information supplied by Everest Fortune Group.

EUR/CAD BEARISH BIAS RIGHT NOW| SHORT
Hello, Friends!
We are targeting the 1.480 level area with our short trade on EUR/CAD which is based on the fact that the pair is overbought on the BB band scale and is also approaching a resistance line above thus going us a good entry option.
✅LIKE AND COMMENT MY IDEAS✅

EURCAD LongWe have a Break of structure on this pair. we are waiting for a retest of 15 minutes Fair value gap to bwe retested in order to buy. We buy at around 1.4800

EURCAD - 1H - Bearish ReversalFollowing are the factors involved in Bearish Reversal:
1. Bearish Divergence
2. Double Top Pattern

EURCADEURCAD is in bullish trend.
Potentially printing HH and HL.
Aligator show strong sign trend will go up.
we go with the trend and buy at CMP.

EURCAD Possible Bearish Movement.Daily on a bearish trend, also breaking previous support on the daily. The Bos created a strong supply zone in the 4hr. Price retracing to the 4hr resistance zone for a possible sell movement'
Risk Management very Important.

EURCAD at Major Resistance – Short Opportunity Ahead?OANDA:EURCAD is currently testing a significant resistance zone. This area has seen strong selling pressure, leading to notable bearish moves. The recent bullish push into this resistance zone suggests a potential for sellers to regain control.
A bearish confirmation, such as rejection candles, bearish engulfing patterns, or long upper wicks, would increase the probability of a downward move. If this scenario unfolds, the price could head toward the 1.49017 level.
Traders should remain cautious and wait for clear signs of selling pressure before considering short positions. Proper risk management is essential, given the possibility of a break above the resistance zone.

EURCAD SHORT 02 (RE-ENTRY)ICMARKETS:EURCAD
Trade Execution Plan (Sell Setup)
Trade Type: Sell (Short Position)
Sell Entry (Market Execution or Pending Order): 1.4860-1.4890 (High Confluence Zone).
Stop-Loss (SL): 1.4921 (Above Key Structure & Stop Hunt Zone).
Take Profit 1 (TP1): 1.4750 (H4 Key Support & 50% Fib).
Take Profit 2 (TP2): 1.4700 (Major Demand Zone).
Take Profit 3 (TP3): 1.4620 (Swing Target).
Risk-to-Reward Ratio (R:R): 1:3+ (Good Institutional Setup).
Bearish Confidence Level: 🔥 85% (If Price Holds Below 1.4890).

EUR/CAD "Euro vs Canadian" Forex Market Heist Plan on Bullish🌟Hi! Hola! Ola! Bonjour! Hallo!🌟
Dear Money Makers & Robbers, 🤑 💰
Based on 🔥Thief Trading style technical and fundamental analysis🔥, here is our master plan to heist the EUR/CAD "Euro vs Canadian" Forex market. Please adhere to the strategy I've outlined in the chart, which emphasizes long entry. Our aim is the high-risk Red Zone. Risky level, overbought market, consolidation, trend reversal, trap at the level where traders and bearish robbers are stronger. Be wealthy and safe trade.💪🏆🎉
Entry 📈 : Traders & Thieves with New Entry A bull trade can be initiated on the MA level breakout of 1.50500
However I advise placing Buy limit orders within a 15 or 30 minute timeframe. Entry from the most recent or closest low or high level should be in retest.
Stop Loss 🛑: Using the 4H period, the recent / nearest low or high level.
Goal 🎯: 1.52300 (or) Escape Before the Target
Scalpers, take note 👀 : only scalp on the Long side. If you have a lot of money, you can go straight away; if not, you can join swing traders and carry out the robbery plan. Use trailing SL to safeguard your money 💰.
Fundamental Outlook 📰🗞️ the EUR/CAD is expected to move in a bullish direction.
REASONS FOR BULLISH TREND:
European Economic Recovery: The European economy is showing signs of recovery, with the Eurozone's GDP growth rate expected to increase in the coming months. This could lead to an increase in demand for the Euro, which would support the EUR/CAD.
Canadian Economic Slowdown: The Canadian economy is expected to slow down in the coming months, due to the decline in oil prices and the impact of the COVID-19 pandemic on the country's tourism and travel industries. This could lead to a decrease in demand for the Canadian Dollar, which would support the EUR/CAD.
Interest Rate Divergence: The European Central Bank (ECB) is expected to keep interest rates low, while the Bank of Canada (BoC) is expected to raise interest rates in the coming months. This interest rate divergence could lead to an increase in demand for the Euro, which would support the EUR/CAD.
Trade Balance: The Eurozone's trade balance is expected to improve in the coming months, due to an increase in exports and a decrease in imports. This could lead to an increase in demand for the Euro, which would support the EUR/CAD.
Technical Analysis: The technical analysis for EUR/CAD is currently bullish, with the price trading above its 50-day and 200-day moving averages.
Trading Alert⚠️ : News Releases and Position Management 📰 🗞️ 🚫🚏
As a reminder, news releases can have a significant impact on market prices and volatility. To minimize potential losses and protect your running positions,
we recommend the following:
Avoid taking new trades during news releases
Use trailing stop-loss orders to protect your running positions and lock in profits
Please note that this is a general analysis and not personalized investment advice. It's essential to consider your own risk tolerance and market analysis before making any investment decisions.
Keep in mind that these factors can change rapidly, and it's essential to stay up-to-date with market developments and adjust your analysis accordingly.
💖Supporting our robbery plan will enable us to effortlessly make and steal money 💰💵 Tell your friends, Colleagues and family to follow, like, and share. Boost the strength of our robbery team. Every day in this market make money with ease by using the Thief Trading Style.🏆💪🤝❤️🎉🚀
I'll see you soon with another heist plan, so stay tuned 🫂

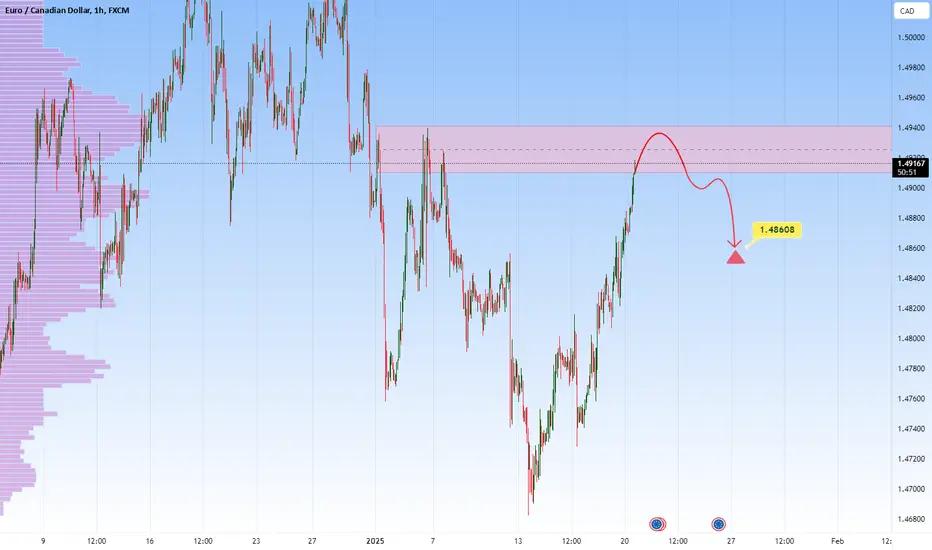
EURCAD - Potential Sell From Resistance ZoneEURCAD is testing a major resistance zone that has previously led to significant bearish reversals. The recent bullish momentum into this area increases the likelihood of seller interest.
If bearish confirmation emerges, such as rejection wicks, bearish engulfing candles, or increased selling volume, I anticipate a move toward 1.48608. However, a breakout above this resistance could signal further bullish continuation.
Traders should remain cautious and wait for clear signals of rejection before taking positions. Agree with this analysis? Let’s discuss further in the comments section!
20-1 EURCAD :There is a nice increase since 15th of January. because of the small correction today we can enter at 1.49340. Our signal system shows a Score of 0 which is neutral. This score consists of Cot Data 0 Retail Sentiment 1 Seasonality 1 Trend reading -2 GDP 1 Manufacturing PMI -2 Services PMI 1 Retail Sales 0 Inflation 1 Employment Change 0 Unemployment Rate -1 Interest Rates 0.


EURCAD A Fall Expected! SELL!
My dear friends,
EURCAD looks like it will make a good move, and here are the details:
The market is trading on 1.4885 pivot level.
Bias - Bearish
Technical Indicators: Supper Trend generates a clear short signal while Pivot Point HL is currently determining the overall Bearish trend of the market.
Goal - 1.4814
Recommended Stop Loss - 1.4929
About Used Indicators:
Pivot points are a great way to identify areas of support and resistance, but they work best when combined with other kinds of technical analysis
———————————
WISH YOU ALL LUCK

EurcadEurcad on de 1 week is on a down trend and 1d is on a down trend then am waiting for a break and retest on de 4hr for the market to change direction then we sell am back 😀

EAURCAD - ShortThe current trend is bearish and price is approaching an internal area of demand. If H4 demand holds, then we could see price head lower to a higher time-frame supply zone, before considering longs.

EURCAD Trading ideasWe are also bullish on the USD and the CAD tends to correlate with USD strength. Speculators are heavily long the euro and we expect them to get hit on stop
Sell EURCAD at the liquidity area be aware of Trump 20th jan 2025

EURCAD SELL IDEASell: 1.4800-4830
SL: 1.4870
TP1: 1.4700
TP2: 1.4650
For additional confirmation wait for price action on min H1 OR H4.
OR
Look for regular divergence on lower time frame or hidden divergence from the sell zone.
This would add to the probability of the trade idea.

EURCAD Under Pressure! SELL!
My dear friends,
My technical analysis for EURCAD is below:
The market is trading on 1.4844 pivot level.
Bias - Bearish
Technical Indicators: Both Super Trend & Pivot HL indicate a highly probable Bearish continuation.
Target - 1.4774
About Used Indicators:
A pivot point is a technical analysis indicator, or calculations, used to determine the overall trend of the market over different time frames.
———————————
WISH YOU ALL LUCK

EURCAD - Short TradePrice is in bearish trend printing lower highs and lower lows.
No bullish divergence is formed.
Entry is at CMP.
SL is above previous LH.

EUR/CAD Bearish AnalysisEUR/CAD Bearish Analysis.
Price is in a downward channel and creating LLs and LHs, I am expecting price to create LH at the .886 level at approximately 1.4919 and taking this to create another LL which may end the bearish movement and beginning of a HL on a larger TF.
IF the price breaks above the previous high then it is invalidated which could signal the beginning of a bullish movement, hence the tight SL and the 1:12+ RR.
