EURCAD - Buy LimitEURCAD has formed inverted head and shoulders pattern.
It has also broken above the resistance which shows that the trend may continue to move bullish. It will come to retest the resistance (which now may act as a support). We'll buy with the stop loss below trendline and previous low.
EURCAD trade ideas

EUR/CAD Daily AnalysisPrice is back above 1.49 for the first time this month.
Over August to November, price bounced between 1.49 and 1.5160 several times as the market was rangebound.
Will the market now head towards 1.5160 again?
There is a BOC rate statement coming up this week. Rates are expected to be reduced.
A weaker CAD could help with the push higher.


EURCAD SELLEUR/CAD 4-hour timeframe with respect to Wyckoff market cycle stages and current price action. Here's the step-by-step evaluation:
Wyckoff Analysis
Distribution Phase:
The chart shows a prolonged sideways range at the top (above 1.50), suggesting a distribution phase. This is evident from the multiple rejections at the resistance zone around 1.51679.
The volume during this range shows spikes on bearish candles, indicating selling pressure by smart money.
Markdown Phase:
Following the breakdown from the range, the price formed a clear impulsive downtrend, completing a 5-wave Elliott pattern (labeled as 1 to 5 in the chart).
The markdown culminated near 1.44886, which aligns with strong support and Fibonacci extension levels (1.618 at 1.45131). Volume increased significantly.

First buy, later sellFirst buy, later sell. News in the following days will make cad pairs very fluctuated.

#EUR #CAD Short Set UpWe had a double top with bearish divergence and neckline was broken. Taking a short at current price 1.49402
Entry 1.49402
Stoploss1.49685
TP-1 1.49119
TP-2 1.48836

EUR_CAD WILL KEEP GROWING|LONG|
✅EUR_CAD keeps growing
And the pair made a breakout
Of the key level of 1.4900
Which is now a support and
Then made a pullback, a retest
And a rebound so we are now
Bullish biased and we will be
Expecting a further bullish
Move upwards
LONG🚀
✅Like and subscribe to never miss a new idea!✅

EURCADEURCAD has formed inverted Head and Shoulder. As the buyers are getting bids with this confluence.
If the sell pressure resumes and buyers gets active the optimum target will be 1.5200
What you people think of this idea ?

EURCAD Buy ForecastEURCAD New forecast👨💻👨💻
Note:
Follow proper risk management rules. Never risk more then 2% of your total capital. Money management is the key of success in this business...... Set your own SL & TP.
Please support this idea with a Like and COMMENT if you find it useful click "follow" on our profile if you will like these type of trading ideas delivered straight to your email in the future.
Thanks for your continued support!! lemme know your thoughts in the comment sec...

EURCAD is in a Bullish Pattern After Testing daily SupportHello Traders
In This Chart GOLD HOURLY Forex Forecast By FOREX PLANET
today Gold analysis 👆
🟢This Chart includes_ (GOLD market update)
🟢What is The Next Opportunity on GOLD Market
🟢how to Enter to the Valid Entry With Assurance Profit
This CHART is For Trader's that Want to Improve Their Technical Analysis Skills and Their Trading By Understanding How To Analyze The Market Using Multiple Timeframes and Understanding The Bigger Picture on the Charts

EUR/CAD - Weekly Analysis"On Monthly:
200, 50 and 20 EMA are showing Bullish move as the overall move indicates.
Price moving back down to test 1.47140 another Psychological Support , but it didn't reach and pulled back up.
It seems it's moving up toward 1.52000 a psychological resistant.
-- On Weekly:
Two solid Bullish candle revered the bearish attempt and price is moving towards 1.5070. All three EMAs, 200, 50 and 20 (RGB) are on order supporting Bullish move.
--On Daily:
The inverted Head & Shoulders has broken neck and Bullish move is going full steam.
All three EMAs, 200, 50 and 20 (RGB) not sequentially, but they are supporting bullish move.
-- On Hourly:
it seems, it has created Rising Wedge, showing exhaustion of Bullish move.
Additionally, RSI is clearly showing a great Divergence for Bearish reversal despite the all three EMAs, 200, 50 and 20 (RGB) supporting Bullish move."

EUR/CAD - My projectionI think that this is what will happen to EUR/CAD. It could bounce up further finding resistance at the previous resistance but could also be forming a new support and resistance from the break low. Resistance could be current price. I think that this is the case for this weeks open.
Watch for the price to decide direction then make your play responsibly.

#EURCAD Daily Forecast we see still eurcad bullish trend . market mitigage weekly OB & then Daily OB point now again Break Low point and give us FVG so we will wait for Confirmation and then we will enter for a trade when market reach in our Daily FVG .

Potential Long Opp on EURCADSome confluences telling me this pair will rise.
- RSI divergence on H1
- Validated trend line on H4 broken
- RSI overbought on H1 and H4 which will cause price to retest blue highlighted area.
What do you think?

SELL EURCADLooking to sell EURCAD here after this clear bearish flag pattern. Waiting for the market to turn around to sell.

EURCAD Wave Analysis 6 December 2024
- EURCAD broke resistance zone
- Likely to rise to resistance level 1.5000
EURCAD currency pair recently broke the resistance zone located between the resistance level 1.4865 (which has been reversing the pair from the middle of November) and the 50% Fibonacci correction of the downward impulse wave C.
The breakout of this resistance zone accelerated the active intermediate impulse wave (C).
Given the clear daily uptrend and the strongly bearish CAD sentiment seen today, EURCAD currency pair can be expected to rise toward the next round resistance level 1.5000.

EURCAD Is Bearish! Sell!
Take a look at our analysis for EURCAD.
Time Frame: 4h
Current Trend: Bearish
Sentiment: Overbought (based on 7-period RSI)
Forecast: Bearish
The market is approaching a significant resistance area 1.485.
Due to the fact that we see a positive bearish reaction from the underlined area, I strongly believe that sellers will manage to push the price all the way down to 1.478 level.
P.S
We determine oversold/overbought condition with RSI indicator.
When it drops below 30 - the market is considered to be oversold.
When it bounces above 70 - the market is considered to be overbought.
Like and subscribe and comment my ideas if you enjoy them!


Could the price reverse from here?EUR/CAD is rising towards the resistance level which is an overlap resistance and could drop from this level to our take profit.
Entry: 1.48732
Why we like it:
There is an overlap resistance level.
Stop loss: 1.49841
Why we like it:
There is an overlap resistance level that lines up with the 127.2% Fibonacci extension.
Take profit: 1.47316
Why we like it:
There is a pullback support level.
Enjoying your TradingView experience? Review us!
Please be advised that the information presented on TradingView is provided to Vantage (‘Vantage Global Limited’, ‘we’) by a third-party provider (‘Everest Fortune Group’). Please be reminded that you are solely responsible for the trading decisions on your account. There is a very high degree of risk involved in trading. Any information and/or content is intended entirely for research, educational and informational purposes only and does not constitute investment or consultation advice or investment strategy. The information is not tailored to the investment needs of any specific person and therefore does not involve a consideration of any of the investment objectives, financial situation or needs of any viewer that may receive it. Kindly also note that past performance is not a reliable indicator of future results. Actual results may differ materially from those anticipated in forward-looking or past performance statements. We assume no liability as to the accuracy or completeness of any of the information and/or content provided herein and the Company cannot be held responsible for any omission, mistake nor for any loss or damage including without limitation to any loss of profit which may arise from reliance on any information supplied by Everest Fortune Group.

EUR-CAD Resistance Ahead! Sell!
Hello,Traders!
EUR-CAD keeps growing
But a horizontal resistance
Level ahead at 1.4890
From where we will be
Expecting a local pullback
And a move down
Sell!
Comment and subscribe to help us grow!
Check out other forecasts below too!

TRADE ON EUR/CAD, TREND ANALYSISHere EUR/CAD is in accumulation phase in 4H TF, trend line has been broken, box breakout is about to happen and green candle has been closed on EMA.
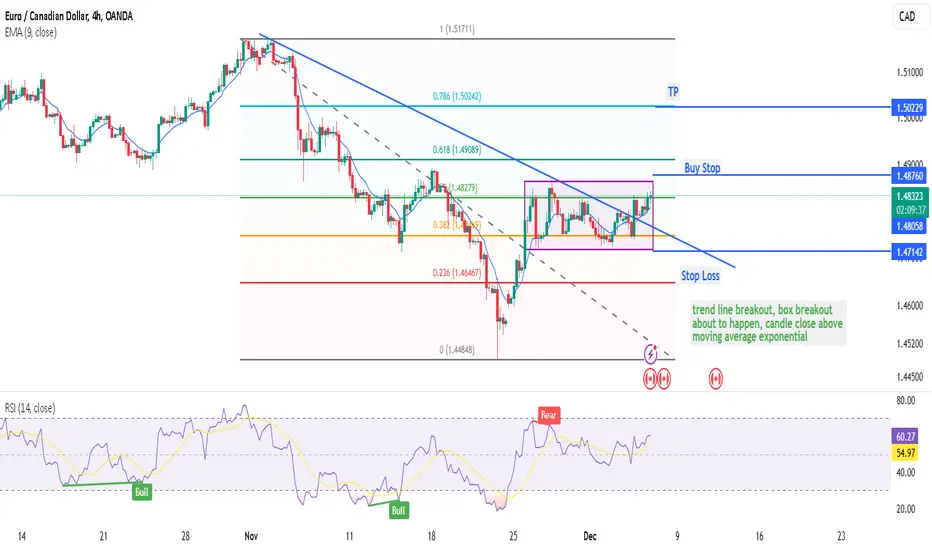
30pips tp have been hit Good trade, and price will make new high after pullback, watch out for it and ensure to time your entry correctly

