EUR-GBP Risky Short From Resistance! Sell!
Hello,Traders!
EUR-GBP keeps growing
Sharply after the Trump's
Tariff announcement wrecked
Havoc on the markets
But a strong resistance is
Ahead around 0.8446
From where we will be
Expecting a local
Bearish correction
Sell!
Comment and subscribe to help us grow!
Check out other forecasts below too!
Disclosure: I am part of Trade Nation's Influencer program and receive a monthly fee for using their TradingView charts in my analysis.
EURGBP trade ideas

Price action Eurgbp has reach target now it's time to explore the down side since there's alot of imbalance

EURGBP POTENTIAL SHORT Q2 W14 Y25 THURSDAY 3RD APRIL 2025EURGBP POTENTIAL SHORT Q2 W14 Y25 THURSDAY 3RD APRIL 2025
Thank you Mr Trump for sending the majority of pairs loopy! We are now faced with exponential and over extending price action. It really is a time to sit patiently. Allow the market to settle and take shape. In an ideal world, this outlook is exactly how we managed our capital as professional risk managers. We say it continuously, our role is to managed capital by way of risk expose. A super by product of managing that risk is making returns. It's a strange concept, yes. " what do you mean our main aim is not to make money" More on that note another time.
If it resonates, let it continue to do so.
A potential set up.
How do you like the plan?
FRGNT X

EURGBP INTRADAY oversold bounce back capped at 0.8385EURGBP INTRADAY oversold bounce back capped at 0.8385
The EUR/GBP pair continues to exhibit bearish sentiment, reinforced by the prevailing downtrend. The key intraday resistance level is at 0.8385, marking the current swing high.
Bearish Scenario:
An oversold rally from current levels, followed by a bearish rejection at 0.8385, would likely target downside support at 0.8340. A break below this level would open the door for further declines toward 0.8307 and 0.8260 in the longer timeframe.
Bullish Scenario:
Alternatively, a confirmed breakout above the 0.8385 resistance, accompanied by a daily close above this level, would invalidate the bearish outlook. This would pave the way for further rallies, with the next resistance levels at 0.8420 and 0.8460.
Conclusion:
The prevailing sentiment remains bearish as long as 0.8385 holds as resistance. Traders should watch for rejection at this level to confirm downside momentum. Conversely, a decisive breakout above 0.8420 would signal a potential shift to a bullish bias, targeting higher resistance levels.
This communication is for informational purposes only and should not be viewed as any form of recommendation as to a particular course of action or as investment advice. It is not intended as an offer or solicitation for the purchase or sale of any financial instrument or as an official confirmation of any transaction. Opinions, estimates and assumptions expressed herein are made as of the date of this communication and are subject to change without notice. This communication has been prepared based upon information, including market prices, data and other information, believed to be reliable; however, Trade Nation does not warrant its completeness or accuracy. All market prices and market data contained in or attached to this communication are indicative and subject to change without notice.

EURGBP - Sell ideaEntry: 0.84018
SL: 0.84203
TP: 0.83700
Selling EURGBP looks favorable due to recent price action showing a rejection at a key resistance level , indicating potential exhaustion of bullish momentum. Technical indicators like the RSI are approaching overbought territory, suggesting a pullback is likely. The pair has also broken below a short-term ascending trendline, signaling a shift to bearish momentum. Declining volume on recent upward moves supports the case for weakening buyer interest. Additionally, macroeconomic factors, such as stronger UK economic data compared to the Eurozone, could further pressure EURGBP downward.

Another Shot At Catching EURGBP Longs. So for some of you that already follow me, you'd have seen that I first made a attempt to catch the longs of EURGBP the first time and it didn't age well (Link Below)
Now because HTF bias is still bullish, I'm repositioning for a re-entry here. Let's hope this goes as analyzed

EURGBP 02/04/2025Weekly:
-S&D zone.
-Previous week high taken.
Daily:
-Bearish W pattern.
-Liquidity Sweep.
4H:
-Bearish W pattern.
-H&S pattern.
-IC.

EUR/GBP: Inverse Head & Shoulders Breakout Towards TargetChart Overview
Asset: Euro / British Pound (EUR/GBP)
Timeframe: 1-hour (1H)
Date and Time: Published on April 2, 2025, at 19:21 UTC
Publisher: GoldMasterTraders on TradingView
Current Price (at the time of the chart):
Open: 0.83668
High: 0.83670
Low: 0.83260
Close: 0.83635
Change: -0.00035 (-0.04%)
Price on the Right Axis: The price scale ranges from approximately 0.83100 to 0.84447, with the current price around 0.83642 (ask) and 0.83635 (bid).
Chart Elements and Technical Analysis
1. Candlestick Price Action
The chart displays a 1-hour candlestick representation of EUR/GBP, showing price movements from mid-March to early April 2025.
Trend Context:
Prior to the formation of the pattern, the price experienced a downtrend, declining from around 0.84200 (March 12) to a low of 0.83260 (March 25). This indicates a bearish trend leading into the pattern formation.
Following this decline, the price began to consolidate, forming the Inverse Head and Shoulders pattern, which suggests a potential reversal from bearish to bullish.
Recent Price Action:
On April 2, the price appears to have broken out above the neckline of the Inverse Head and Shoulders pattern, closing above the resistance level with a bullish candle. The current price of 0.83642 is above the breakout level, supporting the bullish thesis.
2. Chart Pattern: Inverse Head and Shoulders
Pattern Identification:
The chart highlights an Inverse Head and Shoulders pattern, a bullish reversal pattern that typically forms after a downtrend. It consists of three troughs:
Left Shoulder: A low around 0.83400 (March 20), followed by a bounce.
Head: A deeper low at 0.83260 (March 25), marking the lowest point of the pattern.
Right Shoulder: A higher low around 0.83400 (March 30), indicating diminishing selling pressure.
The neckline is drawn by connecting the highs between the shoulders (around 0.83600–0.83700), sloping slightly downward in this case.
Pattern Dynamics:
The Inverse Head and Shoulders pattern signals a shift from bearish to bullish sentiment. The left shoulder and head represent selling pressure, while the higher right shoulder indicates buyers stepping in at a higher level, showing increased demand.
The breakout occurs when the price closes above the neckline, confirming the reversal. In this chart, the breakout is confirmed around April 2, with the price closing above the neckline at approximately 0.83600–0.83700.
Breakout Confirmation:
The price broke above the neckline on April 2, with a strong bullish candle closing at 0.83635. The current price of 0.83642 is holding above the breakout level, which is a positive sign for bulls.
The breakout level aligns with the resistance zone, making the move significant as it also clears this key barrier.
3. Key Support and Resistance Levels
Support Level:
A horizontal support zone is marked around 0.83425 (approximately 0.8340–0.8345).
This level corresponds to the lows of the left and right shoulders, where buyers stepped in to defend the price. It also aligns with the lower boundary of the pattern, reinforcing its importance.
Resistance Level:
A resistance zone is marked around 0.83700 (approximately 0.8365–0.8375).
This level corresponds to the neckline of the Inverse Head and Shoulders pattern and a previous high from March 19. It acted as a barrier during the pattern formation but has now been broken, turning it into potential support on a retest.
Target Level:
The target for the breakout is projected at 0.84447.
This target is calculated using the standard method for Head and Shoulders patterns: measuring the height of the pattern (from the head at 0.83260 to the neckline at 0.83700, which is 0.00440) and projecting that distance upward from the breakout point (0.83700 + 0.00440 = 0.84140). The target of 0.84447 is slightly higher, possibly adjusted for the next significant resistance.
The chart indicates a potential move of 0.00627 (0.75%), which aligns with the distance from the breakout level (0.83700) to the target (0.84447).
4. Stop Loss and Risk Management
Stop Loss:
The stop loss is suggested below the support level at 0.83425.
Placing the stop loss below this level ensures that if the breakout fails and the price falls back below the neckline and the right shoulder, the trade is exited with a controlled loss.
The distance from the breakout level (0.83700) to the stop loss (0.83425) is 0.00275, representing the risk on the trade.
Risk-Reward Ratio:
The chart indicates a potential move of 0.00627 (0.75%) to the target.
The risk is 0.00275 (from 0.83700 to 0.83425), and the reward is 0.00627 (from 0.83700 to 0.84447), giving a risk-reward ratio of approximately 2.28:1 (0.00627 / 0.00275). This is a favorable ratio for a trading setup.
5. Additional Annotations
Pattern Components:
The chart labels the Left Shoulder, Head, and Right Shoulder, clearly identifying the structure of the Inverse Head and Shoulders pattern.
A blue arrow labeled “Inverse Head & Shoulder pattern” points to the formation, making it easy to recognize.
Arrows and Labels:
A green arrow labeled “Support Level” points to the 0.83425 zone, indicating where buyers have defended the price.
A red arrow labeled “Resistance Level” points to the 0.83700 zone, highlighting the neckline and the breakout area.
A blue arrow labeled “Target” points to 0.84447, showing the projected price objective.
A blue arrow labeled “Stop Loss” points to 0.83425, indicating the risk management level.
Price Labels on the Right Axis:
The right axis shows key price levels, with the current ask price at 0.83642 (red) and bid price at 0.83635 (black), reflecting the live market spread.
Trading Setup Breakdown
Based on the chart, here’s the detailed trading setup:
Entry:
Position: Long (buy) EUR/GBP.
Entry Point: The setup suggests entering after the price breaks out above the neckline of the Inverse Head and Shoulders pattern, which occurred around April 2, 2025, at approximately 0.83700.
Confirmation: The breakout is confirmed by a strong bullish candle closing above the neckline, with the current price at 0.83642, slightly below the high of 0.83670 but still above the breakout level. Traders might wait for a retest of the neckline (now acting as support) for a safer entry, though this isn’t explicitly suggested in the chart.
Stop Loss:
Level: Place the stop loss below the support level at 0.83425.
Rationale: This placement protects against a false breakout. If the price falls back below the neckline and breaches the right shoulder, the bullish thesis is invalidated, and the trade should be exited.
Risk: The distance from the entry (0.83700) to the stop loss (0.83425) is 0.00275, or approximately 0.33% of the entry price.
Take Profit/Target:
Level: The target is set at 0.84447.
Rationale: This target is derived from the height of the pattern projected upward from the breakout point. It also aligns with a logical extension toward the next significant resistance.
Reward: The distance from the entry (0.83700) to the target (0.84447) is 0.00627, or approximately 0.75% of the entry price.
Risk-Reward Ratio:
The risk-reward ratio is approximately 2.28:1, which is attractive for a trading setup. For every unit of risk (0.00275), the potential reward is over 2 units (0.00627).
Trade Management:
Trailing Stop: Once the price approaches the target at 0.84447, traders might consider trailing the stop loss to lock in profits, especially if the price shows signs of stalling.
Partial Profit Taking: Some traders might take partial profits at a minor resistance level (e.g., 0.84000) and let the remaining position run toward the target.
Broader Market Context
Trend Analysis:
The broader trend before the pattern was bearish, as evidenced by the decline from 0.84200 to 0.83260. The Inverse Head and Shoulders pattern suggests a potential reversal to the upside, with the breakout confirming this shift.
The price action after the breakout will be critical. A strong move toward 0.84000 with high volume would confirm the bullish momentum.
Volume and Momentum:
The chart doesn’t display volume or momentum indicators (e.g., RSI, MACD). However, a typical confirmation of an Inverse Head and Shoulders breakout includes:
Volume: An increase in volume on the breakout candle, indicating strong buying interest.
Momentum: A bullish signal from indicators like RSI (e.g., moving above 50) or MACD (e.g., a bullish crossover).
Traders should check these indicators to validate the breakout’s strength.
Market Factors:
EUR/GBP is influenced by factors like Eurozone and UK economic data, interest rate differentials, and Brexit-related developments. On April 2, 2025, traders should consider:
Economic Data: Key releases like UK GDP, Eurozone inflation, or central bank statements around this time could impact the pair.
Geopolitical Events: Any developments related to UK-EU relations or global risk sentiment could drive volatility in EUR/GBP.
Potential Risks and Considerations
False Breakout:
If the price fails to hold above the neckline (0.83700) and falls back below the right shoulder, the setup is invalidated. The stop loss at 0.83425 mitigates this risk.
Resistance at 0.84000:
The price may encounter resistance around 0.84000, a psychological level and a previous high. Traders should watch for bearish price action (e.g., a shooting star or bearish engulfing candle) near this level.
Market Volatility:
EUR/GBP can be volatile on a 1-hour timeframe, especially around economic data releases. Unexpected news could lead to sharp price swings, potentially triggering the stop loss prematurely.
Timeframe Limitations:
This is a short-term setup on a 1-hour chart, so the target might be reached within hours to a couple of days. However, intraday noise could lead to choppy price action, requiring active trade management.
Conclusion
The TradingView chart by GoldMasterTraders presents a well-structured bullish trading setup for EUR/GBP based on an Inverse Head and Shoulders pattern. The price has broken out above the neckline on April 2, 2025, signaling a potential move toward the target of 0.84447. Key levels include support at 0.83425 (where the stop loss is placed) and the neckline resistance at 0.83700, which the price must hold above to maintain the bullish thesis. The setup offers a favorable risk-reward ratio of 2.28:1, making it an attractive trade for short-term traders.
However, traders should confirm the breakout with additional indicators (e.g., volume, RSI) and monitor broader market conditions, as this chart is a snapshot from April 2, 2025, and market dynamics may have evolved since then. If you’d like to search for more recent data on EUR/GBP or check the outcome of this setup, I can assist with that!

EURGBP Bull Flag
Correction is happening inside a clearly defined channel.
Price found support at 61.8% pullback, with bullish divergence, which I´m currently labeling as 2/B.
Although the top of the channel served as resistance, the higher probability is that the channel (bull flag) will be broken, and price will target new recent highs.

Waiting for a pull back Waiting for a little pull back on the 4H then I will be looking for an entry.. D and W say SHORT

EURGBP BUY BIAS
We have a buy bias on this pair with multiple confluences
1) LIQ TAKEN
2) PIVOT AS SUPPORT
3) 200 EMA AS SUPPORT
4) RESISTANCE TURN SUPPORT
5) CANDLESTICKS SIGNALS
We are targeting 0.84600 as our final target

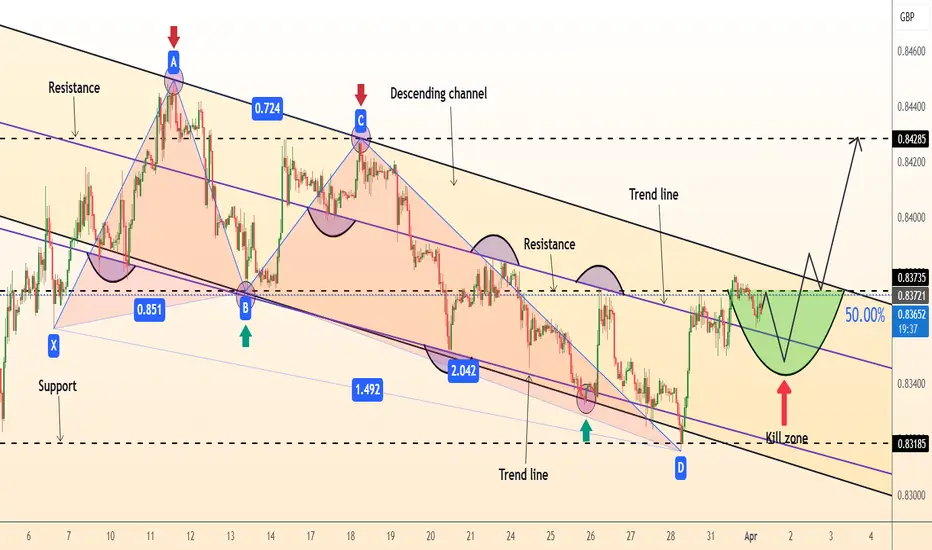
DeGRAM | EURGBP broke through the trend lineEURGBP is in a descending channel above the trend lines.
The price is moving from the support level and the lower boundary of the channel.
The chart formed a harmonic pattern, broke the upper trend line and reached the 50% retracement level.
The indicators indicate that a bullish divergence is now being worked out on the 4H Timeframe.
We expect the growth to continue after consolidation above the correction level.
-------------------
Share your opinion in the comments and support the idea with like. Thanks for your support!
Short budddyyy!!!Overall trend is short on the 1hr time frame
I’m we have a divergence
And this Bos is a trap for the longs In my opinion.
Short to the 83.000 area by the end of this week.
What are your thoughts?
Trade safely my friends

I'm selling EURGBPIf you dont trade this pair directly, you can use it to know which pair is stronger between EUR and GBP. But you should trade it tho, why limit yourself to any pair in particular?
Now, it is better to buy GU than EU as GU will move more massively ie if the analysis hold.
I will like for you to trade it tho, the risk is small when compared to the massive result.
Follow me as my trades are market orders and not limit orders so you will be able to see the trades on time and enter on time.
Ya gazie

"EUR/GBP Bearish Breakdown: Identifying Pump and Dump Patterns In the EUR/GBP currency pair, recent price action has exhibited characteristics reminiscent of a "pump and dump" scenario, marked by consistent breaks in market structure and a prevailing bearish trend.

EURGBP oversold bounce back capped at 0.8384The EUR/GBP pair continues to exhibit bearish sentiment, reinforced by the prevailing downtrend. The key intraday resistance level is at 0.8385, marking the current swing high.
Bearish Scenario:
An oversold rally from current levels, followed by a bearish rejection at 0.8385, would likely target downside support at 0.8340. A break below this level would open the door for further declines toward 0.8307 and 0.8260 in the longer timeframe.
Bullish Scenario:
Alternatively, a confirmed breakout above the 0.8385 resistance, accompanied by a daily close above this level, would invalidate the bearish outlook. This would pave the way for further rallies, with the next resistance levels at 0.8420 and 0.8460.
Conclusion:
The prevailing sentiment remains bearish as long as 0.8385 holds as resistance. Traders should watch for rejection at this level to confirm downside momentum. Conversely, a decisive breakout above 0.8420 would signal a potential shift to a bullish bias, targeting higher resistance levels.
This communication is for informational purposes only and should not be viewed as any form of recommendation as to a particular course of action or as investment advice. It is not intended as an offer or solicitation for the purchase or sale of any financial instrument or as an official confirmation of any transaction. Opinions, estimates and assumptions expressed herein are made as of the date of this communication and are subject to change without notice. This communication has been prepared based upon information, including market prices, data and other information, believed to be reliable; however, Trade Nation does not warrant its completeness or accuracy. All market prices and market data contained in or attached to this communication are indicative and subject to change without notice.

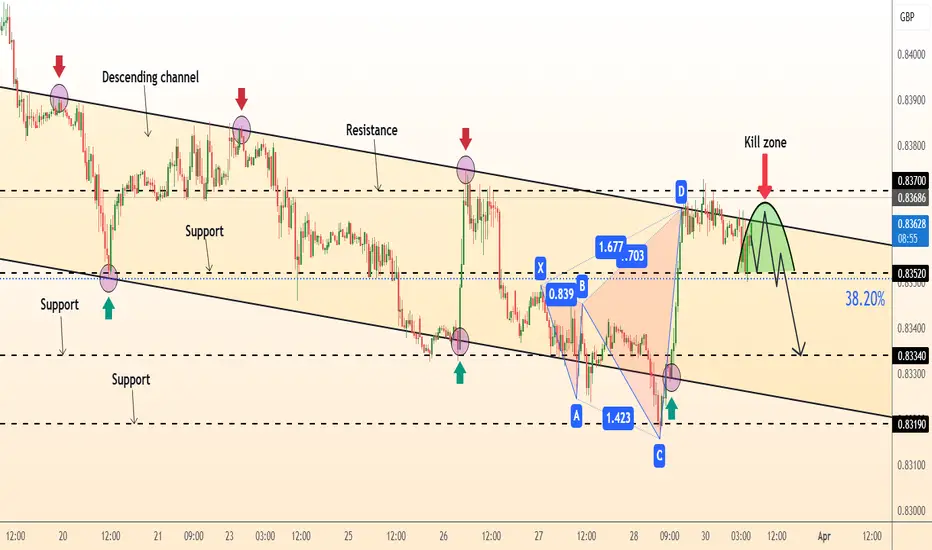
DeGRAM | EURGBP decline in the channelEURGBP is in a descending channel.
The price is moving from the resistance level and the upper boundary of the channel.
The chart maintains a downward structure and has already formed a harmonic pattern.
We expect that the pair will continue to decline after consolidating under the support level, which coincides with the 38.2% retracement level.
-------------------
Share your opinion in the comments and support the idea with like. Thanks for your support!
EURGBP ShortEURGBP had a good week
good news eurozone
falling oil prices
Rising oil prices boosting again GBP
Also tariffs on Eurozone bringing Euro again under pressure
hedgefunds long,time for me to Sell EURGBP again
i DONT USE PRICE ACTION!!!!!!Because I dont believe in price action
Profit target zone is area where the euro bulls defend their position

Possibility of uptrend As long as the price fluctuates above the green support zone, the uptrend is likely to continue. A break above the resistance levels and the resistance trend line will be a confirmation of the uptrend.

EUR/GBP - Market Update/Trade IdeaThis trade for us is still currently live and running in profit, at this key level im currently interested in looking at another entry.
Price is currently at a Key level and respecting a resistance level giving me confluence sellers are still set in place
Looking to sell after my Entry Model gives me confluence
Looking to sweep Liquidity for a TP
Follow me for more updates on this trade

EUR/GBP (2H) Market AnalysisTrend & Market Structure
The pair was in a downtrend, forming lower highs and lower lows within a descending channel.
A breakout has occurred, signaling a possible trend reversal or correction.
Key Levels & Zones
Support Zone: 0.8333 - 0.8340, where price found strong buying pressure.
Resistance Zone: 0.8372 - 0.8375, where price is currently testing.
Higher Resistance: 0.8423, the next key level if price breaks above 0.8375.
Possible Scenarios
Bullish Break & Retest (Most Likely)
If price holds above 0.8372, a retest of the breakout zone could confirm further upside.
Targets: 0.8414 - 0.8423.
Fakeout & Rejection
If price gets rejected at 0.8372 - 0.8375, it might drop back to 0.8333 before another attempt to push higher.
Conclusion
Bias: Bullish if price holds above 0.8372, bearish below 0.8360.
Watch for confirmation on the retest before entering long positions.

EUR-GBP Short From Resistance! Sell!
Hello,Traders!
EUR-GBP keeps growing
But the horizontal resistance
Is ahead around 0.8385
So after the retest will be
Expecting a local bearish
Correction to the downside
Sell!
Comment and subscribe to help us grow!
Check out other forecasts below too!
Disclosure: I am part of Trade Nation's Influencer program and receive a monthly fee for using their TradingView charts in my analysis.

EUR/GBP Bullish Breakout from Falling Wedge – Buy Setup!Introduction
This EUR/GBP 4-hour chart analysis presents a high-probability bullish trading setup based on a falling wedge breakout. A falling wedge is a reliable bullish reversal pattern, signaling that selling pressure is fading, and buyers are regaining control. The price has now broken out of the wedge, confirming potential upside momentum.
This setup provides a well-defined entry, stop-loss, and target level, allowing traders to capitalize on the bullish breakout while maintaining a proper risk management strategy.
1. Chart Pattern: Falling Wedge (Bullish Reversal)
The primary pattern on the chart is a falling wedge, which is a bullish reversal pattern that forms after a downtrend. It is characterized by converging downward-sloping trendlines, indicating that sellers are gradually losing momentum.
🔹 Key Characteristics of the Falling Wedge Pattern:
Lower highs & lower lows within a narrowing price range.
Decreasing selling pressure, indicating a potential shift in trend.
A bullish breakout above the upper trendline confirms a reversal.
Typically followed by a strong price surge, aiming for previous resistance levels.
The price action confirms this pattern as it broke above the wedge's upper boundary, signaling the start of a bullish trend.
2. Key Technical Levels & Market Structure
🔹 Resistance Level (Target) – 0.84183
This level marks a previous strong resistance zone, where the price faced rejection multiple times.
It serves as the primary profit-taking area for this setup.
A successful breakout and close above this level could lead to further upside movement.
🔹 Support Level – 0.83154
This is the major demand zone where price previously bounced.
Strong buying pressure emerged at this level, leading to the recent breakout.
It serves as an important level to define risk and set stop-loss orders.
🔹 Stop-Loss Placement – Below 0.83154
A stop-loss is placed slightly below the support zone, ensuring a logical exit if the market reverses.
This prevents unnecessary losses while allowing room for normal price fluctuations.
🔹 Entry Point Consideration
Ideal entry: Around 0.83700, just after the breakout confirmation.
Confirmation: A strong bullish candle closing above the wedge.
3. Trade Execution Plan: Long Setup
📌 Trade Idea – Bullish Setup
📈 Buy Entry: 0.83600 – 0.83700 (After wedge breakout)
🎯 Target: 0.84183 (Major resistance level)
❌ Stop-Loss: 0.83154 (Below support level)
🔄 Risk-to-Reward Ratio (RRR): ~1:1
📊 Risk Management Strategy
Trade with discipline: Never risk more than 1-2% of your capital per trade.
Adjust position size: Based on risk tolerance and account balance.
Use trailing stops: To secure profits if price continues upward.
4. Market Sentiment & Price Action Analysis
Prior Uptrend: The price previously had a strong bullish rally, indicating overall bullish strength.
Corrective Move: The market entered a falling wedge correction, allowing for a healthy pullback before resuming the trend.
Breakout Confirmation: The breakout above the wedge's upper trendline confirms bullish momentum.
📊 Factors Supporting a Bullish Move:
✅ Breakout confirmation above the wedge pattern.
✅ Higher buying volume supporting the move.
✅ Support level holds strong, preventing further downside.
5. Trading Psychology & Risk Considerations
⚠️ Key Considerations Before Entering the Trade:
✔ Wait for confirmation – Ensure a strong breakout candle before entering.
✔ Avoid chasing the price – Enter at a reasonable pullback level post-breakout.
✔ Monitor economic events – Watch for news that could impact EUR/GBP volatility.
✔ Follow a strict risk-reward ratio – Stick to your predefined stop-loss and target.
6. Conclusion – Bullish Outlook
This falling wedge breakout on EUR/GBP suggests a bullish reversal, offering a high-probability long trade setup. The price is expected to move towards the 0.84183 resistance level, with 0.83154 as the key stop-loss level.
✅ Bias: Bullish
🎯 Target: 0.84183
❌ Stop Loss: 0.83154
📊 Risk-to-Reward: ~1:1
📌 TradingView Idea Title & Description
Title:
🚀 EUR/GBP Falling Wedge Breakout – Bullish Move Incoming!
Description:
📈 Bullish breakout confirmed! EUR/GBP has broken out of a falling wedge, signaling a trend reversal. A long position above 0.83600 targets the 0.84183 resistance level with a stop-loss at 0.83154. Watch for strong bullish momentum! 📊💹
💡 Risk Management: Stick to your stop-loss, and don’t chase price action. Manage your trade wisely! 🔥
