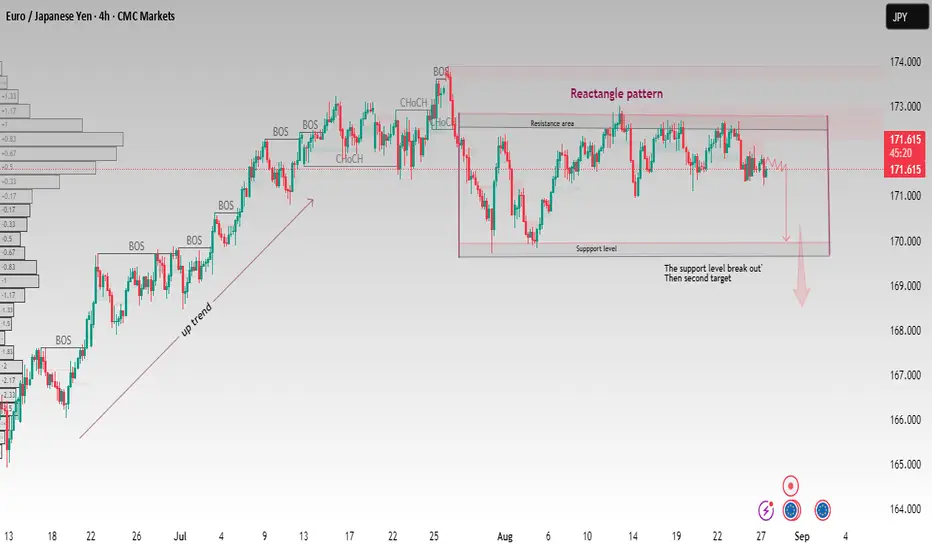
EUR/JPY – Rectangle Pattern Breakdown SetupEUR/JPY has been consolidating within a clear rectangle pattern after a strong uptrend. The market is currently testing the support zone around 171.00.
Previous structure shows multiple BOS (Break of Structure) and ChoCH (Change of Character).
Price is ranging between resistance (173.00) and support (171.00).
A confirmed support break could open the way toward the next bearish target near 169.00.
If buyers defend the support, a short-term bounce back into the range is also possible.
This analysis is for educational purposes only, not financial advice. Always manage your risk before trading
EURJPY trade ideas
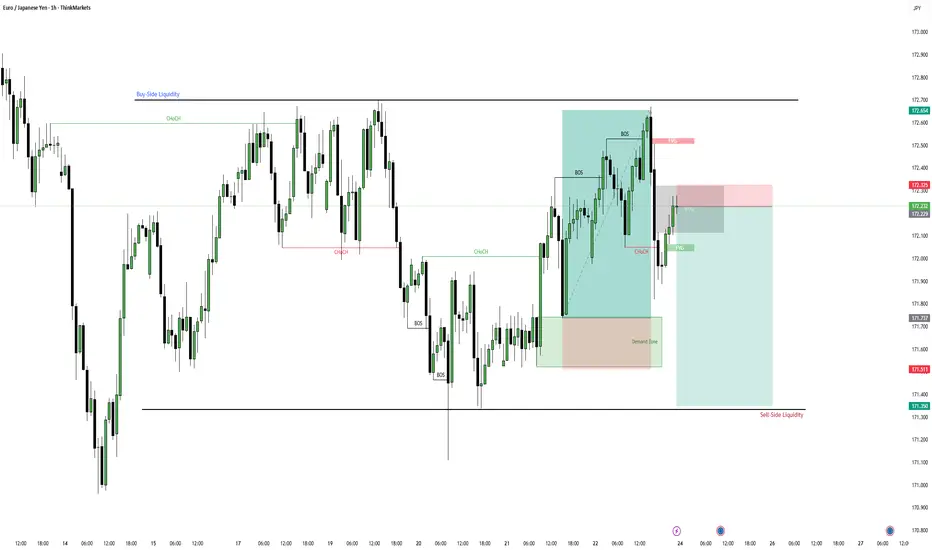
Potential Short After Structure Break and FVG FormationThe analysis of EUR/JPY shows the development of a bearish structure, which could offer a good opportunity for a short position. After the price broke the previous local high (BOS), it failed to maintain its bullish momentum and reversed its direction, forming a change of character (ChOCH). This is a key signal for a potential downtrend.
The price is currently in a Fair Value Gap (FVG) zone, which represents an inefficient market movement and often acts as an attraction zone for the price. From there, we could see a reaction that pushes the price downwards.
For this trading strategy to be valid, the price must react to the FVG zone and head towards the lower targets. The main target is the Sell Side Liquidity zone, located around 171.200. This is an area with accumulated stop-losses, which makes it a strong magnetic point for the price.
This trading idea is valid as long as the price does not break the top of the FVG zone and head upwards.
EURJPY ROAD MAP!Hello all. It is a very tricky market and you know that market makers use all tricks to take most profit. It is one of the tricky moves. be happy(wink)

BearishEurJpy is bearish on daily time frame same as 4hrs tf..then I'd bearish engulfing candle on 1hr tf on Resistance 172.000

Lingrid | EURJPY Potential Breakout and Price SurgeThe price perfectly fulfilled my previous idea . FX:EURJPY is consolidating just beneath resistance after rebounding strongly from the support zone. Price is moving inside an upward channel, while repeatedly testing the downward trendline from above, hinting at a potential breakout. A confirmed move above resistance could trigger bullish continuation toward 173.50. Broader momentum remains constructive as higher lows align with the channel’s bullish structure.
📉 Key Levels:
Buy trigger: Break and close above 172.90–173.00 zone.
Buy zone: 172.10–172.40 retest area near the upward channel support.
Target: 173.50 resistance area.
Invalidation: Break below 171.80 support would negate the bullish outlook.
💡 Risks:
Failure to break the downward trendline could trigger another rejection lower.
Yen strength from macro data or risk-off flows could cap upside momentum.
Overextension near resistance could lead to a false breakout trap.
If this idea resonates with you or you have your own opinion, traders, hit the comments. I’m excited to read your thoughts!

EURJPY 1D | Market OutlookPotential for a bearish pullback on the EURJPY 1D which could lead to a price movement towards the support level at 168.000 SELL levels from 171.800

Battle Of Wicks Confirms Pennant On EJ, Which Leg Will Break?!Here on OANDA:EURJPY we can see Price has been volleyed back and forth between a Falling Resistance and Rising Support at similar degrees forming a Pennant Pattern!
Currently we can see the Consolidation is getting tight and likely to breakout soon, the question is which leg will break?!
Fundamentally EUR and JPY have news events littered throughout this week that will give us some good insight into both currencies corresponding economies, like Tokyo Core CPI y/y on Thursday, Aug. 28th with a Bearish forecast of 2.6%, down from 2.9%!
For now, we must wait for Price to give us a Breakout and Retest!

reversallooks like we failed to make a new high and we are heading to the 1st 4hr support. if we break past the 4 hr support we will be heading down for a break of structure, which will possibly create a new down trend in the higher time frame

EUR/JPY downtrend recoveryIts under the EMA and is also close to the support, i think that this could recover from the downtrend, if not, it would drop more until it reaches the support, overall, it is a trending market on the daily timeframe. It's neutral on the rsi aswell

Bearish drop?EUR/JPY has rejected off the pivot which acts as a pullback resistance and could drop to the 1st support.
Pivot: 171.99
1st Support: 170.24
1st Reistance: 172.87
Risk Warning:
Trading Forex and CFDs carries a high level of risk to your capital and you should only trade with money you can afford to lose. Trading Forex and CFDs may not be suitable for all investors, so please ensure that you fully understand the risks involved and seek independent advice if necessary.
Disclaimer:
The above opinions given constitute general market commentary, and do not constitute the opinion or advice of IC Markets or any form of personal or investment advice.
Any opinions, news, research, analyses, prices, other information, or links to third-party sites contained on this website are provided on an "as-is" basis, are intended only to be informative, is not an advice nor a recommendation, nor research, or a record of our trading prices, or an offer of, or solicitation for a transaction in any financial instrument and thus should not be treated as such. The information provided does not involve any specific investment objectives, financial situation and needs of any specific person who may receive it. Please be aware, that past performance is not a reliable indicator of future performance and/or results. Past Performance or Forward-looking scenarios based upon the reasonable beliefs of the third-party provider are not a guarantee of future performance. Actual results may differ materially from those anticipated in forward-looking or past performance statements. IC Markets makes no representation or warranty and assumes no liability as to the accuracy or completeness of the information provided, nor any loss arising from any investment based on a recommendation, forecast or any information supplied by any third-party.

EURJPY Testing Supply Zone Can Bears Regain Control?EURJPY has climbed back into a key resistance area near 172.40–172.50, a zone that previously triggered sharp selling pressure. Price action suggests exhaustion at these highs, with a possible rotation back toward support if sellers defend this zone again. Given the yen’s safe-haven role and the euro’s sensitivity to ECB policy shifts, this setup is primed for a potential reversal play.
Current Bias
Bearish – The pair is showing rejection signs at resistance, favoring downside toward lower support levels.
Key Fundamental Drivers
ECB Outlook: The ECB is cautious, with slowing eurozone growth limiting room for further tightening, reducing euro strength.
BOJ Policy & Yen Flows: Yen remains supported by safe-haven demand and speculation around BOJ gradually tightening, even if modestly.
Risk Sentiment: Global equity volatility and tariff/geopolitical risks support yen buying when risk-off flows emerge.
Macro Context
Interest Rates: ECB is holding policy steady but leans dovish relative to other central banks. Japan remains ultra-loose, but any hint of normalization sparks yen strength.
Economic Growth: Eurozone growth is fragile, with Germany’s industrial sector under pressure. Japan’s economy is steady, though export-driven, making it vulnerable to global demand.
Geopolitics: Trade tariffs, US-China tensions, and Middle East risks all lean supportive for the yen as a safe haven.
Primary Risk to the Trend
A hawkish ECB surprise or strong eurozone inflation rebound could shift bias back to the upside, invalidating the bearish setup.
Most Critical Upcoming News/Event
ECB Minutes & Eurozone CPI Flash Estimate
BOJ Commentary on Yield Curve Control (YCC)
Leader/Lagger Dynamics
EURJPY tends to act as a lagger, following flows in broader yen crosses like USDJPY (as a leader) and EURUSD (for euro sentiment). Movements in EURJPY often confirm rather than lead directional bias in FX markets.
Key Levels
Support Levels: 171.42, 170.99, 170.65, 170.08, 169.73
Resistance Levels: 172.47, 173.31
Stop Loss (SL): 173.31 (above resistance zone)
Take Profit (TP):
TP1: 171.42
TP2: 170.65
TP3: 170.08
Summary: Bias and Watchpoints
Bias on EURJPY is bearish, with sellers looking to defend the 172.40–172.50 resistance area. A stop loss is best placed above 173.31, while downside targets stretch toward 171.42 → 170.65 → 170.08. Fundamentally, the euro faces growth headwinds while the yen benefits from safe-haven demand, though BOJ policy risks remain in play. The most important watchpoint is ECB and Eurozone CPI data, which could either reinforce the bearish case or shift sentiment sharply. For now, EURJPY looks vulnerable to a deeper correction, with price action aligned to favor sellers.

EUR/JPY - Short Term Bearish before Bullish Impulse💶 EUR/JPY – 8H Breakdown
📊 Bias
Short-term bearish → setting up for a liquidity sweep before bullish continuation.
🔎 Technical Breakdown
Liquidity Zones:
Buy Side Liquidity: 172.50 – 173.00
Sell Side Liquidity: 171.00 – 171.20
Market is currently hunting sell side liquidity before a possible bullish reversal.
Wave Structure:
Price unfolding inside a corrective structure (a–b–c–d–e).
Currently testing the lower range (c → e completion zone).
71% retracement confluence around 171.00 support zone.
Key Levels:
Target Resistance: 173.90
Current Price: 171.35
Buy POI / Demand Zone: 170.80 – 171.00
Invalidation: Break below 169.82
🎯 Trade Plan
Entry Zone (Buy): 170.80 – 171.00
Stop Loss: Below 169.80 (invalidate bullish scenario)
First Target: 172.00 (mid-range)
Main Target: 173.90 (major liquidity target)
⚠️ Notes
Watch for a liquidity sweep below 171.00 before the real move up.
If demand holds, expect a sharp reversal into 173.90.
If invalidation breaks, bearish continuation opens towards 169.00.


Strong sell eurjpySelling pressure remains continue
Following the down parallel channel
Day trend already breaks
Monthly selling zone

EUR-JPY Rebound Ahead! Buy!
Hello,Traders!
EUR-JPY will soon make
A retest of the horizontal
Support of 171.117 and
After that a local bullish
Rebound is to be expected
Buy!
Comment and subscribe to help us grow!
Check out other forecasts below too!
Disclosure: I am part of Trade Nation's Influencer program and receive a monthly fee for using their TradingView charts in my analysis.

EURJPY BEARISH PRICE ACTION🔻 Technical View
Trend: Lower highs and lower lows → bearish structure intact.
Candles: Strong bearish candles dominating, weak pullbacks.

Sell EURJPYEarlier we took longs on EURJPY because we were aiming at a selling area. Price has quickly jumped up to the point of interest. We can short from here into last week's lows to close off this week. A bearish flag indicates the possibility of this scenario.

EUR/JPY SHORTRules based short targeting previous levels. Or exit signals triggered based on volatility or structure. Let’s see how this one plays out.

EURJPY Trading Opportunity! SELL!
My dear subscribers,
EURJPY looks like it will make a good move, and here are the details:
The market is trading on 172.60 pivot level.
Bias - Bearish
Technical Indicators: Both Super Trend & Pivot HL indicate a highly probable Bearish continuation.
Target - 172.07
About Used Indicators:
The average true range (ATR) plays an important role in 'Supertrend' as the indicator uses ATR to calculate its value. The ATR indicator signals the degree of price volatility.
Disclosure: I am part of Trade Nation's Influencer program and receive a monthly fee for using their TradingView charts in my analysis.
———————————
WISH YOU ALL LUCK

EURJPY SELL TRADE
1. Structure Reading
• The Supply Zone (Order Block) is marked at 173.07 – 173.25 (red boxes).
• Price dropped strongly from this zone → confirming institutional selling pressure.
• A possible Demand Zone / Liquidity Area sits around 171.00 – 170.80.
⸻
2. BOS & CHoCH
• Chart shows clear BOS (Break of Structure) and CHoCH (Change of Character) → trend shifted from bullish to bearish.
• Current price is around 172.20 → mid-zone, not ideal for entries.
⸻
3. RSI Confirmation
• RSI is near 50–53 → neutral, no strong overbought/oversold signal.
⸻
🔑 Trade Plan (SMC-based):
Sell Setup (High-Probability)
• If price revisits 173.00 – 173.25 Supply Zone, look for short entries.
• Target: 171.20 – 171.00
• Stop Loss: Above 173.40
Buy Setup (Countertrend / Riskier)
• If price drops into 171.00 – 170.80 Demand Zone and shows bullish reaction (wick rejection or BOS upwards), you may consider a buy.
• Target: 172.50 – 172.90
• Stop Loss: Below 170.60
⸻
✅ Right now, the best plan is to wait for a Sell setup near 173, since structure is bearish and supply is strong above.


EURJPY QUICK TRADE Will be trading this pair and wait for it to give profits with minimum drawdown , always remember to close partials

EURJPY Sell analysis Hello!
This is my personal analysis of EURJPY
This is for educational purposes only, invest at your own risk.
