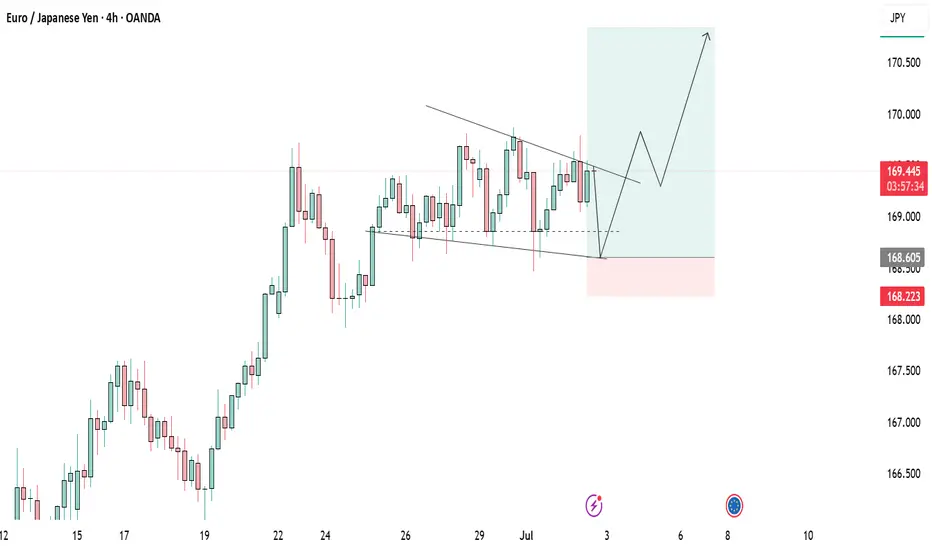
EUR-JPY Bullish Breakout! Buy!
Hello,Traders!
EUR-JPY is trading in an
Uptrend and the pair made
A strong bullish breakout
Of the key horizontal level
Of 168.000 and the breakout
Is confirmed so we will be
Expecting a further bullish
Move up on Monday
Buy!
Comment and subscribe to help us grow!
Check out other forecasts below too!
Disclosure: I am part of Trade Nation's Influencer program and receive a monthly fee for using their TradingView charts in my analysis.
EURJPY trade ideas

EURJPY BUY PROJECTION THIS WEEK!Price confirms a bullish trend from the daily timeframe. A buy opportunity is what we’re looking out for from the H4 timeframe.
We’d be monitoring price to see when market retraces to a previous resistance which now turn support so as to gain entry for a buy!

EURJPY: Trading Above Major QP 170. Strong Bullish Trend EJ broke above the key psychological level of 170.00, and has not found major resistance yet. Expecting a bullish trend continuation as long as price stays above 169.
* M30 Bullish Choch
* Creating new HHs and HLs
* M30/H1 Bearish Break Block
* M30/H1 Bullish FVG (50% filled)
🟢Entry: 168.40 – 168.60
Stop Loss: 168.00
TP1: 169.80
TP2: 170.50
TP3: 171.20
Breakout Option: If price pushes above 170.50 early in the week, consider breakout entry on retest.
Invalidation: Bias shifts to neutral if H4 closes below 169.00.

EUR-JPY Will Keep Growing! Buy!
Hello,Traders!
EUR-JPY is trading in an
Uptrend and the pair broke
The key horizontal level
Of 169.814 and the breakout
Is confirmed so after a potential
Retest of the support cluster
Of the rising and horizontal
Support lines below we will
Be expecting a bullish continuation
Buy!
Comment and subscribe to help us grow!
Check out other forecasts below too!
Disclosure: I am part of Trade Nation's Influencer program and receive a monthly fee for using their TradingView charts in my analysis.

EURJPY Wave Analysis – 3 July 2025- EURJPY broke resistance level of 169.55
- Likely to rise to resistance level 72.00
EURJPY currency pair recently broke above the key resistance level 169.55 (which reversed the price multiple times at the end of June, as can be seen from the daily EURJPY chart below).
The breakout of the resistance level 169.55 accelerated the active short-term impulse wave 3 of the intermediate impulse wave (C) from February.
Given the clear daily uptrend, EURJPY currency pair can be expected to rise further to the next resistance level 172.00, target price for the completion of the active impulse wave (C) lying at the intersection of the 2 up channels from June and March.


EURJPYLAST month i called eurjpy long ,and we still holding that buy based on the following context.
EU10Y= 2.602%
EUR INTEREST RATE after governing council decision 25basis point on deposit facility 2% main refinancing operation 2.15% and marginal lending facility 2.40%
JP10Y=1.438%
JPY INTEREST RATE =0.5%
BOND YIELD DIFFERENTAL= EUR-JPY= 1.164 % FAVOUR EUR CARRY TRADE.
INTEREST RATE DIFFERENTIAL= EUR-JPY=1.5 % FAVOUR EUR CARRY TRADE
CARRY TRADERS BORROWED FROM BOJ AND INVESTED IN ECB BOND MARKET.
STRUCTURE OF MARKET=the daily break of supply roof turn to demand floor and EURJPY WENT MOON

SELL EURJPYASIA session will sink EURJPY price low towards 168,888. Price is currently consolidating between two ranges, let us exploit this move

EURJPY - bullish Story: Market is in bullish trend with series of HH and HLs. There is no divergence on the chart therefore we expect market to continue bullish trend. as the market is continuing bullish, we look for any continuation pattern. Yes, we have found one, which is bullish flag pattern.
there is no reversal or harmonic pattern.
Anticipate : it is anticipated that market will breakout the Flag neck line and we anticipate the market to reach its projection of flag-pole.
Plan is to enter in the market on break out of neckline and continue riding till the projection of flag-pole with our SL placed just below the Marked HLs and we set our TP1 and TP2 with R:R of 1:1 and 1:2 respectively.

EURJPY Gearing Up for LongsThe triangle is tightening at the resistance and we will soon see price break upwards and rally towards 170,841. Sell for now

EURJPY can we see one more bullish?
OANDA:EURJPY long time we having bullish push, currently price on sup zone, from which expecting one more bullish.
SUP zone: 168.800
RES zone: 170.800, 171.200

EUR/JPY 1H Analysis – Ascending Channel With Critical ResistanceThe EUR/JPY pair has been trending steadily inside a well-defined ascending channel, indicating bullish control over the past few weeks. However, price is now approaching a major horizontal resistance zone, aligning with the upper boundary of the channel — a critical area for potential breakout or reversal.
🔍 Chart Structure Breakdown:
🔹 1. Ascending Channel (Trend Continuation Structure)
The pair is respecting both the upper and lower trendlines precisely, forming a bullish parallel channel.
EMAs are aligned bullishly and acting as dynamic support.
Price continues forming higher highs and higher lows, a classic uptrend behavior.
🔹 2. Horizontal Resistance Zone (Purple Box)
The price is currently retesting a key horizontal resistance zone where sellers previously stepped in.
This zone aligns closely with the upper channel boundary, increasing confluence.
We could be witnessing a potential double top or a breakout build-up.
🔹 3. Volume Spike & Buyer Strength
Recent candles show increased volume — a possible signal that institutions are preparing for a larger move.
If volume increases further on breakout, it would confirm continuation.
🧭 Scenarios to Watch:
🟢 Bullish Scenario:
A strong breakout above the purple zone with a full-body candle close could signal:
A breakout from the ascending channel.
Fresh bullish momentum possibly targeting the 170.800–171.500 zone.
Ideal entry: On bullish retest of the breakout zone.
SL below breakout candle; TP at upper Fibonacci extensions.
🔴 Bearish Scenario (Double Top Rejection):
If price rejects the resistance zone again, forming a lower high or engulfing candle:
Expect a short-term pullback toward the midline or lower channel, around 168.500–168.000.
Bearish divergence with RSI or volume may confirm weakness.
This would create a Double Top inside the channel, often leading to a deeper correction.
📌 Conclusion:
EURJPY is at a make-or-break zone. The bullish structure remains intact, but the price must break and hold above the resistance to confirm strength. Until then, this could be a short-term exhaustion point.
🔄 Stay flexible. Watch volume, candle closes, and EMA behavior for confluence on your trade setup.
This analysis and chart work are entirely original and created from my own observations and strategy. Any resemblance to other posts is purely coincidental.
⚠️ Disclaimer:
This analysis is for educational and informational purposes only and does not constitute financial advice or a buy/sell recommendation. All views expressed are my own, based on personal technical interpretation.

Oderblock liquidity The market will create a structure within a structure to try to push the market back to the traps ,all you have to do is wait and be a friend of the trend
The Correlation Between EURJPY and NASDAQ You Shouldn't IgnoreCurrently keeping a close eye on EURJPY — price action has been bullish 📈, showing a strong upward push on the daily timeframe 🕒.
Right now, we’re seeing a bit of indecision 🤔, which is fairly typical for a Monday session as the market finds its footing.
🔍 I’m watching for continuation to the upside, as long as NASDAQ remains bullish. That said, NASDAQ is looking quite overextended 🧗, and a pullback could trigger a short-term retracement in the euro as well — these two tend to move in correlation 🔗, so keep a close watch on NAS100 for early clues.
If EURJPY consolidates sideways ⏸️, and we then get a clear break of market structure to the upside 🚀, I’ll be looking for a long setup on the retest and failure of the range floor — textbook continuation play 🎯.
As always, this is not financial advice — full breakdown in the video 🎥.

EURJPY 4hour TF - June 29th, 2025EURJPY 4hour Bullish Idea
Monthly - Bullish
Weekly - Bullish
Daily - Bullish
4hour - Bullish
EJ has been in a bullish trend on all timeframes and doesn’t really show any signs of stopping. Currently we are right near major monthly resistance around 171.000. It is likely we will see price action push into this zone but we want to identify a potential trade beforehand.
Here are two potential scenarios for this week on EJ
Bullish Continuation - We are a bit close to the 171.000 monthly zone so we would like to see price action come back to our 168.500 4hour support zone before targeting higher.
Trend Reversal - If we see price action fall below 168.500 we want to see bearish conviction and rejection from that same zone. If this happens we can start to consider short scenarios and target lower support levels like 166.250.

EURJPY MARKET ANALYSIS AND PRICE PREDICTIONEURJPY, has finished consolidating at the intuitional renegotiation zone. Decision has been taken in favor of the Bulls. price has retested the FVG and has given the Bulls a perfect entry now. 174.473 is the target. stop loss should be below the RBN( renegotiation block) at 167.867.
If You have a sizeable account, Hit this one hard, and hold it for a week or two. Don't Forget to send your Tithes.
GOOD LUCK GUYS!
DISCLAIMER
Manage your own Risk. Any analysis can fail due to market sentiments. Take care of your trading capital!

EUR/JPY higherPrice retraced from Weekly FVG. The retracement had high momentum down, making Fair Value Gaps on the 4H. After 3 things aligned:
1. Price made new 4H Fair Value Gap coming from the Daily Fair Value Gap
2. Price disrespected Swing High in 4H Fair Value Gap
3. Rejection off D FVG closed with perfect 2 candle rejection.
I entered the trade after I've seen the close on the daily timeframe, Stop below the 4H Fair Value Gaps.

EURJPY- buying SetupEURJPY- BuAiming for atleast 50% target to be acheived in buying position based on technical analysis and CRT Strategy. lets see how it goes :)

EURJPY Long Opportunity EURJPY currently has bullish market directionality and is on a retracement. price is trading above the 50 SMA and we can observe bullish momentum from the RSI trading above the 55 level.
Potentially break and retest zone at 167,550. Awaiting a reaction to this level which could see the bullish trend resuming.

EURJPY – Buy the Dip in a Bullish TrendTrade Idea
Type: Buy Limit
Entry: 167.63
Target: 169.50
Stop Loss: 166.87
Duration: Intraday
Expires: 25/06/2025 06:00
Technical Overview
The broader trend in EURJPY remains bullish, and there's no clear indication the uptrend is ending.
While a short-term correction is possible, it is viewed as a healthy retracement within the trend.
A Buy Limit at 168.00, just above support, provides an efficient entry with a tight stop and strong upside potential.
A move above 169.00 would confirm renewed bullish momentum, aligning with the measured move target at 169.75.
With no major economic events in the next 24 hours, price action is expected to be technically driven.
Key Technical Levels
Support: 168.50 / 168.00 / 167.50
Resistance: 169.00 / 169.50 / 169.75
Disclosure: I am part of Trade Nation's Influencer program and receive a monthly fee for using their TradingView charts in my analysis.

EURJPY TRADE SETUPWait for retest the key level and bullish momentum then take a trade for Buy otherwise skip this setup

Multi-Timeframe Analysis & Trend Continuation TradingThe EURJPY has recently violated an important level of structure leading us to make the prediction of price continuing to go higher.
In this video we'll take a look at where the next stopping point may be and what I'm waiting for the market to do in order to get involved in the trade.
If you have any questions, comments or just want to share your views/analysis, please do so below.
Akil
