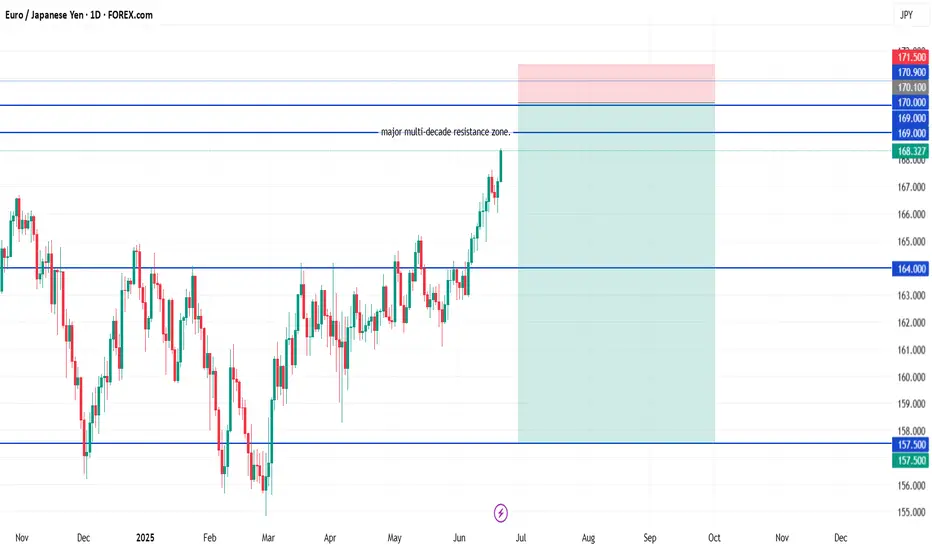
EUR/JPY Short✅ EUR/JPY Swing Short Setup (Multi-Entry)
🎯 Entries:
Entry 1: 169.00 (light position)
Entry 2: 170.10 (core entry)
Entry 3: 170.90 (final top entry)
🛡️ Stop Loss (Unified):
171.50
Placed above the entire resistance zone and previous all-time wick highs, allowing for normal trap behavior without overexposure.
🎯 Take Profits:
TP1: 164.00
TP2: 157.50
You can scale out partially at TP1 or run the full position to TP2 depending on how momentum builds.
EURJPY trade ideas
#EURJPY: Major Swing Sell +1100 Pips, One Not To Miss! The Japanese Yen (JPY) is most likely to continue its bullish trend, as the Dollar Index (DXY) is expected to decline due to the ongoing conflict between Israel and Iran. Historically, JPY and CHF, alongside gold and silver, have been favoured by global investors and remain bullish. Strong fundamentals and technical support further support our analysis.
The 167-169 price region remains a critical point for sellers, where we anticipate significant selling volume. There are two entry points to consider: one near the current price and another slightly further away. Please monitor volume and use smaller time frames for entries.
Our Swing Target is at 154, but you can also target smaller zones once the trade is activated. For instance, set take-profit levels at 164, 160, and finally, at 154.
To encourage and support us, you can like the idea, comment on it, or share it.
Team Setupsfx_
❤️❤️🚀🚀

EURJPY Possible Swing Bearish Play EURJPY is shapimg up for some long-term bearish movement still to early for any plays. I will be looking to position my self in from august onwards if the fundamentals and technicals give me an indication.

EURJPY: Buy The Dip Or Breakout ContinuationI'm looking to buy EJ...
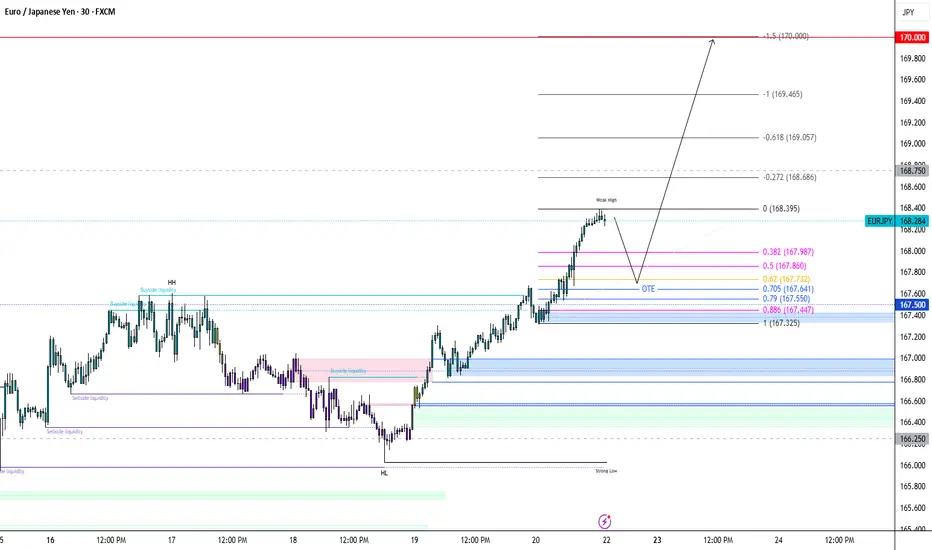
If price retraces early next week, monitor 167.40–167.70 zone for bullish reaction and confirmation. Wait for M15 bullish BOS after price taps 167.40–167.70. If confirmed, execute long entry from this discounted range.
Entry: 167.40 – 167.70
Stop Loss: 167.10
TP1: 168.60
TP2: 169.20
TP3: 170
If price breaks and closes above 168.60, look for a retest for breakout continuation.
Trigger: Break + H1 candle close above 168.60
Entry on Retest: 168.60 – 168.70
Stop Loss: 168.20
Target: 169.50 – 170.00
Invalidation: H4 structure break below 167.00 would weaken bullish outlook short term
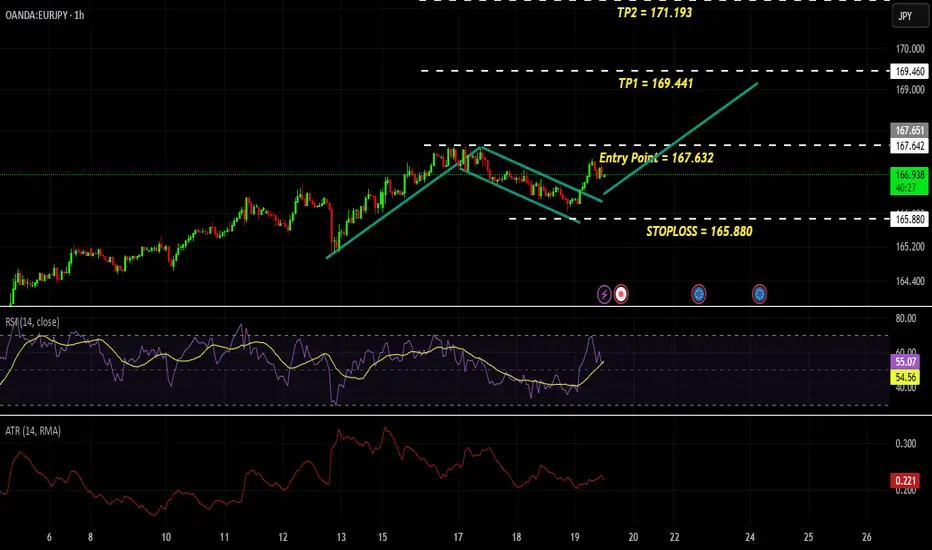
EUR/JPY Breakout Done , Long Setup Valid To Get 200 Pips !Here is my opinion on EUR/JPY , We have a very clear breakout and now i`m waiting for retest to broken res and new support and waiting for good bullish price action to enter a buy trade and targeting at least previous high , if the price go back below my support with daily closure then this idea will not be valid .

EUR/JPY Breaks Fibonacci Barrier – Room to RallyEUR/JPY has broken convincingly above the 61.8% Fibonacci retracement level at 167.42, clearing a major technical hurdle and reaffirming bullish momentum. This breakout also aligns with the pair's broader uptrend supported by the 50-day and 200-day SMAs, which are upward sloping and stacked in bullish order.
Technical Highlights:
Trend & Structure: Strong bullish structure with higher highs and higher lows; today's close above the 167.42 Fibonacci level confirms continuation.
Moving Averages: Price is comfortably above the 50-day and 200-day SMAs, with both acting as dynamic support zones.
MACD: Rising and bullish, with widening histogram bars indicating strengthening momentum.
RSI: At 70.4, the RSI has just entered overbought territory. While this signals strength, traders should also stay alert for signs of potential short-term consolidation or cooling.
Key Level to Watch: The next upside target lies near the 78.6% Fibonacci retracement at 170.93. That level could act as a magnet in the coming sessions if bullish momentum persists. Any retest of the breakout zone around 167.4 could serve as a launchpad if defended.
EUR/JPY remains technically strong, with bullish continuation favored unless price breaks back below the 50-day SMA.
-MW

Trade Recap CW25Recap of my three positions from last week + one missed position that was higher in risk.

EURJPY Bullish Bias on the 4H Daily Up trend
4H short term down trend for pull back
support level
Long wick candle rejecting support and 50 ema
Followed by a bullish engulfing candle at support breaking trend line
Signaling buyers stepping in.
For Entry
Limit order at the 50% fib level or
set an alert or watch the market to see bullish price action at this level.

EURJPY - BullishStory: Market is in bullish trend with series of HH and HLs. There is no divergence on the chart therefore we expect market to continue bullish trend. as the market is continuing bullish, we look for any continuation pattern. Yes, we have found one, which is bullish flag pattern.
there is no reversal or harmonic pattern.
Anticipate : it is anticipated that market will breakout the Flag neck line and we anticipate the market to reach its projection of flag-pole.
Plan is to enter in the market on break out of neckline and continue riding till the projection of flag-pole with our SL placed just below the Marked HLs and we set our TP1 and TP2 with R:R of 1:1 and 1:2 respectively.
Eurjpy longEur jpy long with target 168.00
With clear uptrend and has finish the retracement going to the main trend

EURJPY A Fall Expected! SELL!
My dear subscribers,
EURJPY looks like it will make a good move, and here are the details:
The market is trading on 166.89 pivot level.
Bias - Bearish
Technical Indicators: Both Super Trend & Pivot HL indicate a highly probable Bearish continuation.
Target - 166.57
About Used Indicators:
The average true range (ATR) plays an important role in 'Supertrend' as the indicator uses ATR to calculate its value. The ATR indicator signals the degree of price volatility.
Disclosure: I am part of Trade Nation's Influencer program and receive a monthly fee for using their TradingView charts in my analysis.
———————————
WISH YOU ALL LUCK

EUR/JPY BEST PLACE TO SELL FROM|SHORT
EUR/JPY SIGNAL
Trade Direction: short
Entry Level: 167.194
Target Level: 165.108
Stop Loss: 168.580
RISK PROFILE
Risk level: medium
Suggested risk: 1%
Timeframe: 17h
Disclosure: I am part of Trade Nation's Influencer program and receive a monthly fee for using their TradingView charts in my analysis.
✅LIKE AND COMMENT MY IDEAS✅

CHECK EURJPY SIGNAL READ CAPTAINeurjpy) sell zone
(trade satup)
entry point (167.000) to (167.050) 📊
first target (166.800)📊
2nd target (166.600) 📊
last target (166.400) 📊
stop loss (167.300)❌

EURJPY: Strong Bullish Signal📉EURJPY has effectively adhered to a significant intraday/daily horizontal resistance.
Following a liquidity grab below this level, the price formed a strong bullish imbalance candle on the 4-hour chart.
I anticipate that the pair will pull back to 167.37.


EURJPY – The Sweep That Sparked the ShiftSometimes the cleanest moves start with discomfort.
This EURJPY setup began with a sweep below the Previous Day’s Low (PDL), clearing out weak hands and gathering liquidity. That was our first clue.
Then came the Break of Structure (BOS), a confirmation that the market had shifted bullish.
Now will be waiting for price to retrace back to the FVG, where it found its footing and launched upward. Smart money cleared the lows, shifted structure .
Stick to the process. Trust what the chart is telling you.
Don’t chase, align.

EUR/JPY Sell incomingWe see this Pair reached the Top of a HTF Structure
It breaked out and formed some LTF Correction but not to go higher
instead it reversed. Now we are forming some LTF Correction what also is forming
to a Head and Shoulder Pattern.You can see the HnS forming when you go to LTF.
Wait for the current correction to fninish to confirm this setup

EURJPY LONG FORECAST Q2 W25 D19 Y25EURJPY LONG FORECAST Q2 W25 D19 Y25
Professional Risk Managers👋
Welcome back to another FRGNT chart update📈
Diving into some Forex setups using predominantly higher time frame order blocks alongside confirmation breaks of structure.
Let’s see what price action is telling us today! 👀
💡Here are some trade confluences📝
✅Weekly 50 EMA
✅15' Order block identification
✅Daily Order block rejection
✅4H order block identification
🔑 Remember, to participate in trading comes always with a degree of risk, therefore as professional risk managers it remains vital that we stick to our risk management plan as well as our trading strategies.
📈The rest, we leave to the balance of probabilities.
💡Fail to plan. Plan to fail.
🏆It has always been that simple.
❤️Good luck with your trading journey, I shall see you at the very top.
🎯Trade consistent, FRGNT X

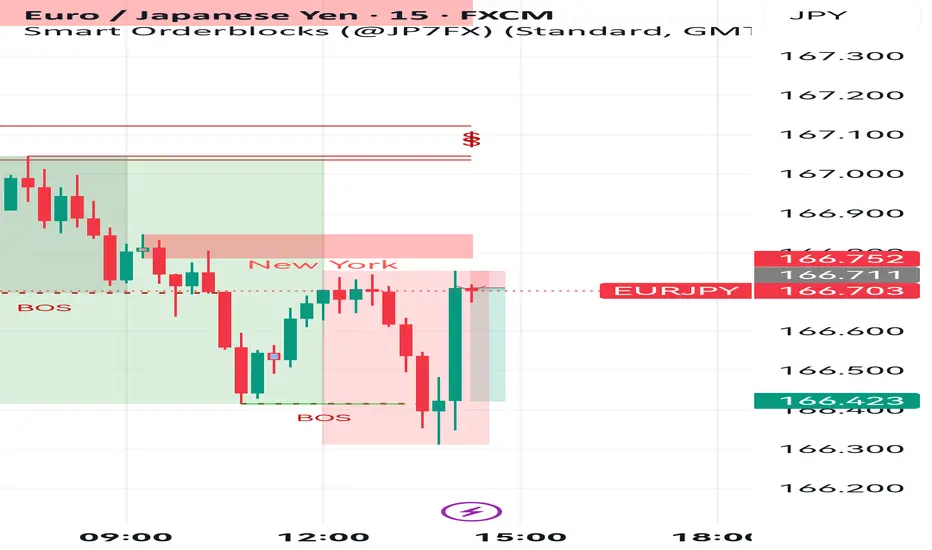
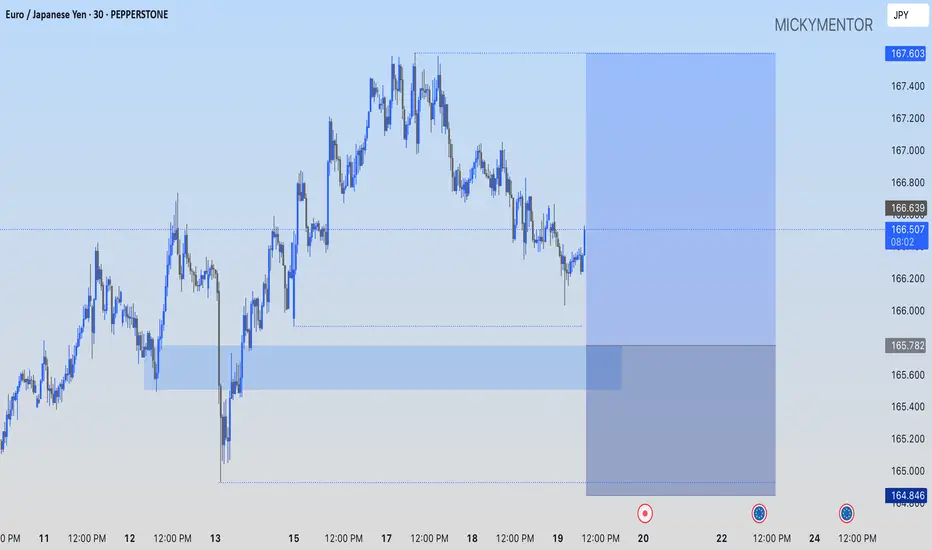
EURJPY Long Opportunity EURJPY has Bullish market directionality and is currently on a retracement per the 4 hour charts. Potential entry location at 166,425
Bullish confluences include price trading above the 50 SMA, Bullish momentum from the RSI with the current indication of price sitting within the sweet spot region between 45-55 which signals the need of the retracement. Bullish market structure also present with Higher Low and respective Higher Highs
166,425 is also a break and retest zone which provides an extra layer of confluence from the 4 hour perspective, will be looking at how price action reacts to this level on the 1 hour/ 15min chart for a potential bullish signal.

EUrJPYreckon this will go back to highs?
it broke a massive resistance so i assume so
nice wicks too on support lets see aye

EUR-JPY Bullish Continuation! Buy!
Hello,Traders!
EUR-JPY is trading in an
Uptrend and the pair made
A bullish breakout of the key
Horizontal level of 166.162
And the breakout is confirmed
So after the retest of the
New support we will be
Expecting a bullish continuation
Buy!
Comment and subscribe to help us grow!
Check out other forecasts below too!
Disclosure: I am part of Trade Nation's Influencer program and receive a monthly fee for using their TradingView charts in my analysis.
