eurnzd sell signal. Don't forget about stop-loss.
Write in the comments all your questions and instruments analysis of which you want to see.
Friends, push the like button, write a comment, and share with your mates - that would be the best THANK YOU.
P.S. I personally will open entry if the price will show it according to my strategy.
Always make your analysis before a trade
EURNZD trade ideas

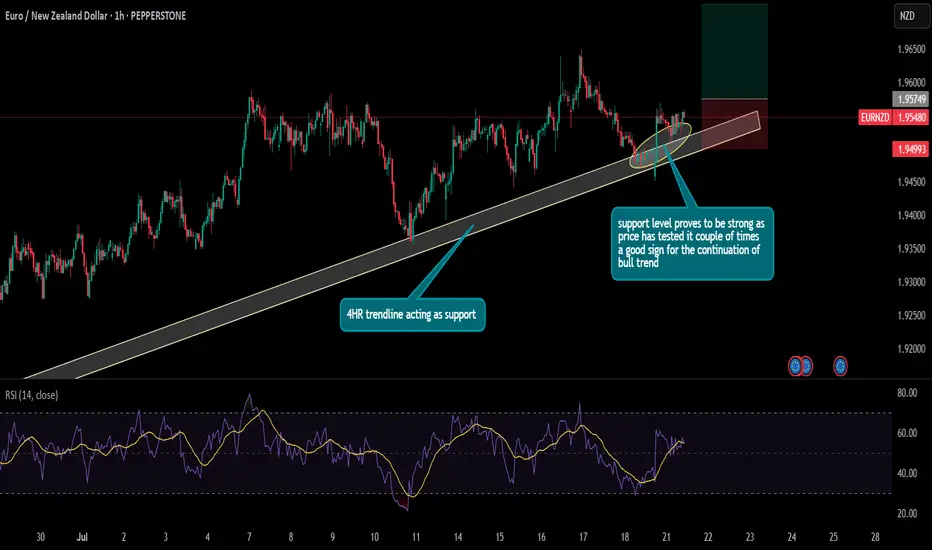
EURNZD continues to be in bullish trend as shown in the chart, the 4-hour tf trendline is acting as a strong support level since the price has tested it multiple times to continue the bullish trend therefore a buy trade idea has been given on the chart according to the price action
EURNZD long setupBuying from fresh demand zone after bullish structure break.
Daily showing strong momentum, 1H confirms continuation with clean break and retest zone.
📍Entry: Demand zone
🎯 Target: 2R
🛑 SL: Below demand zone
Risk-Reward: Favorable setup aligning with higher timeframe bias.
#trading #forextrading #EURNZD #priceaction #smartmoney #demandzone #tradingsetup #forexanalysis
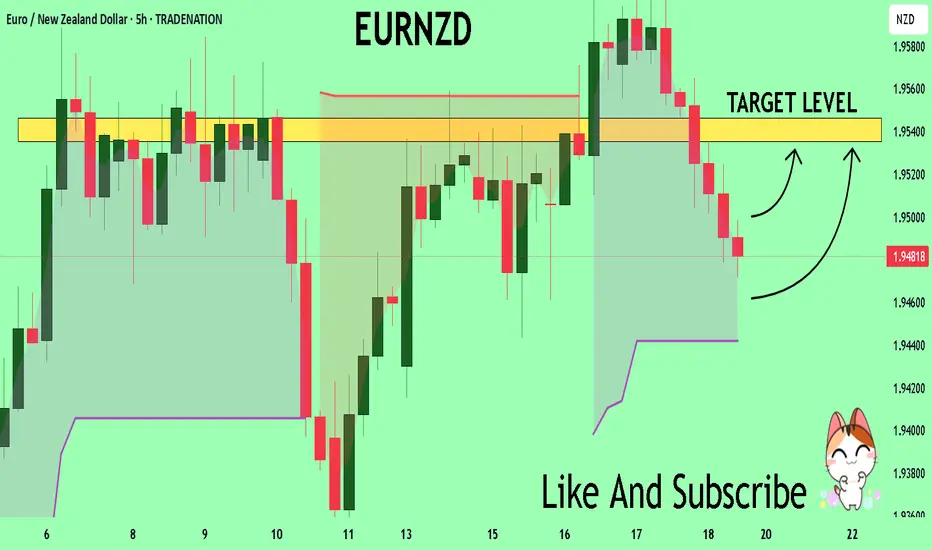
EURNZD Will Go Lower From Resistance! Sell!
Take a look at our analysis for EURNZD.
Time Frame: 15m
Current Trend: Bearish
Sentiment: Overbought (based on 7-period RSI)
Forecast: Bearish
The market is on a crucial zone of supply 1.945.
The above-mentioned technicals clearly indicate the dominance of sellers on the market. I recommend shorting the instrument, aiming at 1.943 level.
P.S
Overbought describes a period of time where there has been a significant and consistent upward move in price over a period of time without much pullback.
Disclosure: I am part of Trade Nation's Influencer program and receive a monthly fee for using their TradingView charts in my analysis.
Like and subscribe and comment my ideas if you enjoy them!

Eurnzd buy Eurnzd is in uptrend currently, now we have a pullback to a interesting support where we have a bounce . Looks a solid area to buy up to next resistance zone of 1.9500 to 1.9700 areas take profits.

EURNZD Wave Analysis – 18 July 2025
- EURNZD reversed from the resistance area
- Likely to fall to support level 1.9400
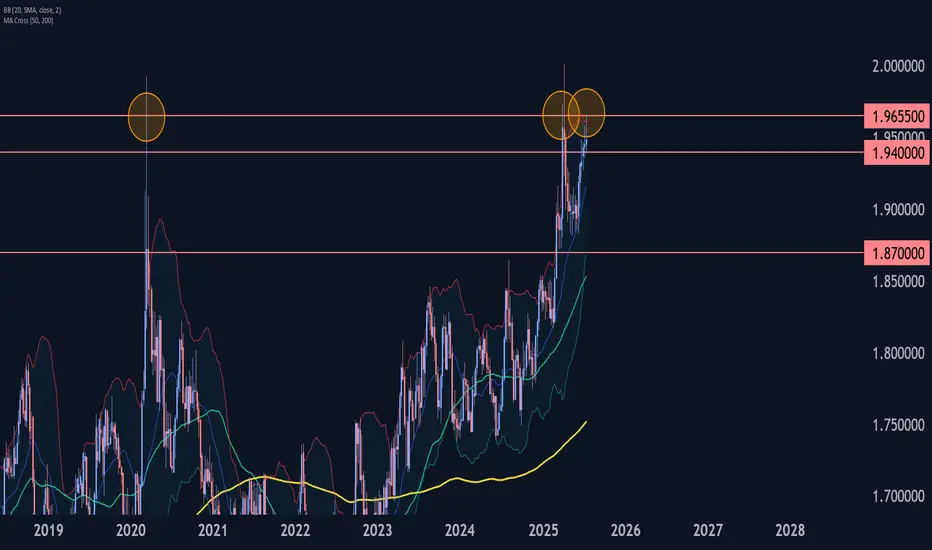
EURNZD currency pair recently reversed down from the resistance area between the major long-term resistance level 1.9655 (which has been reversing the price from the start of 2020) and the upper weekly Bollinger Band.
The downward reversal from this resistance area stopped the previous medium-term impulse wave (5).
Given the strength of the resistance level 1.9655, EURNZD currency pair can be expected to fall to the next support level 1.9400.
EURNZD On The Rise! BUY!
My dear friends,
EURNZD looks like it will make a good move, and here are the details:
The market is trading on 1.9481 pivot level.
Bias - Bullish
Technical Indicators: Supper Trend generates a clear long signal while Pivot Point HL is currently determining the overall Bullish trend of the market.
Goal - 1.9535
About Used Indicators:
Pivot points are a great way to identify areas of support and resistance, but they work best when combined with other kinds of technical analysis
Disclosure: I am part of Trade Nation's Influencer program and receive a monthly fee for using their TradingView charts in my analysis.
———————————
WISH YOU ALL LUCK
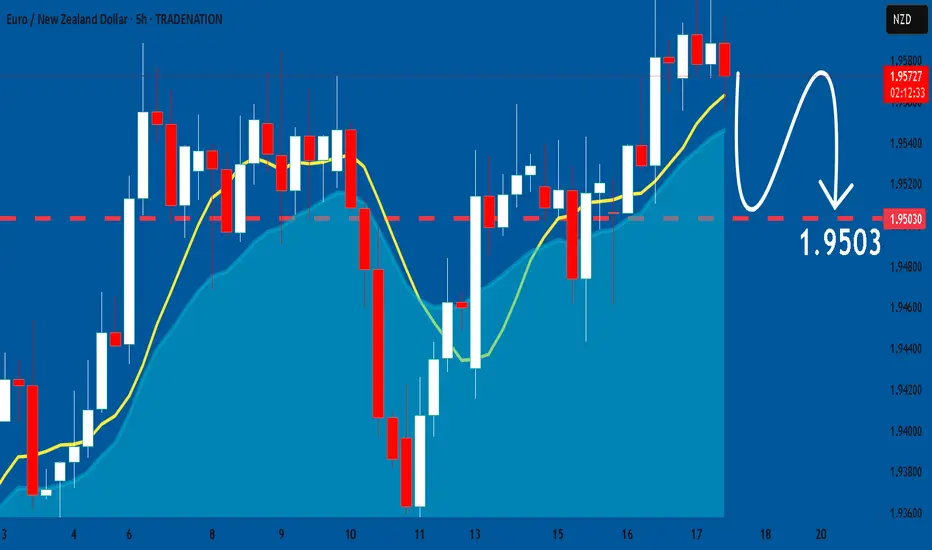
EURNZD: Bearish Forecast & Bearish Scenario
The analysis of the EURNZD chart clearly shows us that the pair is finally about to tank due to the rising pressure from the sellers.
Disclosure: I am part of Trade Nation's Influencer program and receive a monthly fee for using their TradingView charts in my analysis.
❤️ Please, support our work with like & comment! ❤️
EUR-NZD Will Keep Growing! Buy!
Hello,Traders!
EUR-NZD is trading in a
Strong uptrend and the
Pair made a bullish breakout
Of the key horizontal level
Of 1.9580 so we are bullish
Biased and we will be expecting
A further bullish move up
Buy!
Comment and subscribe to help us grow!
Check out other forecasts below too!
Disclosure: I am part of Trade Nation's Influencer program and receive a monthly fee for using their TradingView charts in my analysis.

EUR_NZD REBOUND AHEAD|LONG|
✅EUR_NZD fell again to retest the support of 1.9380
But it is a strong key level
So I think that there is a high chance
That we will see a bullish rebound and a move up
LONG🚀
✅Like and subscribe to never miss a new idea!✅
Disclosure: I am part of Trade Nation's Influencer program and receive a monthly fee for using their TradingView charts in my analysis.

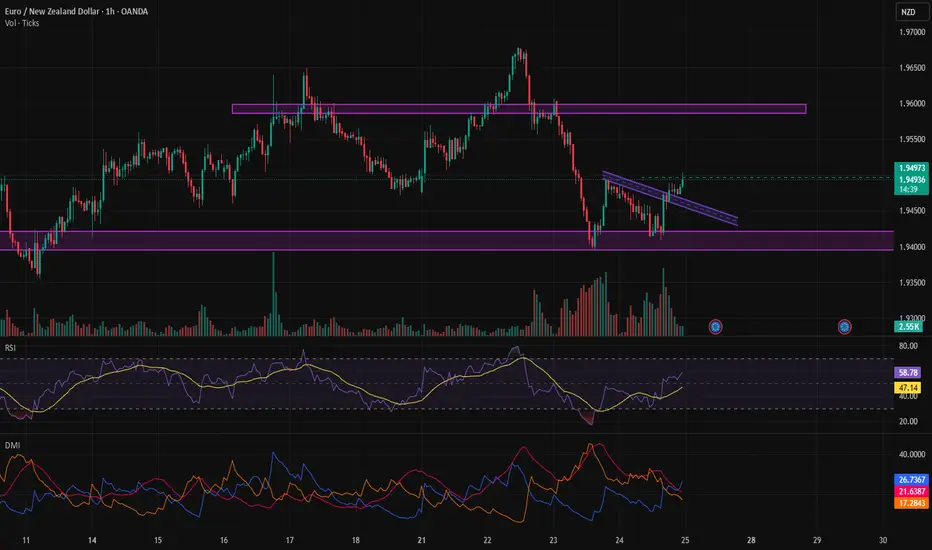
EURNZD Update: This short trigger could spark a waterfall dropYo traders, Skeptic from Skeptic Lab! 🩵 EURNZD just broke its daily upward trendline, setting up a sharp drop. Weekly shows a fading uptrend. Daily’s got a strong bearish candle, full body, no buyer fight. 4H trendline broke and... more on this video:)
👀Beware of fakeouts this week—volatility’s high! Trade smart, keep risk tight, and don’t FOMO. Share your thoughts in the comments, boost if it helps <3

EUR-NZD Will Grow! Buy!
Hello,Traders!
EUR-NZD keeps falling
Down and we are bearish
Biased mid-term but there is
A horizontal support level
Below at 1.9370 so after
The retest we might expect
A local bullish correction
Buy!
Comment and subscribe to help us grow!
Check out other forecasts below too!
Disclosure: I am part of Trade Nation's Influencer program and receive a monthly fee for using their TradingView charts in my analysis.

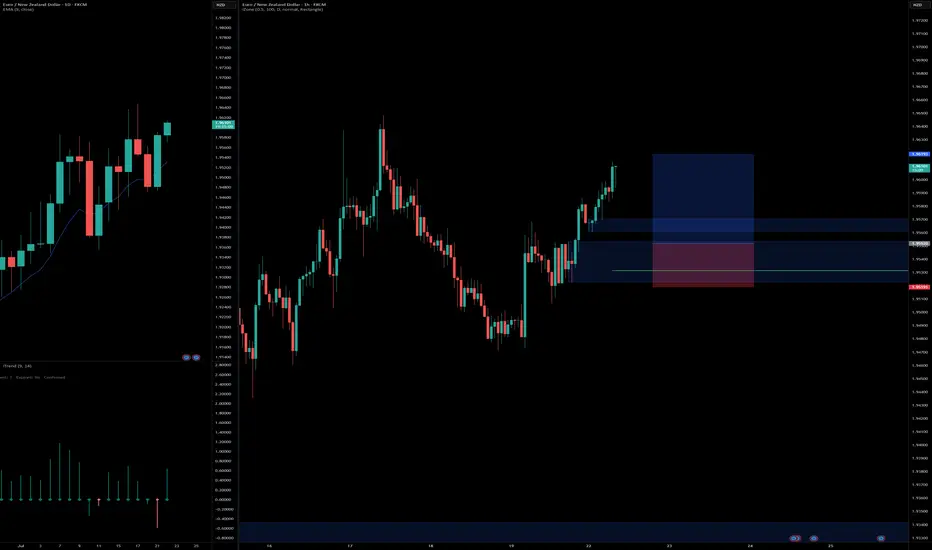
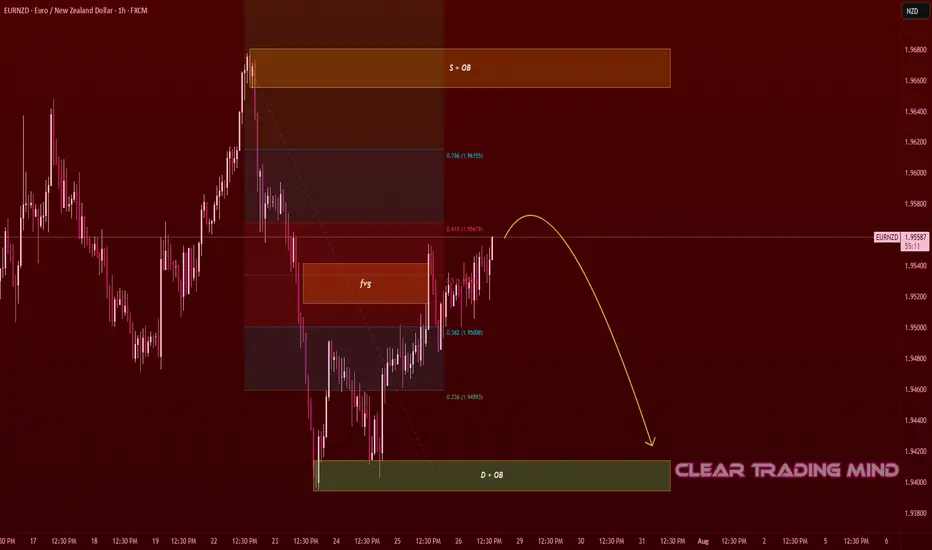
EURNZD Supply Test – Short Setup to DemandOn the 1-hour chart, EURNZD is approaching the 0.618 Fib retracement level and testing a Fair Value Gap (FVG) 🟧 after a strong bearish move.
- Supply + OB zone above 1.96600 is acting as resistance
- Demand + OB zone near 1.94000 is the target area
Plan:
- Expecting a rejection from current levels (1.95500 – 1.95700) or from the upper supply zone
🎯 Target: Demand Zone near 1.94200 – 1.94000 (≈ 150 pips potential move)
🛡 Invalidation: Clean breakout and hold above 1.96600 supply zone
Reasoning:
- Market structure remains bearish after the recent drop
- Supply zone + FVG + Fib retracement creates a strong confluence for rejection
- Looking for confirmation before short entry
(Not financial advice – just a personal market observation)
EURNZD ShortAfter a recent Market Structure Shift (MSS) signaling a bearish direction, I'm looking to short at 1.95692. The supply zone aligns perfectly with the 61.8% retracement level, and there's a potential liquidity/inducement level forming, adding confluence to the trade.

Did you take advantage of the setup I mentioned?We’ll decide the next move after reaching the top.
Good luck!
Is it time to buy?Rising from a significant low, a pullback, and increasing volume can be good signs for a potential buy.
EURNZD SHORT UPDATE ON SHARE ANALYSIS
WE CREATED THE FVG AS PREDICTED
WE GOT A DECENT REACTION
WE CREATED A SMALL CHCOH + FVG ON 5M TF
JUST ENTERED THE POSITION
I am not a financial advisor, and this is not financial advice. The information shared is for educational and informational purposes only and reflects my personal opinion and analysis. Please do your own research and consult with a qualified financial professional before making any trading or investment decisions. Trading involves risk, and you should never invest more than you can afford to lose.

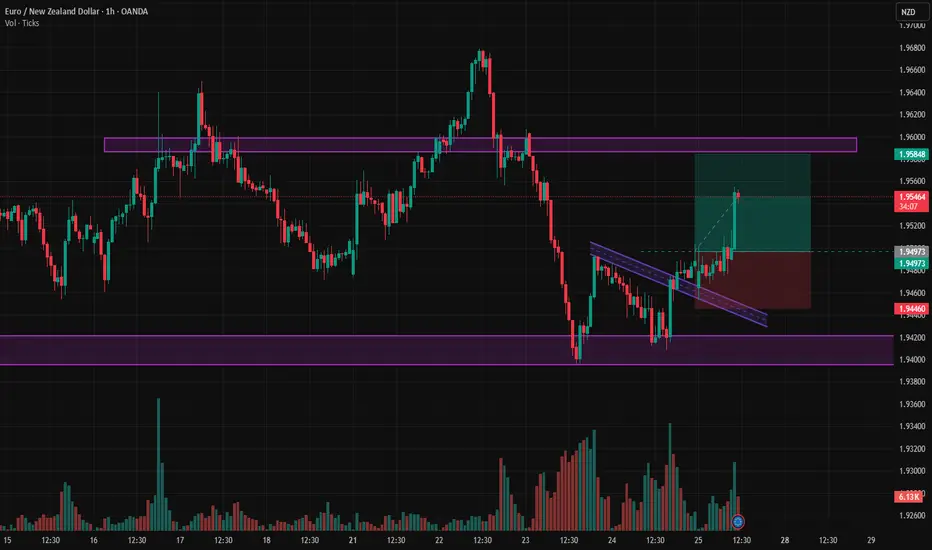
EUR/NZD short scalp opportunityI am looking for a short scalp opportunity on EUR/NZD.
Only if this 1H FVG will form and hold.
I will look for downside momentum to short after a reaction from the 1H FVG
Target = previous day low, but after 2RR you can take partials.
I am not a financial advisor, and this is not financial advice. The information shared is for educational and informational purposes only and reflects my personal opinion and analysis. Please do your own research and consult with a qualified financial professional before making any trading or investment decisions. Trading involves risk, and you should never invest more than you can afford to lose.

EUR/NZD SENDS CLEAR BEARISH SIGNALS|SHORT
Hello, Friends!
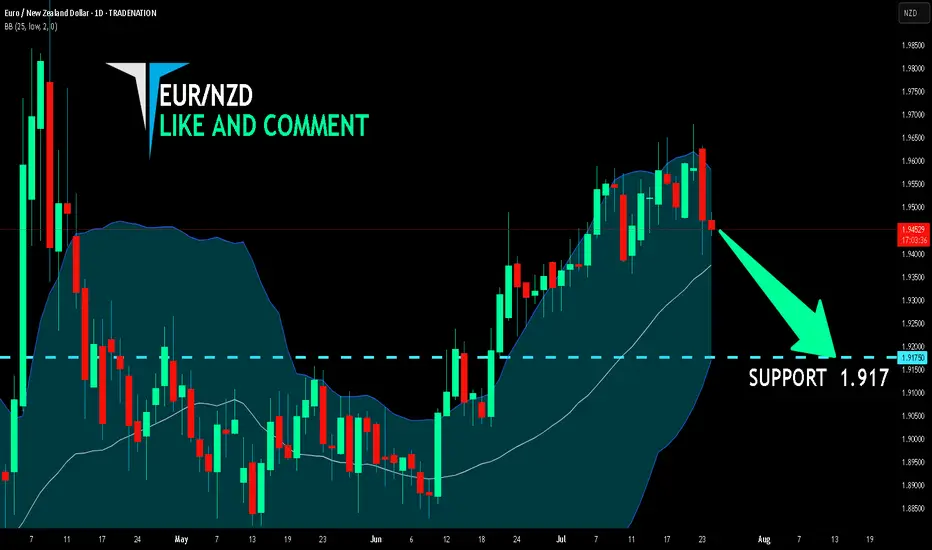
The BB upper band is nearby so EUR-NZD is in the overbought territory. Thus, despite the uptrend on the 1W timeframe I think that we will see a bearish reaction from the resistance line above and a move down towards the target at around 1.917.
Disclosure: I am part of Trade Nation's Influencer program and receive a monthly fee for using their TradingView charts in my analysis.
✅LIKE AND COMMENT MY IDEAS✅
EUR / NZD - Buy on H1Buy EUR / NZD at Current Market Price on H1.
Entry Price : 1.95746
Stop Loss : 1.94668
TP1 : 1:1
TP2 : 1:2
Confluences for the trade are as follows:
- Price is an upward Channel
- No Divergence Detected
- Price is retracing and is at the 0.5 to 0.618 level after breaking the last higher high

Eurnzd buy againEurnzd i gave on the 20th July took profits now pulled back and ready to r3buy back in at 1.95940 looking to take profits at 1.96683

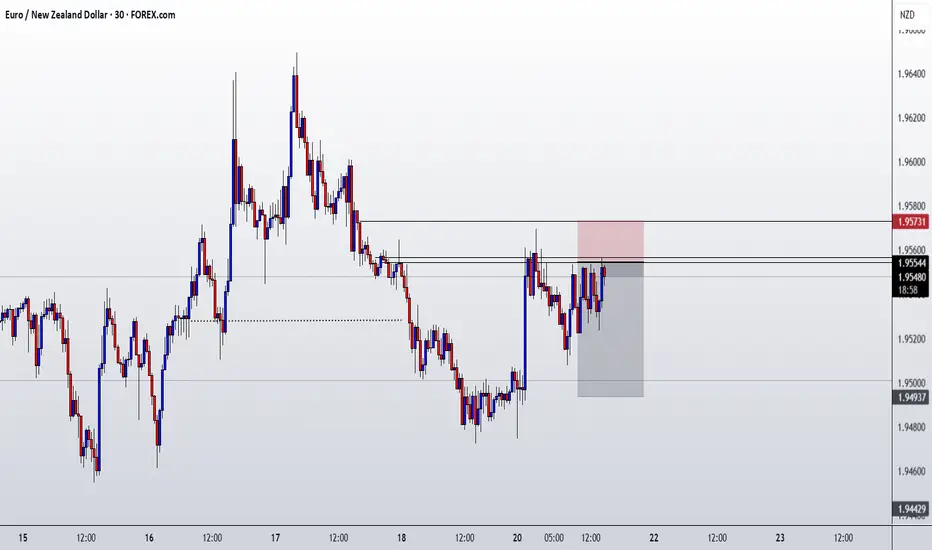
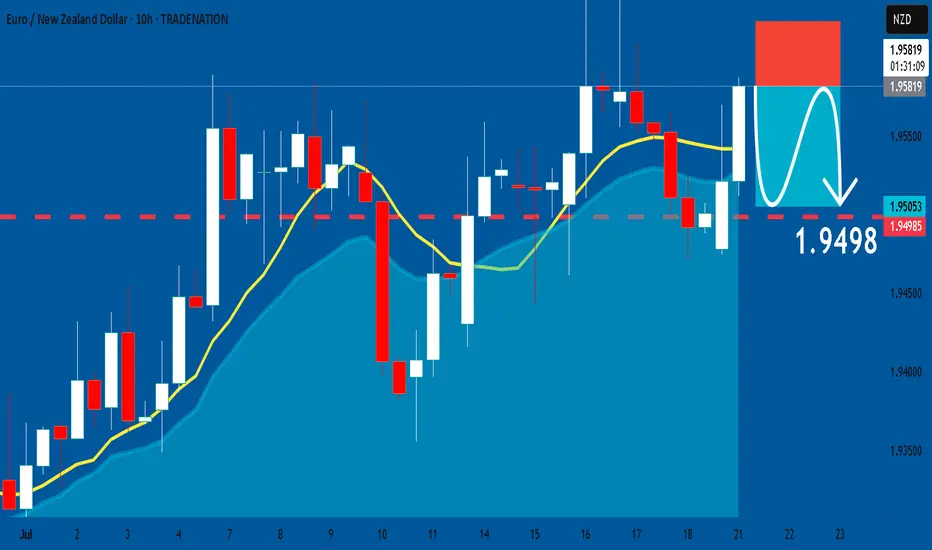
EURNZD: Short Signal with Entry/SL/TP
EURNZD
- Classic bearish formation
- Our team expects pullback
SUGGESTED TRADE:
Swing Trade
Short EURNZD
Entry - 1.9581
Sl - 1.9622
Tp - 1.9498
Our Risk - 1%
Start protection of your profits from lower levels
Disclosure: I am part of Trade Nation's Influencer program and receive a monthly fee for using their TradingView charts in my analysis.
❤️ Please, support our work with like & comment! ❤️
EURNZD ENTRY CHARTOn this Pair, we are BEARISH, the Trend is still BEARISH, the NEW ZEALAND DOLLAR is beginning to gain STRENGTH, the DAILY open gave us a Confluence with the H4 tf giving us a SELL FORMATION, on the H1, we got our Structure area, with a LTF entry confirmation + Inducement, So if this matches with your Trade Idea, you can look to join US, and Apply a Good risk Management.We will give Update in the UPDATE SECTION THANK YOU.