Nike - Time to breakout?!Nike (NKE) – Just Do It… Bullish Edition 🏆
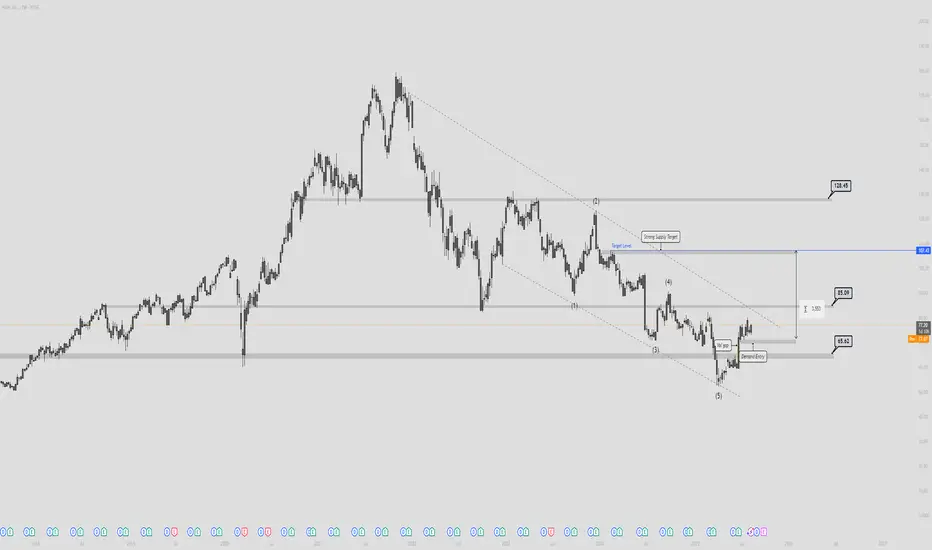
After running a marathon straight downhill, Nike finally tied its laces at $65.62 and said, “Enough!” That demand zone was like a comfy Air Max cushion — price bounced right off it.
We’ve got a completed 5-wave drop ✅, a nice reaction out of the vol gap ✅, and a clean path toward some serious upside targets.
Game Plan:
Step 1: Hold above $77.00 – this is our warm-up lap. 🏃♂️
Step 2: Sprint to $85.09 – mid-race checkpoint. 🏁
Step 3: Blast through to $107.47 – the “Strong Supply” finish line. 🏆
Bonus Round: If momentum is feeling spicy, $128.45 could be the victory parade. 🎉
Why the hype?
This is textbook “bottom’s in” energy — demand zone respected, bearish structure completed, and upside room that looks like an open basketball court. Bulls just need to keep possession.
TL;DR:
If Nike clears $85 with volume, the bulls could run all the way to triple-digit land. Just… don’t trip over those moving averages. 😉Good luck and follow for more!
4NKE trade ideas
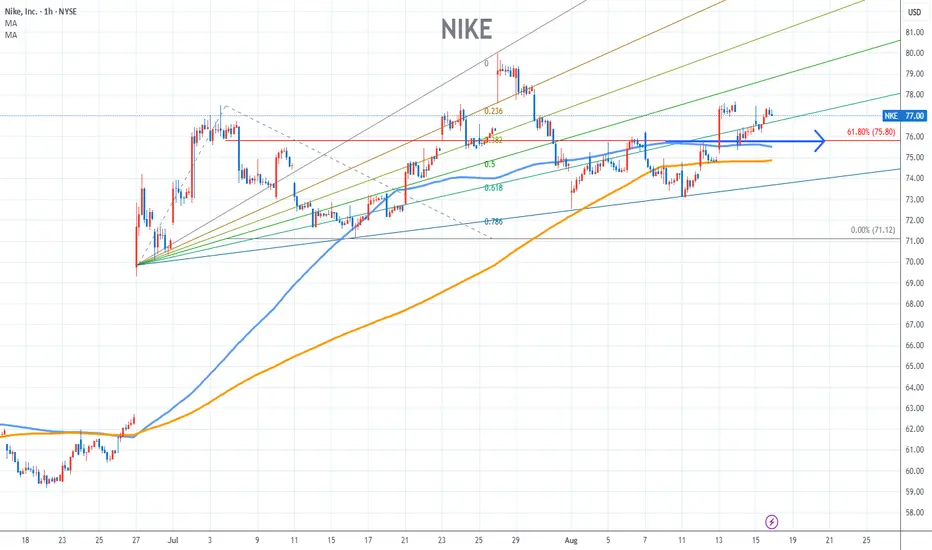
Nike Stock Chart Fibonacci Analysis 081525Trading Idea
1) Find a FIBO slingshot
2) Check FIBO 61.80% level
3) Entry Point > 76/61.80%
Chart time frame:B
A) 15 min(1W-3M)
B) 1 hr(3M-6M)
C) 4 hr(6M-1year)
D) 1 day(1-3years)
Stock progress:A
A) Keep rising over 61.80% resistance
B) 61.80% resistance
C) 61.80% support
D) Hit the bottom
E) Hit the top
Stocks rise as they rise from support and fall from resistance. Our goal is to find a low support point and enter. It can be referred to as buying at the pullback point. The pullback point can be found with a Fibonacci extension of 61.80%. This is a step to find entry level. 1) Find a triangle (Fibonacci Speed Fan Line) that connects the high (resistance) and low (support) points of the stock in progress, where it is continuously expressed as a Slingshot, 2) and create a Fibonacci extension level for the first rising wave from the start point of slingshot pattern.
When the current price goes over 61.80% level , that can be a good entry point, especially if the SMA 100 and 200 curves are gathered together at 61.80%, it is a very good entry point.
As a great help, tradingview provides these Fibonacci speed fan lines and extension levels with ease. So if you use the Fibonacci fan line, the extension level, and the SMA 100/200 curve well, you can find an entry point for the stock market. At least you have to enter at this low point to avoid trading failure, and if you are skilled at entering this low point, with fibonacci6180 technique, your reading skill to chart will be greatly improved.
If you want to do day trading, please set the time frame to 5 minutes or 15 minutes, and you will see many of the low point of rising stocks.
If you want to prefer long term range trading, you can set the time frame to 1 hr or 1 day
NIKE Bearish soon!NIKE (NKE) Elliott Wave Analysis – Potential Final Leg of Correction Before Reversal
This chart presents a detailed Elliott Wave analysis on the weekly timeframe for Nike (NKE).
The corrective structure is labeled as an A-B-C pattern, with the current move considered a possible Wave 4 nearing completion.

Nike - A buy after pullbackNike's daily chart shows a competed five-wave advance off the lows from 52.28, with a subsequent correction underway. We believe that we are in wave C of this correction which could take prices back to 68-66 levels before another move higher unfolds towards 100.00

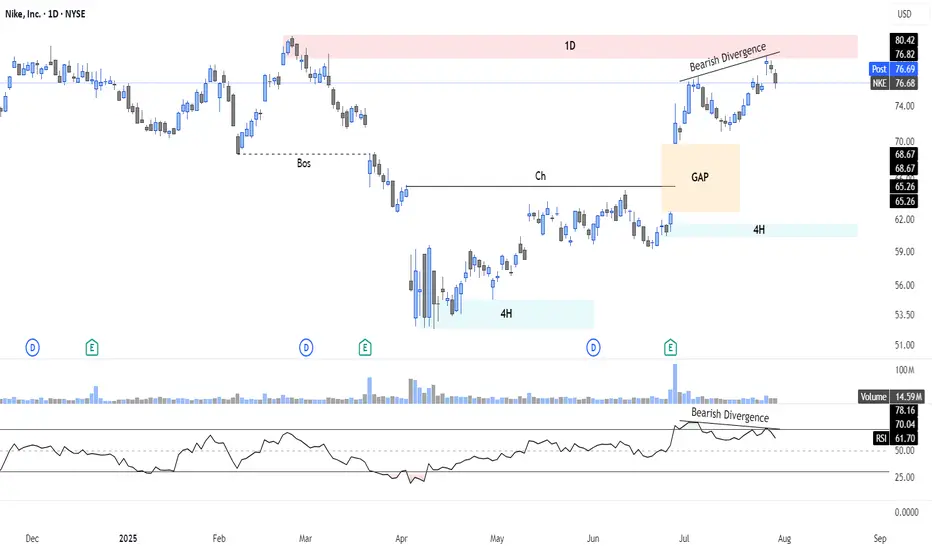
Bearish Setup on Nike ($NKE): Divergence + Supply Rejection📉 I'm watching a high-probability bearish setup on NYSE:NKE , with price rejecting a key 1D supply zone ($77–80) on bearish RSI divergence and fading momentum. A downside gap below adds further confluence.
📊 Technical Context:
Clear 1D supply rejection with divergence
Lower RSI highs vs higher price highs = Bearish divergence
Volume weakening near resistance
Open gap ($65–$68.67) below = magnetic target
Previous BOS indicates potential for continuation move lower
🎯 Strategy Ideas:
Bear Call Spread 80/85 (credit spread with resistance overhead)
Put Debit Spread 75/65 (targeting full gap fill)
⏳ Expiry: Sep 20 – well-timed before IV builds
📌 Setup offers attractive R/R with clearly defined invalidation above $81
🔔 Key Alerts:
$81: "Invalidation – bias flips if breakout confirmed"
$68.67: "Gap close in progress – partial target zone"
➡️ Follow for structured trade setups combining price action, divergence, and options strategies.
NIKE Confirms A Bullish Reversal With An Impulsive RecoveryWe talked about Nike on July 10 with our members, where we mentioned and highlighted a completed higher degree ABC correction in wave IV on the monthly and weekly charts.
Today we want to represent a closer view, as we see a five-wave impulsive recovery away from the lows on a daily chart. It actually confirms the bottom and bullish reversal, but since it can be trading in 5th wave that can stop around 80-85 area, we should be aware of a three-wave corrective setback soon. It can slow down the price back to the open GAP, so ideal buy zone is in the 70-60 area. Invalidation level is at 52.
Highlights:
Direction: Up, but watch out for a correction
Structure: Impulse, Wave 5 in final stages
Support: 70 / 60

NKE: 79.24BULLISH ENTRIES 80.00/80.20 Target 81.00 Stop 79.00 BEARISH ENTRIES 78.00/77.80 Target 77.00 Stop 79.10

Nike - This is the bottom!💉Nike ( NYSE:NKE ) creates the bottom now:
🔎Analysis summary:
More than four years ago, Nike created its previous all time high. We have been witnessing a downtrend ever since and a correction of about -70%. But with the recent retest of an important horizontal structure and bullish confirmation, Nike is about to create a potential bottom.
📝Levels to watch:
$65, $80
🙏🏻#LONGTERMVISION
Philip - Swing Trader

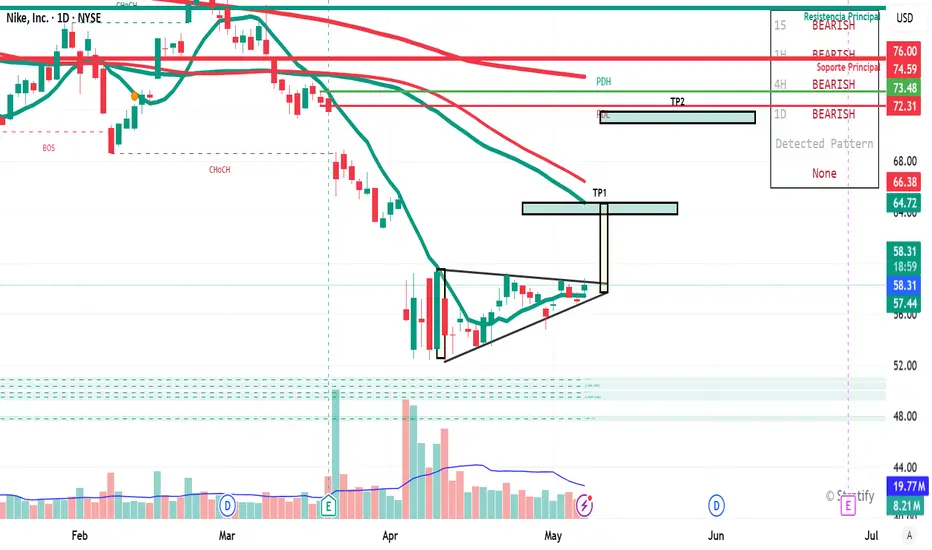
Possible Scenarios for Nike🔺 Pattern:
An ascending triangle is forming, which is a bullish technical pattern if it breaks out with volume above the resistance level.
The TP1 (Take Profit 1) marked in the $64.72–$66.38 USD zone is logical and aligns with previous resistance levels.
🟢 Bullish Signals:
Imminent triangle breakout: if the price strongly surpasses the $59–$60 USD range, it confirms the pattern.
Increasing volume on previous green candles: a good sign of accumulation.
Slightly expanding Bollinger Band: may indicate the beginning of a stronger move.
EMAs are flattening, with a possible future crossover if a rally confirms.
🔴 Risks and Key Levels to Watch:
The macro trend remains bearish: several timeframes (15m, 1H, 4H, 1D) show "BEARISH" zones.
Strong resistances: around $64.72, and especially between $72.31 and $76.00 USD.
If the breakout fails and price drops below $57.43, the pattern is invalidated and price may seek support at lower levels ($52–$50).
Nike is a screaming BUY with target above 80$ in the short termSummary: In short NKE is on reversal mode to the upside and 80$ is on the horizon and 100$+ by next quarter Earnings call which is an upside over 40% NYSE:NKE
Nike (NKE): Technical Strength Above the 200 SMA 🟢
Nike (NKE): Recent Earnings Overview 🏅
Above the 200-Day Simple Moving Average (SMA) 🟩
NKE’s price is currently holding above the key 200-day simple moving average (SMA).
The 200 SMA is widely followed by investors as a long-term trend indicator.
Sitting above this level signals a bullish phase, as it often marks a shift from bearish to bullish market sentiment.
Historically, when a stock breaks and sustains above its 200 SMA after a downtrend, it attracts attention from institutional buyers and can act as a strong support area for further upside .
Key Takeaways from the Earnings Call
China Recovery 🐉
Positive business trends are emerging in greater China, supporting Nike’s international momentum.
Brand Momentum 🚀
Investments in product innovation, branding, and digital transformation remain central to growth.
Shareholder Return 💰
The continuation of share buybacks and regular dividends signals Nike’s commitment to delivering value.
How This Supports the Bullish Thesis
Momentum Confirmation:
Trading above the 200 SMA supports the idea that recent gains are not just a short-term bounce, but reflect a possible trend reversal toward sustained growth.
Institutional Buying Signal:
Many long-term investors and funds use the 200 SMA as a buy trigger, increasing the likelihood of strong follow-through buying.
Risk-Reward:
Being above the 200 SMA, with support from lower moving averages, strengthens the case for manageable downside risk and a clear technical floor.
Combined with recent Earnings, the technical breakout above the 200 SMA aligns with Nike’s solid Q4 earnings results, margin improvement, and positive guidance, all reinforcing confidence in the current rally.
Nike’s position above the 200-day simple moving average—combined with recent strong fundamentals—strengthens the bullish outlook for the stock at this key juncture..
Why This Matters for the Buy Thesis
Earnings Beat: Supports the recent surge in Nike’s stock price and adds conviction to a bullish outlook.
Margin Resilience: Operational improvements reduce risk, even in a tough retail environment.
Brand and Digital Strength: Focus on innovation and digital sales provides confidence for long-term investors.
In short NKE is on reversal mode to the upsie and 80$ is on the horizon and 100$+ by next quarter Earnings call

Break of downward sloping channel LongNike has swept liquidity and is now showing a strong bounce to the upside.
Although I didn’t manage to enter the initial long, I am monitoring for a break above the current downward-sloping channel. A clean breakout followed by a retest would provide a more reliable entry point. I’m not aiming to catch the absolute bottom—I’d rather wait for confirmation of trend reversal.
A move above the monthly level at 79.46 would be an additional sign of strength and increase conviction in the long setup.
There is still significant overhead resistance, particularly around the point of control aligned with the anchored VWAP near 92.50. That area would be my first target. However, if momentum continues, there is potential for a move towards the 122 level.

NKE Pullback-I'm Buying the DipNike (NKE) is under pressure — post-earnings volatility, macro noise, and sentiment all weighing in. But for swing traders, this looks like a textbook accumulation setup.
📌 Entry Zones I’m Targeting:
🔹 $70.00
🔹 $65.00
🔹 $60.00
Profit Targets (Taking wins before 88):
✅ $78.80
✅ $82.50
Let the market come to you — no chasing, just precision.
💬 Drop your thoughts below — are you buying NKE here or waiting for blood?
Disclaimer: This post is for informational and educational purposes only. It does not constitute financial advice or a recommendation to buy or sell any securities. Always do your own research and consult with a licensed financial advisor before making any investment decisions. Trading involves risk, and past performance is not indicative of future results

Long NKE on pull back after break?Nke just woke investors back up with their recent forecast after earnings. This push has temporarily broken the down trend on the daily time frame and it is holding the break on the weekly. We now have a healthy-looking retest with the rsi on the daily time frame above 50 signaling a bounce is coming. I mapped out some take profits. I am still a little worried about the company itself based on my own fundamental analysis. But physiologically i believe many people don't want to miss out on a brand name like Nike at such a discount, if it bounces here, I think it will be huge. Probably a short squeeze. I will not hold this trade up to next earnings though, as i said I don't really love the fundamentals. I think NKE is losing market share rapidly. Anyways sorry for the grammar but here are my thoughts, good luck. oh, and stop loss with a clear break and hold under this bounce spot, maybe 68-69?

Nike Looks Ready — A Smart Time to Consider InvestingOn the monthly chart, NIKE has been in a downtrend since November 2021, but the signs are pointing toward a potential trend reversal. Here's why I believe the bottom may already be in:
✅ MACD Histogram shows a strong positive divergence, signaling weakening bearish momentum.
✅ The RSI downtrend line has been broken and successfully retested, confirming bullish strength.
✅ A clear hammer candle has formed at a historical wide support zone, showing strong demand.
Now, price is facing three consecutive resistance levels — and with each breakout, the next zone becomes the new target, (87.5 → 102 → 122).
The structure suggests a step-by-step move higher if momentum holds. Keep an eye on the breakout above the descending trendline — that’s where things could accelerate.

NKE is a SELL here!Short term overbought, longer term nasty chart and tariff issues courtesy #donthecon because after all boys and girls "trade wars are easy to win" He hasn't won yet as he's been preoccupied ending the Ukraine war "day 1" and counting all the money Mexico sent to pay for the wall

NKE - Fallen-Angel reversal + weekly divergence - LongNKE - Nike from Smart Money divergent scanner back on the 15th of April. It's also a fallen angel pattern; it's rolled up beautifully and hitting its first target. Some small insider buying.

$NKE Tradespoon – Long Entry $76.39Tradespoon model generated long signal for NYSE:NKE . Predicted range: $76.39–$80.79. Trend: +2.78%. NYSE:NKE

Short Trade Idea: NKE (Nike Inc.)🧠
📅 Timeframe: 30-Minute
💼 Type: Short Position
📉 Setup: Symmetrical triangle + rejection at resistance
📍 Trade Details:
Entry: ~$73.39 (just below triangle break/retest)
Stop Loss: ~$74.35 (above upper resistance & failed breakout)
Target 1: $71.52 (minor support / red line)
Target 2: $69.77 (mid-zone)
Target 3: $68.39 (major horizontal support)
🔎 Technical Breakdown:
Symmetrical triangle formed near the top — often signals reversal.
Strong resistance around $74.35 (yellow + white lines).
Price failed to break higher → pulling back from upper wedge trendline.
Bearish setup with well-defined risk.
🎯 Risk/Reward:
Risk is tight (1 point), while potential reward is over 2–3x depending on target hit.
Clean structure, suitable for short-sellers.

Buying NKE now offers a margin of safetyBuying now does not mean the price will not drop further. The thing about catching bottom remains an illusion for many, a brag for some during the lunchtime talk.
I have nibbled some yesterday and will buy more if it drops further.
As usual, please DYODD

NiKE annual continuation of the trendNike, a globally recognized, enduring brand, feels almost "too big to fail." I've been monitoring the $70 price level as a potential entry point for a wick fill trade in the near future, aiming for a 100% to 200%+ ROI over 6 months to 2 years. The stock shows signs of downside exhaustion and oversold conditions. Despite recent revenue declines, market cycles and Nike’s nearly 50-year brand resilience suggest a potential rebound.

Nike hit us hard… and that needs to be said too.Nike hit us hard… and that needs to be said too.
I’m not going to sugarcoat it: we entered a PUT before earnings, and we lost. We had over 20 criteria from our “Eagle Trap” system lined up — high RSI, a sharp rally with no solid fundamentals, declining sales in China and the U.S., weak forward guidance, low volume, and too much hype on social media. Everything pointed toward a disappointment.
And yes, the earnings report was weak. Revenues dropped again, guidance was soft, and there wasn’t anything particularly positive. But still, the stock went up after hours. And honestly, I still don’t get why.
My mistake? I thought I entered with 2 PUT contracts as planned, but I accidentally entered with 4. Luckily, I had my risk control in place, or the loss would’ve been even worse.
This was a tough one, but it’s a powerful lesson. Sometimes the analysis is solid, but the market does its own thing. You won’t always win — and you’ve got to accept that.
Now it’s all about keeping a cool head. No revenge trades, no emotional decisions. This loss won’t take me down — it’ll sharpen me. The system still works, and as long as I manage my risk and stay disciplined, I’ll keep growing.
The Eagle Trap isn’t perfect — but it’s smart. And the eagle always comes back to hunt.

NKE at 52-Week Lows Oversold Giant or Value Trap?Nike is a blue-chip name going through a rough patch. But this recent dip, fueled by disappointing earnings and macro uncertainty, could present a classic oversold opportunity. The stock is now in a high-probability reversal zone where risk/reward becomes extremely attractive.
🎯 Updated Entry Plan:
$58.00 – Soft support zone; start building a position
$53.00 – Close to the 52-week low; likely strong bounce area
$50.00 – 49.00 Psychological round number and historical demand zone
📈 Target Levels
Profit
TP1: $68
TP2: $77.50
TP3: $88.50
Pro Tip: Nike doesn’t stay down forever. The brand is fundamentally strong. This is not a growth story right now, it’s a value + patience play.
📢 Disclaimer: This is not financial advice. Always do your own research, manage your risk, and never risk more than you’re willing to lose.

6/26/25 - $nke - Good luck to the longs...6/26/25 :: VROCKSTAR :: NYSE:NKE
Good luck to the longs...
- keeping it small
- but let's be real
- nke still trades dayum near 30x earnings and earnings aren't growing.
- discretionary is impossible to buy
- tariff tylk back, whaddidu think?
- they miss miss miss...
- comps not reporting good results ex. NYSE:ONON (special brand)
- so could this one be different? obviously.
- but ATM P's as a lil juice on the short side to some of my longs looks like a nice setup.
- so i'm only deploying 5 bps on this for next weeklies. it's one of those situations where if stock rips... oh well, sized appropriately. i'd say rip is 30-40% chance and likely 5-10% most and possibly a retrace
- if dips... it will be deep... and multi-day into a quarter end which could see some rebalancing flows as funds prepare for the 3Q size ups
good luck to bill ackman. smart guy. but i don't get his love of nike. better to buy NYSE:DECK , and i don't even own that one rn...
V
