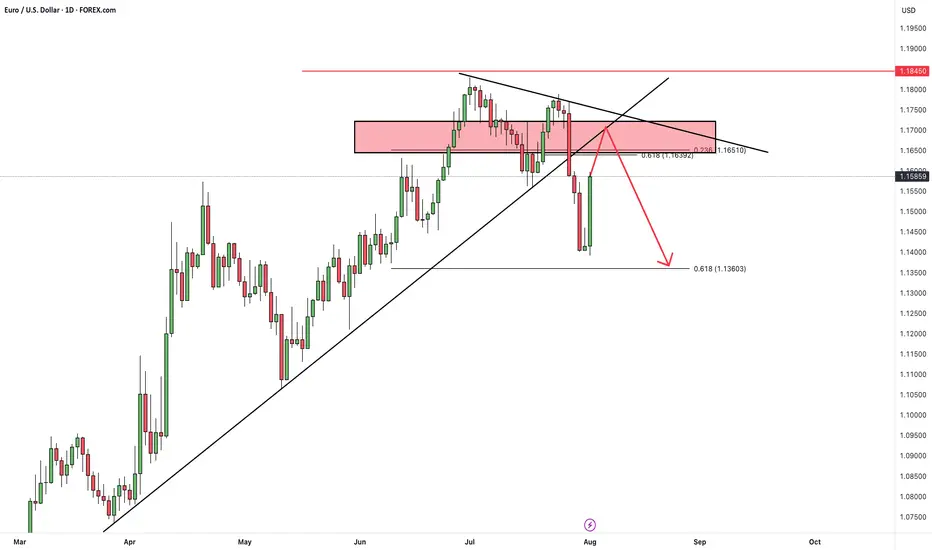
EURUSD - EURUSD – The Calm Before the SweepAfter months of climbing steadily within a rising wedge structure, EURUSD has finally broken beneath the bullish trend line that previously acted as dynamic support. This shift is significant, as it marks the first decisive violation of the bullish momentum that has carried price from the April lows into the July highs. The break occurred with strong bearish displacement, leaving behind an unfilled daily Fair Value Gap (FVG) just above the current price. This area now acts as a potential magnet for price before continuation lower.
Trend Line Retest and FVG Confluence
Price is currently hovering near 1.1570 after the trend line break. Above, we have a clean FVG on the daily chart which aligns closely with the underside of the broken trend line. A retracement into this zone would offer the ideal setup for short positioning, combining the concept of a bearish retest with inefficiency fill. From a technical perspective, this would give institutions a perfect level to engineer a lower high before continuing the move down.
Sell-Side Liquidity Objective
The major downside target sits below the swing low formed in early May. This area likely holds a large pool of resting sell-side liquidity, which would be an ideal draw for smart money before any potential reversal. If the market respects the bearish structure and rejects the FVG zone cleanly, the move toward this liquidity pocket becomes increasingly probable.
Reversal Conditions
While the short setup is currently the main focus, the area below the May low also presents a key decision point. If price sweeps that low and we begin to see bullish structure return, this could mark the beginning of a new leg up. For that to be valid, we’d need to see signs of strong buying interest, displacement, and reclaim of key short-term highs. Until then, we remain on the lookout for short opportunities into the FVG and trend line retest zone.
Execution Plan and Expectations
Traders should watch for signs of exhaustion or rejection once price enters the FVG zone. Bearish price action on lower timeframes like the 1H or 15M could confirm entry, particularly if the trend line holds as resistance. Stops can be placed above the swing high before the break, with targets below the major low around 1.10500. The reward-to-risk on this setup is favorable, but patience is needed to wait for the retrace to complete.
Conclusion
EURUSD has shifted from bullish to bearish structure after breaking the rising trend line. With an unfilled FVG above and a clean downside liquidity target, this setup offers a well-defined short opportunity. Reactions at the FVG and below the May low will dictate whether we extend lower or begin a new bullish phase. For now, all eyes are on the retrace and short continuation.
Disclosure: I am part of Trade Nation's Influencer program and receive a monthly fee for using their TradingView charts in my analysis.
___________________________________
Thanks for your support!
If you found this idea helpful or learned something new, drop a like 👍 and leave a comment, I’d love to hear your thoughts! 🚀
EURUSD trade ideas

EURUSD - Major resistance ahead with the fair value gaps!The EUR/USD pair remains firmly within a prevailing downtrend, characterized by a consistent pattern of lower highs and lower lows. This bearish momentum has resulted in the formation of several significant Fair Value Gaps (FVGs) on the 4-hour chart, which now act as potential resistance zones on any pullbacks. These FVGs not only coincide with important technical structures, but also align with key Fibonacci retracement levels, adding confluence to their strength. In the analysis below, we’ll walk through these zones and discuss the most probable scenarios based on the current price action.
First resistance zone
The first major resistance lies within the 4-hour FVG in the 1.1600 to 1.1650 region. This zone coincides with the golden pocket, which is formed between the 0.618 and 0.65 Fibonacci retracement levels. This overlap strengthens the likelihood of price reacting bearishly here, should the market manage to retrace upwards into this area. Given the strong downward momentum, this level may be enough to trigger a continuation to the downside, making it a critical area to monitor for rejection signals.
Second resistance zone
The second key resistance is found in the upper 4-hour FVG, ranging from 1.1690 to 1.1750. This zone aligns closely with the 0.786 Fibonacci retracement level and marks a former support zone that has now been broken, indicating a potential structure break. Price returning to this level would be retesting the underside of broken market structure, which often acts as a powerful resistance area. Given this, a deeper pullback into this region may serve as a trap for late buyers and potentially offer a high-probability short setup.
Bullish bounce area
On the bullish side, the most relevant support is currently found within the 1-hour FVG that was formed last Friday, during the release of the U.S. unemployment rate data. This zone is positioned below current price levels and is likely to act as a strong short-term demand area. It is reasonable to anticipate a bullish reaction from this zone if the market retraces downward, making it a favorable area to seek long opportunities for a potential move into the higher resistance levels described above.
Final thoughts
While the broader trend remains bearish, short-term bullish bounces are likely within defined fair value gaps. Traders should keep a close eye on the 1-hour FVG for possible long entries, while watching the 4-hour FVGs, particularly those aligning with key Fibonacci levels, for signs of bearish continuation. If resistance holds firm, the EUR/USD could resume its downtrend, but any structural breaks or sustained closes above these levels would challenge that view. As always, price action around these zones should guide the final decision-making.
-------------------------
Disclosure: I am part of Trade Nation's Influencer program and receive a monthly fee for using their TradingView charts in my analysis.
Thanks for your support. If you enjoyed this analysis, make sure to follow me so you don't miss the next one. And if you found it helpful, feel free to drop a like 👍 and leave a comment 💬, I’d love to hear your thoughts!

EURUSDHello Traders! 👋
What are your thoughts on EURUSD?
After last week's sharp decline, EUR/USD rebounded slightly on Friday, initiating a corrective move to the upside.
We anticipate this retracement to extend over the next few days, likely reaching the broken trendline and former support zone, which now acts as resistance.
As long as the pair remains below this resistance area, the bearish outlook remains valid.
Once the pullback is complete, we expect renewed downside pressure toward the next support levels.
💬 Is this just a corrective move before another leg down? Let us know your thoughts below! 👇
Don’t forget to like and share your thoughts in the comments! ❤️
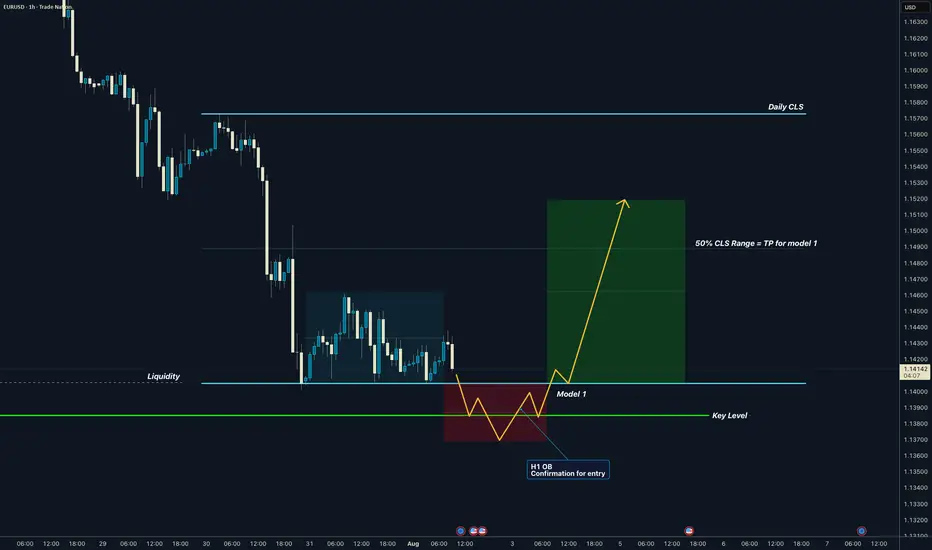
EURUSD I Daily CLS I Model 2 I Targets Full CLS rangeYo Market Warriors ⚔️
Fresh outlook drop — if you’ve been riding with me, you already know:
🎯My system is 100% mechanical. No emotions. No trend lines. No subjective guessing. Just precision, structure, and sniper entries.
🧠 What’s CLS?
It’s the real smart money. The invisible hand behind $7T/day — banks, algos, central players.
📍Model 1:
HTF bias based on the daily and weekly candles closes,
Wait for CLS candle to be created and manipulated. Switch to correct LTF and spot CIOD. Enter and target 50% of the CLS candle.
For high probability include Dealing Ranges, Weekly Profiles and CLS Timing.
Analysis done on the Tradenation Charts
Disclosure: I am part of Trade Nation's Influencer program and receive a monthly fee for using their TradingView charts in my analysis.
Trading is like a sport. If you consistently practice you can learn it.
“Adapt what is useful. Reject whats useless and add whats is specifically yours.”
David Perk aka Dave FX Hunter
💬 Don't hesitate to ask any questions or share your opinions

EURUSDHello Traders! 👋
What are your thoughts on EURUSD?
EUR/USD is trading below a key resistance area and has recently completed a pullback to the broken trendline.
As long as the pair remains under this resistance, we expect some short-term consolidation, followed by a renewed bearish move toward lower levels.
The bearish outlook remains valid while price stays below the resistance zone.
A clean break above this level would invalidate the bearish scenario.
Will EUR/USD resume its decline, or break through resistance? Share your view below! 👇
Don’t forget to like and share your thoughts in the comments! ❤️

EURUSD rises again amid growing Fed rate cut expectationsEURUSD rises again amid growing Fed rate cut expectations
On Friday, U.S. job data (NFP) showed an increase of just 73,000 for July—far below forecasts. This weak result suggests deeper problems in the labor market.
Many financial institutions now expect the Federal Reserve to cut interest rates in September. Markets are pricing in over 63 basis points of rate cuts by the end of the year.
Adding to uncertainty, President Donald Trump dismissed Bureau of Labor Statistics Commissioner Erika McEntarfer on Friday, accusing her of manipulating job data.
Investors are also concerned about the impact of Trump’s new tariffs, which could slow economic growth and push inflation higher.
Technical Analysis:
From a technical perspective, EURUSD broke below the neckline of a double top pattern, confirming the bearish setup.
The price hit the first downside target before bouncing back, likely driven by speculation around the NFP report.
Looking ahead, there's a strong chance EURUSD could begin another downward move from this zone, as suggested by our earlier chart analysis.
You may find more details in the chart!
Thank you and Good Luck!
PS: Please support with a like or comment if you find this analysis useful for your trading day
Disclosure: I am part of Trade Nation's Influencer program and receive a monthly fee for using their TradingView charts in my analysis.

EURUSD Potential UpsidesHey Traders, in today's trading session we are monitoring EURUSD fora buying opportunity around 1.15800 zone, EURUSD is trading in an uptrend and currently is in a correction phase in which it is approaching the trend at 1.15800 support and resistance area.
Trade safe, Joe.

EURUSD: Time For PullbackThe 📉EURUSD pair reacted significantly to the highlighted intraday resistance zone following the market's opening on Monday.
After testing this blue structure, the market began to consolidate, creating a horizontal trading range on the hourly chart.
A bearish breakout below its support level signals a strong downward trend, suggesting a potential pullback from the resistance level, with a target of 1.1473.

EURUSD: Eu Looking to Make Gains Vs Weakened USDWelcome back to the Weekly Forex Forecast for the week of Aug 4 - 8th.
In this video, we will analyze the following FX market:
EURUSD
The USD pushed higher on keeping it's interest rate unchanged, but gave back those gains on weak job numbers. This allowed the EU to recover some of the previous weeks losses and show some resiliency.
Now analyst are betting there is a 66% chance for rate cuts in Sept by the Fed. This is negative for the USD, allowing the EURO to move higher.
It is worth mentioning, the EU inked a highly criticized tariff deal with the US, which was not at all positive for the currency.
The market is at a pivotal area that could go either way. Wait for a definitive break of structure before committing to a bias.
Enjoy!
May profits be upon you.
Leave any questions or comments in the comment section.
I appreciate any feedback from my viewers!
Like and/or subscribe if you want more accurate analysis.
Thank you so much!
Disclaimer:
I do not provide personal investment advice and I am not a qualified licensed investment advisor.
All information found here, including any ideas, opinions, views, predictions, forecasts, commentaries, suggestions, expressed or implied herein, are for informational, entertainment or educational purposes only and should not be construed as personal investment advice. While the information provided is believed to be accurate, it may include errors or inaccuracies.
I will not and cannot be held liable for any actions you take as a result of anything you read here.
Conduct your own due diligence, or consult a licensed financial advisor or broker before making any and all investment decisions. Any investments, trades, speculations, or decisions made on the basis of any information found on this channel, expressed or implied herein, are committed at your own risk, financial or otherwise.

EURUSD Short-Term Bullish Momentum - Buy ? Hello everyone, what do you think about EURUSD?
Yesterday, we discussed the sideways movement of this pair, and now, it seems that EUR/USD is showing a short-term bullish trend. The price is currently moving around 1.165, as marked on the chart.
In the short term, the market appears ready for further upward movement. With support at multiple levels (Support 1 and Support 2), and the possibility of forming a Support 3 to reach the target of 1.177, the overall outlook remains optimistic.
Keep an eye on how the market reacts at these important levels! Don’t forget to like if you agree with my view!
Good luck!

EURUSD – Which Way Will It Break?Hello everyone, what are your thoughts on the EURUSD trend?
EURUSD is currently experiencing a Bollinger Bands squeeze, signaling a potential breakout in either direction. The price is trading near the lower limit, hovering around 1.157 , with two potential scenarios unfolding:
Bullish scenario: The price could break upward toward 1.172, testing the upper resistance zone.
Bearish scenario: If the price falls below the lower limit, it could head towards the sell target at 1.140.
💬 For me, I’m leaning toward FOMO (Fear of Missing Out) and following the sell trend with a target of 1.140. What about you? Let me know your thoughts in the comments below!

Major U.S. News Ahead—Will EURUSD Pivot?Good morning, my friends 👋
Here’s my EURUSD market analysis 📉
Currently, the pair is in a downtrend. I expect this downward move to end around 1.14899 or 1.14536, where a potential buying opportunity may emerge. I personally plan to enter a buy position once price reaches those zones 💼
Also, keep an eye on major U.S. economic reports being released today—they could trigger increased volatility 🔔
Every like you send is a huge source of motivation for me to keep sharing high-quality analysis 🙏 Thanks to everyone supporting the channel 💙

EURUSD BUY SETUPThe price will form a head and shoulders pattern because the candle in the second shoulder is very strong, which indicates that it will break the neck of the pattern. We also have a stronger bounce from below, so I expect an uptrend.
EURUSD BreakthroughBuy Setup on FOREXCOM:EURUSD , EURUSD team bullish are so aggressive, so im expecting a very big gain on EURO against the weakens dollar.

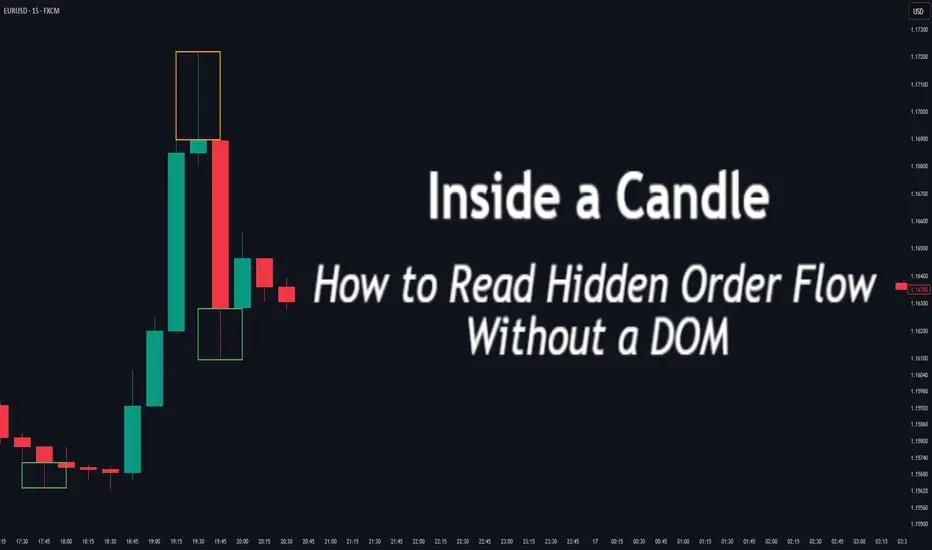
Inside a Candle: How to Read Hidden Order Flow Without a DOM
Difficulty: 🐳🐳🐳🐋🐋 (Intermediate+)
This article is for traders who want to understand the “story” behind a candle’s shape — and learn to spot aggressive buying/selling, absorption, and traps without needing footprint or order book tools.
🔵 INTRODUCTION
Most traders see candles as static shapes — green or red, big or small. But each candle is a battlefield of orders . Even without access to a DOM or volume footprint, you can still extract valuable information from just the candle's body, wick, and context .
🔵 ORIGINS: WHERE CANDLESTICKS COME FROM
Candlestick charts trace back to 18th-century Japan, where rice traders needed a way to visualize price movements over time. A legendary trader named Munehisa Homma , who traded rice futures in Osaka, is credited with developing the earliest form of candlestick analysis.
Homma discovered that price wasn’t just driven by supply and demand — but also by trader psychology . He created visual representations of market sentiment by tracking:
The opening and closing price of rice
The highest and lowest price reached during the session
This system became known as the “Sakata rules,” and it laid the foundation for many patterns still used today — such as Doji, Engulfing, and Marubozu.
Western traders only began using candlesticks widely in the 1990s, when analyst Steve Nison introduced them to the broader financial world through his book Japanese Candlestick Charting Techniques.
Today, candlesticks remain one of the most powerful and intuitive ways to visualize order flow, momentum, and market psychology — even without a Depth of Market (DOM) or depth of book.
In this article, you’ll learn how to read hidden order flow by analyzing:
Wick length and positioning
Body-to-range ratios
Candle clustering and sequences
🔵 HOW A CANDLE FORMS
Before you can read a candle, you need to understand how it comes to life . A single candle represents the full auction process during its time window.
Here’s how it builds, step by step:
Candle opens — this is the open price .
As price moves up during the session → the high] updates.
As price moves down → the low] updates.
The final traded price when the time closes → this becomes the close price .
The wick = price areas that were tested but rejected
The body = where the majority of aggressive trades occurred
If buyers push price up quickly but sellers slam it down before the close — the candle will have a long upper wick and close near the open, revealing seller absorption.
Understanding this flow helps you recognize traps, fakeouts, and reversals in real time.
🔵 CANDLE BODY: WHO'S IN CONTROL
The body of the candle reflects the result of the battle between buyers and sellers. A wide body with minimal wicks means dominance and commitment.
Big body, small wick → clear conviction
In an uptrend: buyer aggression
In a downtrend: panic or aggressive selling
Small body, long wicks → indecision, absorption, or trap
Often appears near tops/bottoms
Indicates both sides were active but neither won clearly
www.tradingview.com
🔵 WICKS: THE SHADOWS OF REJECTION
Wicks are not just “leftovers” — they show where price was rejected after being tested.
Long upper wick = seller presence or absorption at highs
Long lower wick = buyer defense or trap spring
Double wick = liquidity sweep / false breakout
Use wick direction to spot:
Failed breakouts
Smart money traps
Exhaustion candles
🔵 HIDDEN ORDER FLOW PATTERNS
1️⃣ Absorption Candle
A large wick with little movement afterward — shows that big orders absorbed market pressure.
2️⃣ Trap Candle
A candle that sweeps above/below a key high/low and closes opposite — classic smart money fakeout.
3️⃣ Imbalance Candle
Large-bodied candle that closes near the high/low with no wick on the other end — implies one-sided aggression (and often leaves an imbalance).
🔵 CLUSTERING & SEQUENCES MATTER
Never read a candle alone. The sequence of candles tells the full story:
3+ rejection wicks near resistance? Liquidity building before breakout or trap
Bearish engulfing after long upper wick = smart money selling into retail buying
Tight-range dojis + volume spike = compression before expansion
Context + volume + structure = hidden flow decoded.
🔵 PUTTING IT TOGETHER: A REAL EXAMPLE
Price breaks above previous high
Candle closes with long upper wick and smaller body
Next candle opens, dumps fast, leaving imbalance behind
Buyers trapped — move likely to continue down
This is how you read order flow from candle anatomy .
🔵 TIPS FOR MASTERY
Use a lower timeframe (1M–5M) to see microstructure
Watch how wicks behave near S/R or OBs
Confirm with volume spikes or delta-style indicators
Use replay mode to slow down the story and study cause/effect
🔵 CONCLUSION
Every candle is a message. You don’t need expensive tools to read order flow — just your eyes, context, and curiosity.
Learn to see candles not as symbols, but as evidence of behavior . Absorption, imbalance, and traps are all visible if you look closely.
EURUSD Hit entry.-In the monthly (higher timeframes), EURUSD is bullish.
-In the weekly timeframe, the was a momentous price reaction at the 1w BoS, making it a very strong area of liquidity and unlikely to be broken further in the short term period but maybe tested.
In the the daily and timeframe EU is bearish, but it is just a possible higher timeframe retracement, but still we are looking for opportunities in that retracement too.
-Above is our low probability low risk idea. We are only risking 13 Pips aiming for a 1:15+

Lingrid | EURUSD Confluence Zone: Shorting Opportunity. The price perfectly fulfilled my previous idea . FX:EURUSD is pulling back toward a confluence of resistance formed by the broken upward trendline and the descending channel boundary. Price structure suggests a lower high beneath the $1.16081 zone after a sharp sell-off from the July peak. As long as price remains below this resistance and fails to reclaim the $1.16000 level, further downside toward $1.14510 and lower remains likely. Momentum is favoring continued bearish pressure following the recent breakdown.
📉 Key Levels
Sell trigger: Rejection from $1.16000
Sell zone: $1.15800 – $1.16081
Target: $1.14510
Invalidation: Break above $1.16081
💡 Risks
A confirmed breakout above $1.16081 may invalidate the bearish setup
Momentum could stall near $1.15000 and lead to consolidation
Support at $1.14510 may attract short-term dip buyers
If this idea resonates with you or you have your own opinion, traders, hit the comments. I’m excited to read your thoughts!

EUR/USD - Bearish Outlook (05.08.2025)The EUR/USD Pair on the H4 timeframe presents a Potential Selling Opportunity due to a recent Formation of a Bearish Flag Pattern. This suggests a shift in momentum towards the downside in the coming Days.
Possible Short Trade:
Entry: Consider Entering A Short Position around Trendline Of The Pattern.
Target Levels:
1st Support – 1.1400
2nd Support – 1.1300
🎁 Please hit the like button and
🎁 Leave a comment to support for My Post !
Your likes and comments are incredibly motivating and will encourage me to share more analysis with you.
Best Regards, KABHI_TA_TRADING
Thank you.
Disclosure: I am part of Trade Nation's Influencer program and receive a monthly fee for using their TradingView charts in my analysis.

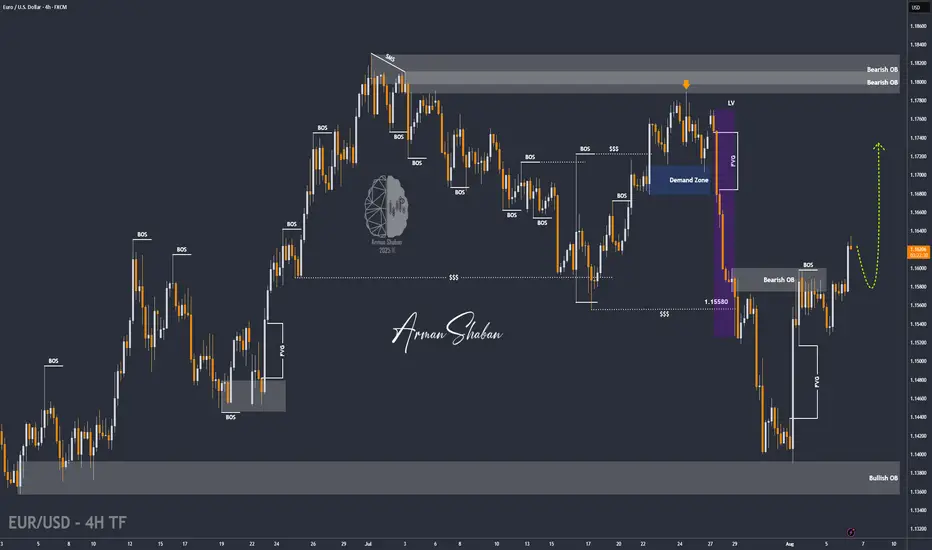
EUR/USD | Holding Above 1.16 Could Unlock More Upside! (READ IT)By analyzing the EURUSD chart on the 4-hour timeframe, we can see that the price reacted beautifully to all the marked zones on the chart. Especially after reaching the 1.14 demand area, it experienced a strong bullish move, rallying over 200 pips to hit 1.16. Currently, EURUSD is trading around 1.16220, and if it holds above the 1.16 level, we can expect further upside. The next bullish targets are 1.16435, 1.16780, 1.17100, and 1.17500.
Please support me with your likes and comments to motivate me to share more analysis with you and share your opinion about the possible trend of this chart with me !
Best Regards , Arman Shaban
EURUSD: Support & Resistance Analysis For Next Week 🇪🇺🇺🇸
Here is my latest structure analysis and important
supports & resistances for EURUSD for next week.
Consider these structures for pullback/breakout trading.
❤️Please, support my work with like, thank you!❤️
I am part of Trade Nation's Influencer program and receive a monthly fee for using their TradingView charts in my analysis.

EURUSD I Daily CLS I Model 1 I KL - OB I TP 50% CLSYo Market Warriors ⚔️
Fresh outlook drop — if you’ve been riding with me, you already know:
🎯My system is 100% mechanical. No emotions. No trend lines. No subjective guessing. Just precision, structure, and sniper entries.
🧠 What’s CLS?
It’s the real smart money. The invisible hand behind $7T/day — banks, algos, central players.
📍Model 1:
HTF bias based on the daily and weekly candles closes,
Wait for CLS candle to be created and manipulated. Switch to correct LTF and spot CIOD. Enter and target 50% of the CLS candle.
For high probability include Dealing Ranges, Weekly Profiles and CLS Timing.
Analysis done on the Tradenation Charts
Disclosure: I am part of Trade Nation's Influencer program and receive a monthly fee for using their TradingView charts in my analysis.
Trading is like a sport. If you consistently practice you can learn it.
“Adapt what is useful. Reject whats useless and add whats is specifically yours.”
David Perk aka Dave FX Hunter
💬 Don't hesitate to ask any questions or share your opinions
EURUSD at a Crossroads: The Battle at the 78.6% Fib LevelMarkets rarely move in a straight line. After a powerful rally was stopped by monthly supply, EURUSD has arrived at a critical crossroads. The higher timeframe trend is still bullish, but a potential daily downtrend is emerging. This analysis focuses on the single high-probability short setup that could define the next major move.
After the price found support at the 50% Fibonacci retracement level of the weekly structure , which coincided with the daily structure's break level, further decline was prevented by negative NFP news last Friday, which pushed the dollar index down. The long scenario from this level, which I detailed in my previous analysis " EURUSD: The Logic of Institutional Capital Unveiled ", is still active. An entry directly from that level was impossible due to the reversal occurring on highly volatile news, but it's still possible from the manipulation zone in the form of the bullish order block below.
This current analysis is a continuation of that one, but from the perspective of looking for short positions , as the price has shown its intention to first reach a zone of interest above. So, let's try to further unravel the logic and the next step of large capital.
The global uptrend of the pair was halted by a monthly supply zone , from which a correction began and subsequently reversed at the 50% weekly level. One might expect the uptrend to continue and only look for long entries. However, the fact that the price found its pivot point in a monthly supply zone and has since shown the potential genesis of a bearish daily structure allows us to consider counter-trend short trades, with fresh footprints from "smart money" to guide us.
On its continued ascent, the price will face resistance in the form of a bearish order block in conjunction with the 78.6% retracement level of the new, potentially bearish structure. Everything will depend on whether this level and order block hold and show a reversal reaction. The entry condition for a short will be the mitigation of this order block concurrently with reaching the 78.6% level, followed by price finding acceptance below it .
► Invalidation: Invalidation of the short scenario would be a break of the 78.6% level with the price finding acceptance above it.
In the case of a short setup forming and an entry being confirmed, the minimum target for the price will be the bullish daily order block below, which was formed during the liquidity sweep of the daily structure's break level.
A key global context for EURUSD to consider upon the mitigation of the daily bearish order block is the Dollar Index (DXY) . After breaking its bearish daily structure (BOS D) to the upside, it also began a correction after NFP. The target and potential reversal zone for DXY is the same as EURUSD's but a mirror image: the 78.6% Fibonacci retracement level in conjunction with a daily order block . It is highly probable that the potential setup formation on these two instruments will occur synchronously. Given their strong inverse correlation, a potential short setup on the euro pair would receive additional confirmation if a long setup forms on the Dollar Index.
~~~~~~~~~~~~~~~~~~~~~~~~~~~~~~~~~~~~~~~~~~~~~~~~~~~~~~~~~~~~~~~~~
The principles and conditions for forming the manipulation zones I show in this trade idea are detailed in my educational publication, which was chosen by TradingView for the "Editor's Picks" category and received a huge amount of positive feedback from this insightful trading community. To better understand the logic I've used here and the general principles of price movement in most markets from the perspective of institutional capital, I highly recommend checking out this guide if you haven't already. 👇
P.S. This is not a prediction of the exact price direction. It is a description of high-probability setup that become valid only if specific conditions are met when the price reaches the marked POI. If the conditions are not met, the setup are invalid. No setup has a 100% success rate, so if you decide to use this trade idea, always apply a stop-loss and proper risk management. Trade smart.
~~~~~~~~~~~~~~~~~~~~~~~~~~~~~~~~~~~~~~~~~~~~~~~~~~~~~~~~~~~~~~~~~
If you found this analysis helpful, support it with a Boost! 🚀
Have a question or your own view on this idea? Share it in the comments. 💬
► Follow me on TradingView for timely updates on THIS idea (entry, targets & live trade management) and not to miss my next detailed breakdown.
~~~~~~~~~~~~~~~~~~~~~~~~~~~~~~~~~~~~~~~~~~~~~~~~~~~~~~~~~~~~~~~~~

EURUSD - NEW BREAKOUT!Hello Traders!
The EURUSD price formed a rectangle pattern.
At the moment, the resistance level (1.15971 - 1.15830) is broken!
So, I expect a bullish move🚀
__________
TARGET: 1.17390🎯
