EURUSD - Bullish outlook heading into next week!Introduction
The EURUSD experienced a strong surge last Friday, largely driven by Jerome Powell’s speech, which added significant momentum to the market. This impulsive move to the upside successfully filled both the bearish 4-hour and 1-hour Fair Value Gaps (FVGs). The candle that formed was notably strong and bullish, and because of its size and strength, it is highly probable that we will see at least a 50% retracement of this candle before price continues to push higher. Such a retracement would allow the market to gather liquidity and prepare for another bullish leg.
Liquidity Sweep
Before this sharp rally, the EURUSD executed a liquidity sweep at the recent lows, clearing out stop losses and inducing sellers into the market. This is a classic move often seen before a strong reversal to the upside. Following this sweep, price accelerated with an aggressive bullish candle. My expectation now is for the market to retrace into this candle, ideally retracing deeply enough to provide a high-probability entry for continuation to the upside. This liquidity sweep sets the stage for a bullish scenario, as it suggests that smart money has already accumulated positions at discounted levels.
Resistance
As price surged higher, it tapped into a key area of resistance, which aligns with both the 1-hour and 4-hour FVGs. This confluence of timeframes strengthens the validity of the resistance zone and explains why price has reacted from this level. I anticipate that breaking through this resistance will require additional momentum, which may not occur immediately. Instead, we could see a short-term pullback or cooldown that allows the market to gather strength before attempting to push through this supply zone. This resistance area will therefore act as a decisive battleground for buyers and sellers.
Bullish Support
The strong bullish candle formed during the rally now serves as a new area of support. I expect price to respect the 50% retracement level of this candle, which lies around 1.166. This midpoint often acts as a significant level in technical analysis, and holding above it would confirm bullish continuation. As long as price remains above this zone, the momentum remains to the upside, and the probability of another move higher increases. This makes the retracement into this level a potential buying opportunity.
Inversion
Another important factor to consider is the inversion of the 4-hour FVG. On the previous drop, the EURUSD created a bearish 4-hour FVG, which initially acted as resistance. However, with the latest bullish impulse, this same zone has now flipped into an inversion FVG, transforming from a bearish area into a bullish support. This inversion highlights a significant shift in market structure and suggests that bulls are taking control of the price action. This level will be crucial to watch, as holding above it strengthens the case for further upside.
Final Thoughts
In summary, the EURUSD is showing strong bullish potential following the liquidity sweep and the aggressive rally sparked by Powell’s speech. While the market has reached a significant resistance area marked by the 1-hour and 4-hour FVGs, a retracement into the 50% level of the bullish candle would be healthy and provide a potential entry point for buyers. With the inversion of the previous bearish FVG into bullish support, the technical picture favors the upside as long as key support levels are respected. The coming sessions will reveal whether the market has the strength to break through resistance and continue its upward trajectory.
EURUSD trade ideas

EURUSDHello Traders! 👋
What are your thoughts on EURUSD?
The EUR/USD pair has been ranging between key support and resistance zones since last week. At present, price is sitting right on a critical support level, as the market appears to be waiting for Fed Chair Jerome Powell's speech at Jackson Hole tomorrow.
Our broader outlook remains bearish, but a clear break below support is needed to confirm downside continuation.
If support breaks, the pair could head toward lower targets in the coming sessions.
Avoid early short positions while price is still holding above support.
Wait for a confirmed breakdown of the support level to validate the bearish scenario.
Don’t forget to like and share your thoughts in the comments! ❤️

EURUSD - Stuck in Consolidation With Downside Bias[EURUSD has been trading inside a clear consolidation zone after an extended move higher, respecting both the upper and lower boundaries of the channel structure. Price action remains trapped within this range, with liquidity already taken from the upside during the recent sweep.
Consolidation Dynamics
The pair is currently caught in a sideways structure, compressing between resistance above and support below. We already had a perfect retest inside the fair value gap, and the reaction suggests that momentum is leaning toward the downside. Until price decisively breaks the channel, traders should treat this as a range-bound environment with strong respect for key levels.
Bearish Scenarios
Given that the liquidity grab on the upside of the range has already occurred, the likelihood of a downward move has increased. From here, price could drop directly from the current level to retest the channel line and the demand zone below. This would confirm the idea that buyers are struggling to push beyond the consolidation ceiling.
Alternative Bullish Path
It is still possible that price makes one more push higher into the red supply zone before reversing. If this happens, the move would likely serve as a final inducement before sellers step in, driving price back down into the bottom side of the channel where support and liquidity rest.
Price Targets and Expectations
In both scenarios, the lower boundary of the channel remains the key target area to watch. A clean retest of this level would align with previous reactions and could offer another potential base for continuation higher in the broader trend. Until then, the immediate expectation favors a move toward the downside.
Conclusion
EURUSD is consolidating with signs of weakness after the sweep of the highs, making a retracement toward the lower channel line the most probable outcome. Whether price drops directly from here or first taps into the red supply zone, the downside appears to be the more likely path in the short term.
Disclosure: I am part of Trade Nation's Influencer program and receive a monthly fee for using their TradingView charts in my analysis.
___________________________________
Thanks for your support!
If you found this idea helpful or learned something new, drop a like 👍 and leave a comment, I’d love to hear your thoughts! 🚀

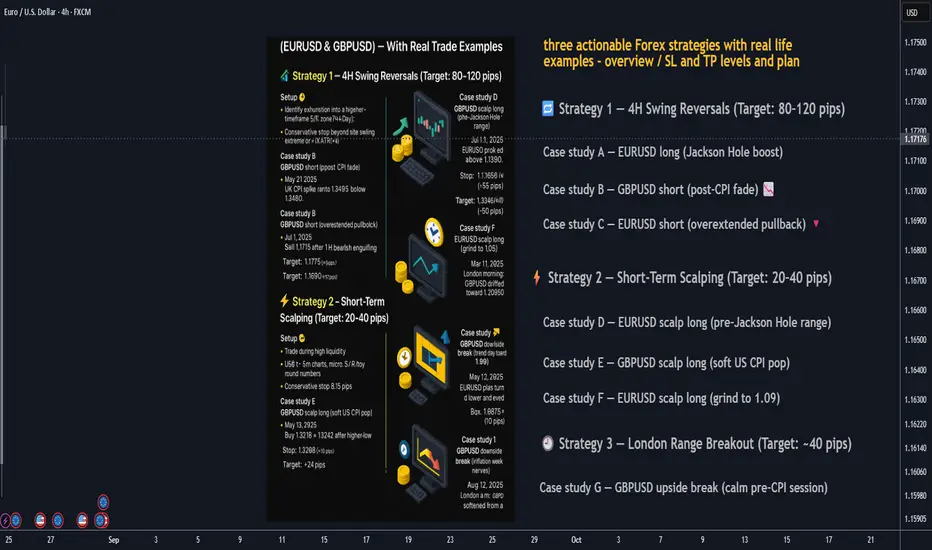
3 Actionable FX Strategies — With Real Trade Examples👋 Below are three practical strategies you can plug into your playbook today:
1. swing reversals (80+ pips), 2) short-term scalps (20–40 pips), and 3) the London range breakout (≈40 pips). Each section includes rules of engagement, risk management, and three real-market case studies on EURUSD and GBPUSD with conservative stops.
________________________________________
🔁 Strategy 1 — 4H Swing Reversals (Target: 80–120 pips)
Setup 🧩
• Identify exhaustion into a higher-timeframe S/R zone (4H/Day).
• Look for a reversal signal (engulfing/pin bar, momentum shift, or divergence) and a confirmation close.
• Conservative stop: beyond the swing extreme or ~1× ATR(14) on the entry timeframe.
• Take-profit: next HTF level or ≥ 1.8R, aiming for 80+ pips.
Case study A — EURUSD long (Jackson Hole boost) 📈
• When: Aug 22, 2025, NY session after Powell; EURUSD pushed above 1.1700 on broad USD weakness.
• Plan: After a 4H close back above 1.1700, buy a retest ~1.1705.
• Stop: 1.1650 (≈55 pips).
• Target: 1.1790 (≈85 pips).
Case study B — GBPUSD short (post-CPI fade) 📉
• When: May 21, 2025, UK CPI spike ran to 1.34695 then faded.
• Plan: After a 15–30m lower high below 1.3460, sell break of 1.3435.
• Stop: 1.3490 (≈55 pips).
• Target: 1.3345 (≈90 pips).
Case study C — EURUSD short (overextended pullback) 🔻
• When: Jul 1, 2025, EURUSD briefly poked above 1.1800 then eased.
• Plan: Sell 1.1775 after a 1H bearish engulfing.
• Stop: 1.1825 (≈50 pips).
• Target: 1.1690 (≈85 pips).
________________________________________
⚡ Strategy 2 — Short-Term Scalping (Target: 20–40 pips)
Setup 🧩
• Trade during high liquidity (London open or London/NY overlap).
• Use 1–5m charts: micro S/R + round numbers, quick momentum bursts.
• Conservative stop: 8–15 pips (just beyond the micro structure).
• Take-profit: 20–40 pips or to next intraday level.
Case study D — EURUSD scalp long (pre-Jackson Hole range) ⏱️
• When: Aug 21, 2025, Europe a.m.; EURUSD near 1.1650.
• Plan: Buy break-and-retest 1.1665.
• Stop: 1.1652 (≈13 pips).
• Target: 1.1687 (≈22 pips).
Case study E — GBPUSD scalp long (soft US CPI pop) 💥
• When: May 13, 2025, post-US CPI tone lifted risk; GBPUSD ~1.3226.
• Plan: Buy 1.3218 → 1.3242 after higher-low.
• Stop: 1.3208 (≈10 pips).
• Target: +24 pips.
Case study F — EURUSD scalp long (grind to 1.09) 🚀
• When: Mar 11, 2025, London morning; EURUSD nudged to 1.0890 / kissed 1.0900.
• Plan: Buy 1.0885 on retest.
• Stop: 1.0875 (≈10 pips).
• Target: 1.0905 (≈20 pips).
________________________________________
🕘 Strategy 3 — London Range Breakout (Target: ~40 pips)
Setup 🧩
• Mark the Asian/Late-Asia range before 08:00 London.
• Trade the first clean break/close outside the box.
• Entry: stop order beyond the box high/low.
• Conservative stop: opposite side of the box or box size + buffer (≤40–50 pips).
• Take-profit: ~40 pips (scale at 20 pips).
Case study G — GBPUSD upside break (calm pre-CPI session) 📦➡️📈
• When: Mar 25, 2025, London a.m.; GBPUSD drifted toward 1.2950.
• Box: 05:00–08:00 London ~22 pips.
• Plan: Buy box high +3 pips (≈1.2953).
• Stop: 1.2930 (≈23 pips).
• Target: 1.2993 (≈40 pips).
Case study H — EURUSD downside break (trend day toward 1.09) 📦➡️📉
• When: May 12, 2025, EURUSD bias turned lower and eyed the 1.09 handle.
• Box: 05:00–08:00 London ~28 pips.
• Plan: Sell box low −3 pips (≈1.0978).
• Stop: 1.1008 (≈30 pips).
• Target: 1.0938 (≈40 pips).
Case study I — GBPUSD downside break (inflation-week nerves) 📦➡️🔻
• When: Aug 12, 2025, London a.m.; GBPUSD softened from a two-week high.
• Box: 05:00–08:00 London ~24 pips.
• Plan: Sell box low −2 pips (≈1.3446).
• Stop: 1.3472 (≈26 pips).
• Target: 1.3406 (≈40 pips).
________________________________________
🛡️ Risk Management (applies to all three)
• Risk small per trade (e.g., 0.5–1%).
• Stops beyond structure: previous swing/box edge or ATR-based to avoid noise.
• News filter: avoid fresh entries seconds before major economic data.
________________________________________
🧰 Quick Checklists
Swing reversal (4H) ✅
🎯 Level picked • 📉 Reversal signal • 🛑 Stop beyond swing/ATR • 📐 ≥1.8R • 📰 No imminent shock
Scalp (1–5m) ✅
⏱️ Active session • 🔍 Micro S/R & round numbers • 🛑 8–15 pip stop • 🎯 20–40 pips • ✂️ Partial at +10–15
London breakout ✅
🕗 Box 05:00–08:00 • 📦 Reasonable width • 🚀 First break/close • 🛑 Stop other side • 🎯 ≈40 pips
________________________________________
⚠️ Final word
These examples show how setups map onto real market context. Adapt entries/levels to your feed and spreads. Nothing here is financial advice—test and size appropriately.
________________________________________
EURUSD: Support & Resistance Analysis For Next Week 🇪🇺🇺🇸
Here is my latest support and resistance analysis
for EURUSD for next week.
Consider these structures for pullback/breakout trading.
❤️Please, support my work with like, thank you!❤️
I am part of Trade Nation's Influencer program and receive a monthly fee for using their TradingView charts in my analysis.

EURUSD - Will the parallel channel hold?Introduction
The EURUSD is currently trading within a well-defined bullish parallel channel. While this channel suggests an overall upward trajectory, there is an important imbalance in how price has interacted with its boundaries. The upper side of the channel has relatively few touchpoints compared to the lower side, which has already been tested multiple times. This creates an interesting dynamic where both bullish and bearish scenarios remain in play. The pair is also trading within two significant 4-hour fair value gaps (FVGs), and the critical question now is which side will give way first, determining the next directional move.
The Parallel Channel
Within this parallel channel, price action has been leaning more heavily toward the downside, as shown by the fact that the lower boundary has been tested four times already. The upper boundary, however, has only registered a single touch, making it less validated. This imbalance implies that there is notable pressure on the downside, but at the same time, the presence of a bullish 4-hour fair value gap near the lower boundary cannot be ignored. This gap provides a potential level of support that could initiate a reversal back toward the upper side of the channel.
Potential Bullish Bounce from Support
The alignment of the lower trendline of the channel with the 4-hour bullish fair value gap creates a strong technical confluence. This support zone, located around the 1.166 – 1.165 area, could act as a springboard for buyers. If price respects this level, a bullish bounce could occur, pushing EURUSD back toward the upper region of the channel. In this scenario, the market would likely target the remaining inefficiencies left by the bearish 1-hour and 4-hour fair value gaps above, potentially leading to a liquidity grab in that zone.
Bearish Breakdown Scenario
On the other hand, if EURUSD fails to hold the support at the bullish 4-hour FVG, a bearish breakdown becomes increasingly likely. In that case, both the channel structure and the previously supportive FVG would flip into resistance, reinforcing bearish momentum. Should this play out, the pair could decline toward the next major 4-hour FVG around the 1.156 level in the near future. This would represent a meaningful breakdown of the current bullish structure, opening the door for further downside.
Conclusion
The EURUSD sits at a decisive point within its bullish channel. The key lies in whether the support confluence of the 4-hour bullish FVG and the lower trendline will hold. If it does, the pair has room to climb higher and fill inefficiencies above. If it breaks, however, a move down toward 1.156 seems likely. Traders should closely monitor these zones, as the resolution of this consolidation will determine whether EURUSD extends its bullish momentum or shifts into a deeper retracement.
-------------------------
Disclosure: I am part of Trade Nation's Influencer program and receive a monthly fee for using their TradingView charts in my analysis.
Thanks for your support. If you enjoyed this analysis, make sure to follow me so you don't miss the next one. And if you found it helpful, feel free to drop a like 👍 and leave a comment 💬, I’d love to hear your thoughts!

EURUSD is slow moving. Wait for more factors to enter orders✏️ EURUSD is trading in a consolidation range, the trend to trade at the moment is not there. Wait for clearer momentum at resistance or support zones to set up Orders. 1.154 plays an important support role at the moment of the bullish wave structure, it is the confluence point of the Trendline and the support zone of the BUY side. In the opposite direction, the resistance 1.171 plays the role of the upper boundary of the price channel.
📉 Key Levels
BUY Trigger Rejection at support1.154
BUY DCA Trigger Breakout of resistance 1.171
Leave your comments on the idea. I am happy to read your views.

EURUSD Testing 1.16650 in Descending Channel as DXY Holds 98.100Hey Traders, in today's trading session we are monitoring EURUSD for a selling opportunity around 1.16650 zone, EURUSD continues to trade inside a descending channel, with price correcting upward toward 1.16650, a key resistance zone aligned with channel structure.
At the same time, the U.S. Dollar Index (DXY) remains in an uptrend and is approaching 98.100 support. With recent inflation readings running high, markets may expect a more hawkish Federal Reserve, which could support further USD strength.
Monitoring how EURUSD reacts near 1.16650 in relation to DXY’s price behavior to gauge whether bearish momentum will resume or consolidation will continue.
Trade safe, Joe.

Buy the Dips? EURUSD Says "Yes" Above 1.161. What happened recently
After the false break of support at the end of last month, EURUSD recovered quickly. In just seven days, the pair was back above the 1.16 zone, suggesting that bulls considered this area an attractive price for buying. From there, the rally extended toward 1.17 before fading once more.
2. The reaction at support
Unlike the previous attempt, this time the 1.16 zone held firmly. Friday’s strong rebound came exactly from this level, leaving behind a clear bullish engulfing candle.
3. What’s next
Now, EURUSD is once again facing resistance. The next move from here could define the market’s direction for the next 2–3 weeks. A breakout above this level would open the door toward the key 1.20 zone, and potentially 1.22 as the next technical resistance, especially if USD sentiment continues to deteriorate.
4. Trading plan
As long as 1.16 remains intact, the broader outlook is bullish. The strategy remains the same: buying dips, preferably around 1.1650, while keeping an eye on the resistance zone for confirmation.
Disclosure: I am part of TradeNation's Influencer program and receive a monthly fee for using their TradingView charts in my analyses and educational articles.

EUR/USD: Short-Term Drop Before Recovery?Currently, EUR/USD is trading below the resistance at 1.16800 and could drop to 1.16000 if there is no recovery. The support at 1.16000 will be crucial in determining the next trend. If this support holds, the likelihood of a recovery to 1.16800 is high.
News Impact
The speech by Fed Chairman Jerome Powell could have a significant impact on monetary policy and affect the USD, increasing the chances of EUR/USD dropping. Meanwhile, peace talks between Russia and Ukraine could boost the euro if the situation improves.
Forecast
EUR/USD may experience a short-term decline, but there is still a chance for recovery if the support at 1.15998 holds.

EURUSD Breakout and Potential RetraceHey Traders, in the coming week we are monitoring EURUSD for a buying opportunity around 1.17000 zone, EURUSD was trading in a downtrend and successfully managed to break it out. Currently is in a correction phase in which it is approaching the retrace area at 1.17000 support and resistance area.
Trade safe, Joe.

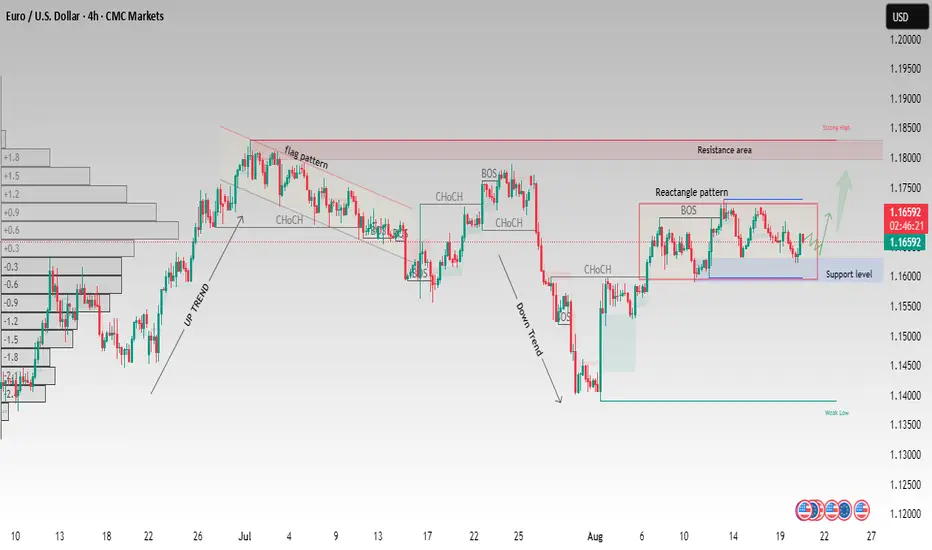
EURUSD–Rectangle Pattern Forming After Downtrend|Breakout WatchEURUSD on the 4H timeframe is currently consolidating within a Rectangle Pattern following a sharp downtrend. This structure highlights a period of market indecision where buyers and sellers are competing around key levels.
Support Level: Price is holding above the 1.1600 zone, which has been tested multiple times and is acting as a short-term demand area.
Resistance Area: On the upside, the 1.1750–1.1800 zone is the key barrier to watch, aligning with previous supply and a strong rejection zone.
Price Action: After the decline from the 1.1850 region, the market entered a sideways phase, showing repeated Change of Character (ChoCH) and Break of Structure (BOS) signals inside the rectangle. This indicates balanced pressure between bulls and bears.
Bullish Breakout: If buyers manage to push above 1.1750, we could see momentum targeting 1.1850 and potentially higher if the trend extends.
Bearish Rejection: Failure to break resistance may drive price back toward 1.1600, and a confirmed breakdown below this support could open the path toward the 1.1400 weak low zone.
At this stage, traders should be patient and wait for a confirmed breakout before taking directional trades. Consolidations often precede strong moves, making this area crucial for future EURUSD direction.
This analysis is for educational purposes only and does not constitute financial advice. Always manage risk properly and follow your own trading plan
EURUSD is forming a correction before rising to 1.1779EURUSD looks quite positive, especially against the backdrop of a weakening dollar index. The approaching phase of interest rate cuts in the US may support the EURUSD exchange rate
Price in consolidation (trading range) 1.173 - 1.159. A false breakout of resistance may not lead to a reversal, but rather to a slight correction before further growth.
If, after a false breakdown of 1.1663, the price returns to resistance, the chances of continued growth to 1.779 will increase.

EURO Breakout Alert- Long Setup In Play EUR/USD is currently trading around 1.1660, showing strong bullish momentum after holding key support levels. The pair is forming higher lows, indicating sustained buying pressure. If price action maintains above 1.1650, the next upside target is 1.1700, with a potential extension towards 1.1730. Euro strength is driven by positive market sentiment and weakness in the dollar index. Watch for a clean breakout above 1.1675 for confirmation of further upside. Ideal buy entry remains around 1.1660 with stop loss below 1.1640. Short-term trend remains bullish as long as the pair stays above 1.1640.

EURUSD Continues to Follow an Uptrend ChannelHello, what do you think about FX:EURUSD ?
EURUSD is still trading within an ascending channel. Although the price has adjusted below the trendline, the uptrend channel remains intact.
Currently, the price is hovering around 1.160, which is our target for yesterday's correction. With the current market conditions, keep an eye on the lower limit of the channel to look for trading opportunities. As long as the channel holds, the long-term outlook for EURUSD remains bullish.
Do you agree with this view? Feel free to share your thoughts in the comments below.
Good luck with your trading!

Lingrid | EURUSD Major Trendline Breakout. Monthly High RetestFX:EURUSD is bouncing off the higher low after reclaiming the key upward trendline. The structure shows a trendline breakout move with price consolidating above support. As long as 1.1650 holds, buyers could push toward the 1.1832 zone - previous month high. The broader setup suggests momentum is shifting bullish within the ascending channel.
📉 Key Levels
Buy trigger: Rebound from 1.1660 support
Buy zone: 1.1650 – 1.1700
Target: 1.1832
Invalidation: Close below 1.1650
💡 Risks
Failure to sustain above the upward trendline may trigger renewed selling.
Macro data surprises from the US or EU could shift short-term sentiment.
Stronger USD recovery across majors may cap upside momentum.
If this idea resonates with you or you have your own opinion, traders, hit the comments. I’m excited to read your thoughts!

Buy idea!Hello all. as you see price reaches to a Special zone and it is ready market to go up. it is kinda risky and open a trade if your method confirm it. anyway, I entered. lets see what God has destined for us. be happy(wink)

EURUSD: Strong Bullish OutlookMarket Context:
EU and the US outline next steps on tariffs: If the EU and the US reach an agreement and ease trade tensions, EURUSD may rise due to the strengthening of the EUR.
Germany's Flash PMI increased (49.9 vs 48.8 forecast), showing strength in the eurozone economy, which supports the EUR and pushes EURUSD higher.
Technical Analysis:
EURUSD is currently trading around 1.15900, with strong resistance at 1.17800 and immediate support at 1.15400. The bullish trend continues, confirmed by EMA indicators showing strong momentum.
Trading Strategy:
With the improved PMI data and positive trade forecasts, the outlook for EURUSD is bullish. Traders may look to buy EURUSD when the price pulls back to 1.15400, targeting 1.16700.
Monitor support at 1.15400. If broken, EURUSD could correct towards 1.15000. Use a stop-loss below this support level.
What are your thoughts on this trend?

EUR/USD Sell Setup (6H Chart)💎MJTrading
📸 Viewing Tip:
🛠️ Some layout elements may shift depending on your screen size.
🔗 View the fixed high-resolution chart here:
FX:EURUSD
🔹 Bias: Bearish (continuation within descending channel)
🟢 Entry Point: 1.17100
This aligns with upper boundary of the descending channel.
Confluence with previous Lower High and resistance zone.
❌ Stop Loss (SL): 1.17424
Medium Risk Entry and Stop Loss
Above the channel resistance and recent swing high.
Other option for Stop Loss (Lower Risk): 1.18000 Allows room for minor wicks without invalidating the setup.
🎯 Take Profit (TP) Levels
✅ TP1 (RR1) → 1.16763
📈 TP2 → 1.16438
💰 TP3 - RR4→ 1.15800
💰💰 TP4 - RR10→ 1.13860
🧠 Trade Logic
Price is respecting a descending channel with clear lower highs and lower lows.
The 1.18300 level is a high-probability reversal zone due to technical confluence.
⚠️ Risk Management
Risk:Reward ratio ranges from 1:1 to 1:10, depending on TP level.
Consider scaling out at TP1 and TP2 to lock in profits while leaving a runner for TP3 and ...
Manage your risk wisely ...
#EURUSD #PriceAction #TechnicalAnalysis #Trading #MJTrading
Psychology Always Matters:

EUR/USD – Can the Bullish Momentum Hold?Hello everyone, what do you think about FX:EURUSD ?
EUR/USD surged strongly earlier, breaking out of the descending channel and forming a new high. However, strong demand for the US dollar made buyers cautious on Monday, causing the pair to give up most of Friday’s Powell-driven gains.
On the chart, after the sharp rally, sellers immediately stepped in, pushing the pair back to previous lows and filling the FVG. Currently, the price is hovering around the final short-term support zone – the very base that fueled the prior breakout. If this support holds, we may once again consider opportunities above the 1.173 level.
Do you think EUR/USD can maintain its bullish momentum? Leave your thoughts in the comments!

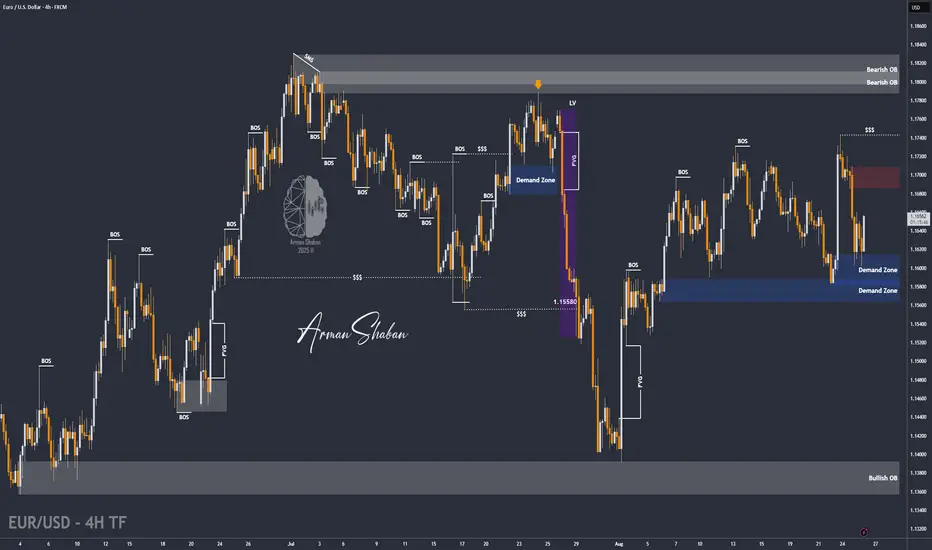
EUR/USD | EUR/USD Holding 1.16 – Eyes on 1.17 Next! (READ)By analyzing the EUR/USD chart on the 4-hour timeframe, we can see that the price is currently trading around 1.165 and has so far managed to hold above the 1.16 support zone. Based on the current trend and momentum, I expect a potential bullish move toward higher levels, with targets above 1.17.
All the key supply and demand zones are marked on the chart, so keep a close eye on the price reaction around these critical levels!
Please support me with your likes and comments to motivate me to share more analysis with you and share your opinion about the possible trend of this chart with me !
Best Regards , Arman Shaban
EUR/USD: Breakout or Breakdown?Amid recent news, EUR/USD has shown notable volatility. Today, the pair edged lower around 1.1700 on profit-taking, despite strong expectations that the Fed may cut interest rates in September, which continues to weigh on the USD’s momentum. Yesterday, EUR/USD retreated after testing resistance at 1.1730, with RSI signals highlighting growing selling pressure at this level.
Earlier, Fed Chair Jerome Powell’s speech at Jackson Hole weakened the USD, fueling a strong rebound in EUR/USD from lows of 1.1583 to above 1.1700.
Currently, the pair is consolidating within a horizontal range, with 1.1740 acting as immediate resistance. Short-term EMAs still support a mild bullish bias, showing buyers remain in control. However, if price breaks below the EMA zone, the technical structure could swiftly shift to bearish, raising the risk of a deeper pullback.

EURUSD Buyers In Panic! SELL!
My dear friends,
My technical analysis for EURUSD is below:
The market is trading on 1.1720 pivot level.
Bias - Bearish
Technical Indicators: Both Super Trend & Pivot HL indicate a highly probable Bearish continuation.
Target - 1.1674
About Used Indicators:
A pivot point is a technical analysis indicator, or calculations, used to determine the overall trend of the market over different time frames.
Disclosure: I am part of Trade Nation's Influencer program and receive a monthly fee for using their TradingView charts in my analysis.
———————————
WISH YOU ALL LUCK
