EUR/USD Resistance Test as USD Tests SupportEUR/USD bears haven't been able to re-take control since the jarring pullback after the August 1st NFP report. But, that said, there may be more attractive areas to look for that USD-weakness to continue, such as GBP/USD.
While Trump is pushing hard for rate cuts in the U.S. and markets are highly expecting that in September with at least one and perhaps two more by the end of the year, the USD continues to hold higher-lows from July, with a big spot of support currently in-play. And in the mirror image of that move, we have lower-low and lower-high structure that remains in-play on EUR/USD daily. Shorter-term we have seen bulls continue to chew back parts of that prior sell-off, with short-term resistance-turned-support at the 1.1593 level, followed by a venture back up to the 1.1686 level. Now bulls are driving above that, extending the short-term bounce, and this exposes two key levels in the pair.
At 1.1788 we have the lower-high from mid-July. This is the level that sellers would need to hold to retain that bearish structure that had built last month. And below that, we have the 78.6% Fibonacci retracement at 1.1748, which is confluent with a bearish trendline taken from those lower-highs as we move towards later this week or early next week.
If we are going to see continued breakdown in the USD, we're probably going to need to see the Euro onload some strength as it's a 57.6% weighting in the DXY basket. But, in that scenario, I still think Cable (GBP/USD) could be a more attractive venue for that theme. - js
EURUSD trade ideas

Will Fibre's change of character hold?EURUSD has shown earliest signs of what seems like a change in the trend, shorting from the current price would be much cheaper!!

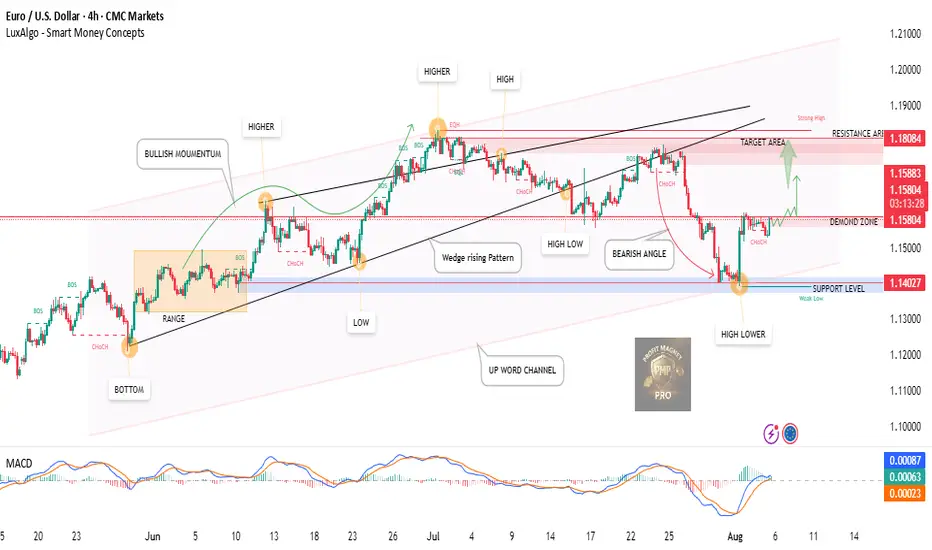
EUR/USD Bullish Breakout 4H 5Aug2025 | Targeting 1.18084EUR/USD has shown clear bullish momentum after bouncing off the support level at 1.14027, marking a higher low within a confirmed demand zone.
Key confirmations:
✅ CHoCH (Change of Character) confirms reversal.
✅ MACD crossover indicating bullish pressure.
✅ Breakout expected towards the target area (1.18084).
✅ Support from wedge breakout & upward channel.
📈 Eyeing a push to retest strong resistance near the previous high.
Plan:
Watch for consolidation or retest near 1.1580–1.1600 before entry. Bullish continuation likely if price holds above the demand zone.
📌 Target: 1.18084
🛑 Invalidation below: 1.14027
🕵️♂️ Monitor price action near demand zone and wait for bullish confirmation candle for optimal entry
EURUSD 4H Golden Cross kickstarting the next bullish phase.The EURUSD pair just formed its first 4H Golden Cross since May 29. Similar to that formation, this is taking place as the new Bullish Leg of the 4-month Channel Up has already started, following a bottom rebound near its 1D MA100 (red trend-line).
In similar fashion as that sequence, we expect it to reach at least the 1.1 Fibonacci extension on the short-term, which sits at 1.18750. If you're looking for an even higher extension, a +5.11% rise at 1.19700 is possible (also based on he previous Bullish Leg).
-------------------------------------------------------------------------------
** Please LIKE 👍, FOLLOW ✅, SHARE 🙌 and COMMENT ✍ if you enjoy this idea! Also share your ideas and charts in the comments section below! This is best way to keep it relevant, support us, keep the content here free and allow the idea to reach as many people as possible. **
-------------------------------------------------------------------------------
Disclosure: I am part of Trade Nation's Influencer program and receive a monthly fee for using their TradingView charts in my analysis.
💸💸💸💸💸💸
👇 👇 👇 👇 👇 👇

EURUSD - 15/8/25 - sell limitAfter a few days of taking a break from trade ideas.
EURUSD is inching upwards but due to the break of structure BoS shown in the chart, and the dollar showing strength- reversal.
I have placed a sell limit on the 4 hours chart to ride the price down potentially.
+ve:
1. huge imbalance below drawing in price.
2. BoS to the bearish side
3. DXY confirmation of strength suggesting EUR weakness
-ve:
1. its a friday that i am placing this sell limit and fridays are very erratic days for trading.
2. i have not seen a confirmation yet for a reversal

EUR/USD – 1H | Liquidity Resting at Both EndsPrice is hovering around key levels with liquidity stacked above and below. The next reaction will set the tone.
📈 **Bullish Scenario**
* Hold above **1.1660 P1D Low**
* Push toward **1.1689 Swing High**
* Breakout could extend into **1.1710 P1D High → 1.1730 Equal Highs** 🚀
📉 **Bearish Scenario**
* Failure at P1D Low retest
* Drop into **1.1640 Swing Low**
* Sweep **1.1620 Equal Lows**
* Draw deeper into **1.1600 OB zone** 📊
**Key Levels**
* Swing High: 1.1689
* P1D High: 1.1710
* Equal Highs: 1.1730
* P1D Low: 1.1660
* Swing Low: 1.1640
* Equal Lows: 1.1620
* OB Zone: 1.1600
💬 Will EUR/USD reclaim highs or break down toward the OB?

EURUSD Is Bearish! Short!
Here is our detailed technical review for EURUSD.
Time Frame: 1D
Current Trend: Bearish
Sentiment: Overbought (based on 7-period RSI)
Forecast: Bearish
The market is testing a major horizontal structure 1.168.
Taking into consideration the structure & trend analysis, I believe that the market will reach 1.143 level soon.
P.S
Overbought describes a period of time where there has been a significant and consistent upward move in price over a period of time without much pullback.
Disclosure: I am part of Trade Nation's Influencer program and receive a monthly fee for using their TradingView charts in my analysis.
Like and subscribe and comment my ideas if you enjoy them!

EURUSD🔹The price has declined after hitting the important area in the 4-hour time frame
🔸It is now in the important area, which is suitable for high-risk people to sell
🔹In case of consolidation above this area, if the price returns to the demand area (blue area), it will be suitable for entering a sell transaction
🔸If there is no consolidation and confirmation by the candlestick, you can sell for lower targets
#eurusd #euros

Different scenarios in EUR/USDThere are two different scenarios for EURUSD and we can buy the euro if it corrects, otherwise we can be a seller if it breaks through important levels.

Wajani Investments; EURUSD Analysis for the days aheadMonthly, weekly and daily time frames show a bearish wedge (3 point touch) which is usually a very strong reversal signal. The two bullish candles for the past two weeks should be monitored closely as this could be a turning point to the downside looking at the size of the candles. In addition, monitor entry when the market resumes and adjust entry and may be stop loss.
Let me know your thoughts and this is FOR EDUCATIONAL PURPOSE ONLY. If you like my analysis, please like, comment and follow. Happy Trading.

EURUSD POSSIBLE PRICE MOVE - NEXT WEEKEURUSD been shooting up on THURSDAY and FRIDAY due to the bearish retracement of USD Index.
This coming trading week, the USD Index is expected to start (continuation) bullish move after finishing retracement in FVGs and ORDER BLOCKS.

EUR/USD sell ideaIf this bottom holds, I could see price going up to around 1.17 In which case, I would be looking for sell confirmation. Already scalped 1% today, not trying to over trade.

Long Trade Idea: EURUSD (Buy Setup)
Market Analysis:
• Overall Trend: Bullish, supported by a clean Break of Structure (BOS) confirming upward momentum.
• Key inducement liquidity identified
• Recent Price Action: The last bullish leg failed to clear the previous swing high and associated liquidity.
As a result, I anticipate a temporary downside move to sweep buy-side liquidity below current levels.
This pullback should create an optimal entry point for a long position, aligning with the broader bullish structure.
Trade Expectation:
Price is expected to dip lower to clear stops and liquidity before resuming the uptrend, providing a high-probability buy opportunity. Monitor for confirmation signals such as a reversal pattern or bullish divergence at lower levels.
Risk Disclaimer:
This is not financial advice. Market prices can move unpredictably due to various factors, including economic data releases, central bank speeches, interest rate decisions, geopolitical events, and policy updates.
Always trade responsibly—only risk capital you can afford to lose, and employ sound risk management strategies such as stop-loss orders and position sizing.

EURUSD, GBPUSD and DXY Analysis todayHello traders, this is a complete multiple timeframe analysis of this pair. We see could find significant trading opportunities as per analysis upon price action confirmation we may take this trade. Smash the like button if you find value in this analysis and drop a comment if you have any questions or let me know which pair to cover in my next analysis.

EUR/USD Technical Outlook – Bullish Continuation In sight
---
💶
EUR/USD has been trading in a strong upward trend for some time. Recently, the pair entered a corrective phase, but momentum within this pullback has started to fade—while counter-momentum is building.
📈 This shift in momentum signals a potential resumption of the bullish trend, with upside targets at:
• 1.18114
• 1.20350
🛑 Stop-loss: Below 1.15360, to protect against deeper corrections.
The weakening of bearish pressure combined with emerging bullish momentum makes this setup one to watch closely. If the trend resumes, these targets could be reached in the coming sessions.
---


Support zone on EURUSDEURUSD is currently in a correction after rising to 1,1730.
Using Fibonacci tools, we identified a support zone between 1,1613 and 1,1552.
Watch for a reaction in this area and a potential continuation of the bullish trend.
The target is a breakout above 1,1830!

EURUSDEURUSD needs small correction and then a push to the upside towards 1.175.
Disclosure: We are part of Trade Nation's Influencer program and receive a monthly fee for using their TradingView charts in our analysis.

EURUSD Will Go Down! Short!
Take a look at our analysis for EURUSD.
Time Frame: 1D
Current Trend: Bearish
Sentiment: Overbought (based on 7-period RSI)
Forecast: Bearish
The market is approaching a key horizontal level 1.170.
Considering the today's price action, probabilities will be high to see a movement to 1.134.
P.S
We determine oversold/overbought condition with RSI indicator.
When it drops below 30 - the market is considered to be oversold.
When it bounces above 70 - the market is considered to be overbought.
Disclosure: I am part of Trade Nation's Influencer program and receive a monthly fee for using their TradingView charts in my analysis.
Like and subscribe and comment my ideas if you enjoy them!

EURUSD: Long Trade with Entry/SL/TP
EURUSD
- Classic bullish pattern
- Our team expects retracement
SUGGESTED TRADE:
Swing Trade
Buy EURUSD
Entry - 1.1674
Stop - 1.1662
Take - 1.1698
Our Risk - 1%
Start protection of your profits from lower levels
Disclosure: I am part of Trade Nation's Influencer program and receive a monthly fee for using their TradingView charts in my analysis.
❤️ Please, support our work with like & comment! ❤️

EURUSD | Testing Support Levels Under Geopolitical PressureEURUSD Overview
The geopolitical backdrop continues to weigh on EURUSD, keeping traders cautious.
Technical Outlook:
The pair maintains a bearish bias while below 1.1684, with downside targets at 1.1627 and 1.1557.
However, a break above the pivot zone around 1.1780 would shift momentum bullish, opening the way toward 1.1882.
Pivot: 1.1684
Support: 1.1627, 1.1556, 1.1450
Resistance: 1.1751, 1.1882

EURUSD DAILY TIMEFRAME ANALYSIS
1. Current Market Context
Price is at 1.1703 (midpoint between supply above and demand below).
Momentum shows repeated rejection from higher levels, indicating bearish pressure.
Daily structure suggests a lower-high formation, keeping bearish bias intact unless a strong breakout occurs.
---
2. Key Supply Zones (Red Boxes)
1.1770 – 1.1830 (Upper Zone): Major daily supply where sellers previously dominated. If retested, expect strong bearish reaction unless broken decisively.
1.1725 – 1.1760 (Lower Zone): Minor supply. Price is close to this area now, meaning sellers could re-enter around here.
📌 Both supply zones suggest EUR/USD is capped unless bulls push above 1.1830.
---
3. Key Demand Zones (Blue Lines)
1.1610: First demand/support. If broken, confirms bearish continuation.
1.1560: Deeper support. If sellers take this out, expect stronger drop.
1.1400: Major swing low/demand base, the ultimate bearish target if momentum continues.
---
4. Possible Scenarios
✅ Bearish Continuation (Most Likely)
Price rejects current 1.1725–1.1760 supply → falls toward 1.1610 → 1.1560 → 1.1400.
Bearish structure remains valid as long as price is below 1.1830.
🔄 Bullish Reversal (Less Likely)
If buyers break 1.1830, structure shifts bullish.
Next targets would be 1.1900+ (previous highs).
---
5. Trading Outlook
Bearish bias: Sell from supply zones (1.1725–1.1830).
Targets: 1.1610 → 1.1560 → 1.1400.
Invalidation: Bullish breakout above 1.1830.
---
📉 Summary:
EUR/USD is trapped between daily supply (1.1725–1.1830) and demand (1.1610). Structure favors downside continuation, targeting 1.1560 and 1.1400, unless bulls manage a clean breakout above 1.1830.
