EURUSD – Bearish Scenario (4H / Daily Supply Rejection)Price action shows a clear daily change of character (ChoCh) to the downside, shifting overall structure bearish. Recently, EURUSD has tapped into a D1 supply zone, sweeping equal highs and rejecting strongly, confirming the supply’s strength.
🔑 Bearish Idea:
Current retracement into the H4 supply (1.1700 – 1.1730) provides an optimal shorting opportunity.
If bearish rejection holds, expect continuation to the downside targeting 1.1500 – 1.1450, with further extension possible toward 1.1400 – 1.1350.
Lower timeframe confirmation (M15/H1 rejection) can be used for refined entries.
⚠️ Invalidation:
A sustained break and close above 1.1760 would invalidate this bearish outlook and suggest further upside.
📌 Summary: Structure is bearish, D1 supply has been respected, and price is primed for a move lower. Shorts favored from 1.1700–1.1730 zone, targeting 1.1450 and beyond.
EURUSD trade ideas

WEEKLY BIAS ON EURUSD Bearish Movement this week
Reason: Thursday 14th August high has been swept by Friday candlestick but Thursday's low has not been swept leaving room for shorts into that zone. If the market decides to move as predicted it will most likely target the daily FVG. This will give perfect setup opportunities if the market decides to go for that liquidity.

EUR/USD SELLERS WILL DOMINATE THE MARKET|SHORT
Hello, Friends!
We are targeting the 1.155 level area with our short trade on EUR/USD which is based on the fact that the pair is overbought on the BB band scale and is also approaching a resistance line above thus going us a good entry option.
Disclosure: I am part of Trade Nation's Influencer program and receive a monthly fee for using their TradingView charts in my analysis.
✅LIKE AND COMMENT MY IDEAS✅

EURUSD Plan For Next week (17/08/2025)Dear Traders,
The price is currently near very important resistance levels. On the other hand, the Dollar Index is in a recovery phase. I expect the price to face selling pressure around the 1.17500 area, targeting the bottom of the channel.
Fibo Level 0.90% = 1.17500
Regards,
Alireza!

EURUSD – Eyes on the 1.177 Resistance for the Next Big MoveHello everyone, let’s talk about FX:EURUSD !
EURUSD is currently trading around 1.1660 after a steady recovery from multiple support levels, with the key support near 1.1557. The pair’s previous sharp decline started exactly at the 1.177 resistance level, making this zone a crucial reference point for traders in the coming sessions.
From a technical perspective, the market is showing short-term bullish momentum, supported by price holding above the moving averages. However, the 1.177 zone remains a strong resistance, where sellers previously regained control and triggered a significant drop.
If price climbs back into this area, it’s important to watch for potential rejection signals. A confirmed bearish reversal from 1.177 could present a great opportunity for those looking to sell.
What about you? What’s your view on EURUSD?

EURUSD: Bearish Continuation & Short Signal
EURUSD
- Classic bearish pattern
- Our team expects retracement
SUGGESTED TRADE:
Swing Trade
Sell EURUSD
Entry - 1.1706
Stop - 1.1720
Take - 1.1678
Our Risk - 1%
Start protection of your profits from lower levels
Disclosure: I am part of Trade Nation's Influencer program and receive a monthly fee for using their TradingView charts in my analysis.
❤️ Please, support our work with like & comment! ❤️

EURUSD4H**Analytical Trading Perspectives for the Upcoming Week**
In this series of analyses, we have reviewed short-term trading perspectives and market outlooks.
As can be seen, in each analysis there is a key support or resistance zone near the current price of the asset. The market’s reaction or breakout at these levels will determine the next price movement toward the specified targets.
**Important Note:** The purpose of these trading perspectives is to highlight the key levels ahead of price action and the market’s possible reactions to them. These analyses are by no means trading signals.

EURUSD Bearish Outlook.Hi there,
EURUSD at the H1 timeframe seems to be losing bullish momentum to 1.17k. We have three potential target areas for a bias of 1.15139.
Happy Trading,
K.
Not trading advice

EURUSD: Important Breakout 🇪🇺🇺🇸
EURUSD keeps rising for the last 2 weeks.
Yesterday, the market went up again and violated
a significant falling trend line
It is another strong bullish signal.
I think that the pair will most likely continue rising
and reach 1.1755 soon.
❤️Please, support my work with like, thank you!❤️
I am part of Trade Nation's Influencer program and receive a monthly fee for using their TradingView charts in my analysis.

Let me tell you where the important support and resistance are.Hello friends
Given the positive price trend last week, we see that the closer the trend approaches its important resistances, the weaker it becomes, and the more likely the price will correct from these resistances.
If the price corrects from the specified resistances, the price can move to the specified targets, and we also have a good support area below that we expect buyers to support.
*Trade safely with us*

EUR/USD Daily Chart Analysis For Week of August 15, 2025Technical Analysis and Outlook:
During the last trading session, the Euro demonstrated a notable increase, retesting the Mean Resistance level of 1.169. Recent analyses suggest that the primary targets for the Euro are the Mean Resistance level of 1.177 and the Key Resistance level of 1.181, in addition to the Outer Currency Rally target of 1.187. Such movements may precipitate a considerable pullback before the upward trajectory resumes.

EUR/USD - Multi Time frame Analysis 📆 Weekly (Top-left chart)
Elliott Wave: Market looks like it has completed wave (4) and is potentially starting a corrective move into (5) down.
Resistance Zone: Price is rejecting from strong resistance around 1.1700 – 1.1800.
Channel Structure: Still inside a long-term descending channel.
Fair Value Gap (FVG): Weekly imbalance marked lower, aligning with target levels around 1.0600–1.0700.
Implication: Weekly outlook favors bearish reversal from resistance, with downside potential toward strong support/FVG levels.
📆 Daily (Top-right chart)
Wave Count: Clear 5-wave bullish structure into resistance, now stalling.
Correction (a-b-c): Market already showing early corrective behavior — a bounce (a), retrace (b), potential continuation (c) lower.
Liquidity: Buy-side liquidity taken above recent highs. This suggests exhaustion.
Target Zones: Strong support and FVG levels around 1.1400–1.1100.
Implication: Daily chart signals end of bullish momentum → strong probability of a retracement leg lower.
📆 4H (Bottom chart)
Price Structure: Consolidating near resistance, making lower highs under a descending trendline.
Corrective Pattern: Clear a-b-c correction structure forming, with price now near “b” top.
Sell Zone: Resistance around 1.1700–1.1750 aligns with higher time frame supply.
Downside Targets: Next liquidity zones and demand areas sit around 1.1500 → 1.1300.
Implication: On 4H, market is building for a downside continuation, with bearish confirmation on break of recent internal lows.
✅ Overall Summary (EUR/USD):
Weekly: Strong rejection from resistance → bearish bias toward 1.06–1.07.
Daily: Bullish run exhausted, corrective move underway.
4H: Short-term structure supports continuation lower into demand zones.
📌 Translation: EUR/USD is bearish across all timeframes unless it breaks cleanly above 1.1800, which is the invalidation zone.

eurusd1#Trend bulish
2#no any divergence
3#price retrace at fib level 0.618
entry price
1.16369
SL 1.15699
TP 1.17070

EURUSD , LONGTuesday, bias remains bullish, interestingly price make similar gap at the same level as yesterday.
1) wait for price to trade down to the level , around 1.1667 and 1.1654 as my stop.
2) still aim for last week high as liquidity run

EURUSD LONGEURUSD chart
15m swing structure bearish
15m internal structure bullish
a Bullish BOS detected in 1h TF so then increases probability of a bearish movement.

EURUSD prices consolidate, ready to pullbackEURUSD prices consolidate, ready to pullback
On Tuesday, the dollar took a small hike against other major currencies as markets digested some news about a White House meeting with European countries regarding the conflict in Ukraine. This meeting could determine what happens next in the conflict. Tina Teng, an analyst, said that markets are being careful and there's a bit of a risk-avoidant mood. Stock indices hit record highs, which boosted the dollar. If there's an agreement on Ukraine, it could shift the burden to Europe, leading to money leaving the euro and pound and strengthening the dollar even more. Also, people are focusing on the Jackson Hole conference, where Fed Chair Jerome Powell will talk about interest rates.
Technically, EURUSD price has formed a bearish wedge. Bearish divergence on RSI is highlighted. The price is ready to drop towards 1.15000 level as a first target.

Short EURUSDFast down to retest and grab liquidities then up again to fill the gap
Everything is on the chart
Take profit from 1.1628-1.160

setup flaFLA/FLB SetUp CheckList 1. FLA from S/R or QML 2. Engulf of FLA and Making FLB 3. Trick in FLA (DP=QML=MPL) 4. Engulf of the Prime L caused FLA

#EURUSD Looks good for more highs!!IBKR:EURUSD can be bought in panic!! Looks good for one more push higher

EURUSDThis is a EUR/USD 4-hour chart showing a descending triangle / wedge structure.
Upper trendline (resistance): Sloping downwards, connecting lower highs.
Lower trendline (support): Flat around 1.1450, acting as a major demand zone.
Current price: 1.1666, sitting just below the mid-structure.
The chart presents two possible scenarios:
1. Bullish breakout – If price breaks above the descending resistance line, the next upside target is 1.1829, which aligns with the previous swing high.
2. Bearish rejection – If price fails at the resistance and breaks the ascending support, it could drop sharply back to 1.1450 support, possibly even spiking lower into the extended support zone before bouncing.
This is basically a consolidation inside a wedge with the market coiling tighter. The breakout direction will likely set the next medium-term trend.
👉 In short: The market is trapped between a falling resistance and horizontal support. A breakout either way will create a big move.

$EURUSD 15m Mark-UpAug 18 - Mark-Up Update
Analysis Note:
The demand zone failed, and price did not move toward the Asian high.
Currently, if price manages to maintain its bullish structure and shift character from this area on the lower timeframe, it may push upward. If not, it will likely head toward the weak low I marked, and we may see a 15-minute swing character shift.
By analyzing price action on the 5-minute timeframe, you can make a more precise decision for either scenario!
Follow us to never miss more analyses.

"Pattern + Smart Money = Big Move Loading
🔺 Sellers Active Zone: Strong supply zone, sellers defending it.
🔻 ABCDE Triangle: Price completing E-wave – bearish breakout likely.
🎯 Target Zone: FVG Orderblock (1.15400 – 1.15800).
🏦 Smart Money Concept: Liquidity hunt before reversal.
⚠️ Stay alert: A bearish drop from wave E into the FVG orderblock looks highly probable! 🚀📉

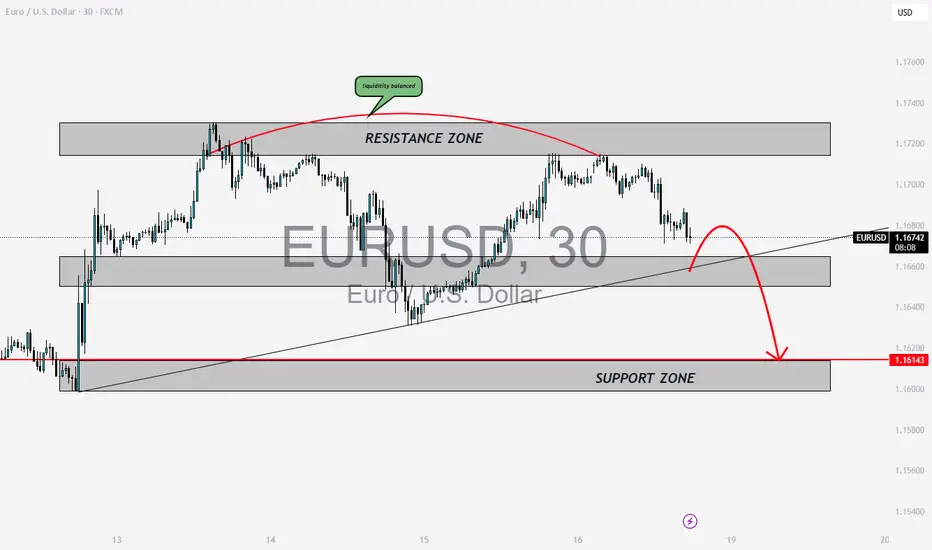
EUR USD - PRICE STRONG DOWN FALL TO SUPPORT ZONE AT 1.16200 HERE we can see that price cleared all the liquidity, at resistance zone we are at the point of 0.5 level fib,as we can expect price will take a move to support to fill fvg points, make a short entry after clear break out, as shown follow more live updates... nd check the page for more...