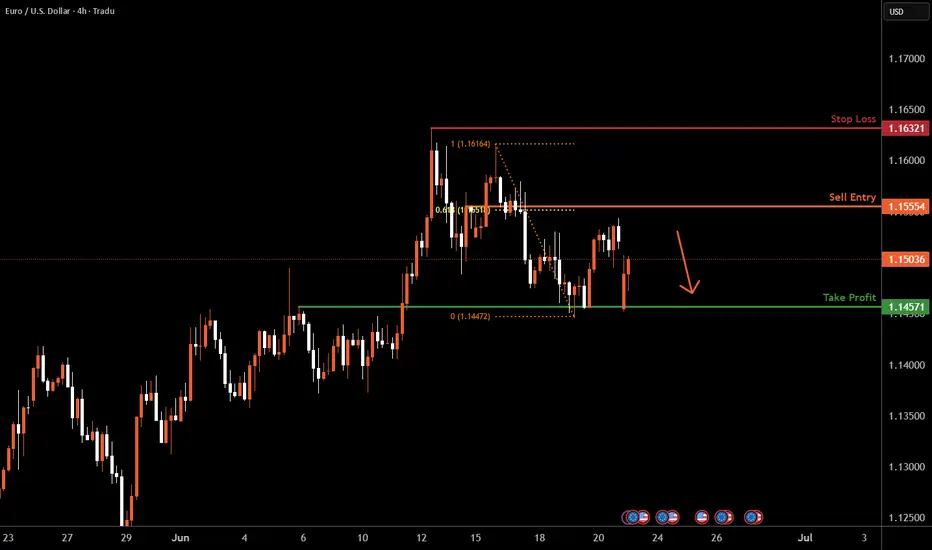
EURUSD H4 I Bearish Reversal Off the 61.8% FibBased on the H4 chart, the price is rising toward our sell entry level at 1.1555, a pullback resistance that aligns with the 61.8% Fib retracement.
Our take profit is set at 1.1457, an overlap support.
The stop loss is set at 1.1632, a swing high resistance.
High Risk Investment Warning
Trading Forex/CFDs on margin carries a high level of risk and may not be suitable for all investors. Leverage can work against you.
Stratos Markets Limited (tradu.com ):
CFDs are complex instruments and come with a high risk of losing money rapidly due to leverage. 63% of retail investor accounts lose money when trading CFDs with this provider. You should consider whether you understand how CFDs work and whether you can afford to take the high risk of losing your money.
Stratos Europe Ltd (tradu.com ):
CFDs are complex instruments and come with a high risk of losing money rapidly due to leverage. 63% of retail investor accounts lose money when trading CFDs with this provider. You should consider whether you understand how CFDs work and whether you can afford to take the high risk of losing your money.
Stratos Global LLC (tradu.com ):
Losses can exceed deposits.
Please be advised that the information presented on TradingView is provided to Tradu (‘Company’, ‘we’) by a third-party provider (‘TFA Global Pte Ltd’). Please be reminded that you are solely responsible for the trading decisions on your account. There is a very high degree of risk involved in trading. Any information and/or content is intended entirely for research, educational and informational purposes only and does not constitute investment or consultation advice or investment strategy. The information is not tailored to the investment needs of any specific person and therefore does not involve a consideration of any of the investment objectives, financial situation or needs of any viewer that may receive it. Kindly also note that past performance is not a reliable indicator of future results. Actual results may differ materially from those anticipated in forward-looking or past performance statements. We assume no liability as to the accuracy or completeness of any of the information and/or content provided herein and the Company cannot be held responsible for any omission, mistake nor for any loss or damage including without limitation to any loss of profit which may arise from reliance on any information supplied by TFA Global Pte Ltd.
The speaker(s) is neither an employee, agent nor representative of Tradu and is therefore acting independently. The opinions given are their own, constitute general market commentary, and do not constitute the opinion or advice of Tradu or any form of personal or investment advice. Tradu neither endorses nor guarantees offerings of third-party speakers, nor is Tradu responsible for the content, veracity or opinions of third-party speakers, presenters or participants.
EURUSD trade ideas
EURUSD| Weekly OutlookSame story as last week — still patiently waiting for the major engineered liquidity above to get cleared before considering any meaningful longs.
That said, EU is currently offering a clean structure for short setups into the downside order block. Everything is lining up technically, but it’s important to note this is a counter-trend move — and personally, I’m not taking it.
It’s tempting when structure looks this clean, but I know it’s not my proper approach. For me, the real play is still higher — waiting on that bull-side OB mitigation to align with the bigger picture narrative. Until then, I’ll let others chase while I sit on my hands. Pure discipline only.
Bless Trading!

EURUSD Stalling—Breakout or Breakdown Next?EURUSD has been trending higher but is now flashing signs of exhaustion. While shorts remain risky without more confirmation, aggressive traders could explore them near the highs. Longs also carry increasing risk at these extended levels. Two idea paths: a cautious long continuation, or a speculative reversal trade. A clean break of key trendlines will likely invalidate short setups and resume the uptrend.

#AN009: US attacks IRAN, what will happen?
On June 22, 2025, the United States launched air strikes on three Iranian nuclear sites (Fordow, Natanz, Isfahan), using bunker-buster bombs and Tomahawk missiles, some dropped by B-2 stealth bombers
President Trump declared that the facilities were “completely and totally obliterated”
📈 Tensions and geopolitical context
Tehran responded with missiles aimed at Israel and promised “tough responses”
The UN and key figures such as Guterres and Medvedev have defined the action as a dangerous escalation with the risk of a new conflict on a regional scale.
Israel supported the attacks, while Iran convened the UN Security Council to condemn the aggression.
💥 Market Impact
⚡ Energy Sector
Oil prices jump towards $90–100 per barrel on fears of flows from Iran and potential closures of the Strait of Hormuz.
Investors reacted with a move towards safe haven assets such as the Dollar, Gold and Treasuries.
📊 Equities and sensitive sectors
Starts on an uncertain tone: S&P500 and Nasdaq futures “volatile open”, with penalties on travel and tech, and increases on energy and defense.
Gulf markets open slightly higher (Saudi, Qatar, Bahrain, Kuwait), thanks to the attenuation of initial sell-offs.
🌍 Global economic impact
Weakening predictions from the World Bank, IMF and OECD predict an economic slowdown due to energy shocks and increased global tensions.
📌 Currency and Forex Scenario
USD has gained ground as a safe haven asset, benefiting from Safety flows.
Commodity-linked pairs, such as AUD/USD, NZD/USD and CAD/USD, will be pressured by rallying oil.
Potential increase in volatility on EUR/USD and GBP/USD: they rotate towards safe haven and US/China political risk.
📣 What to watch out for
Daily and H4 candlesticks in EUR/USD and GBP/USD to understand if support holds under geopolitical stress.
Volatility indicators (VIX | MOVE) are rising, it is useful to calibrate the size and prefer structured trades.
In the coming days it will be essential to monitor:
Reuters/Bloomberg for updates on possible sanctions or public retaliation.
ASEAN and Asia for regional reactions on energy supplies.
Central banks on inflation expectations due to high oil.
💡 Conclusions – Market and Forex Impact
This military action represents a classic geopolitical shock: rising dollar and defensive assets, pressure on oil and high volatility on stock markets and exchange rates. Unlike Israeli attacks, the direct entry of the US increases the degree of macro uncertainty.
For Forex traders:
USD Index: potential rebound within the bullish trend channel
Pairs with commodities: activate strategies on breakout key levels (e.g. AUD/USD, CAD/USD)
Anti-USD FX (EUR, GBP, JPY): under pressure and to be used in range rebound.
For the equity sector:
Rotation towards defensive sectors, defense, energy.
Possible entry into government bonds as a high inflation/political hedge.
Overall, the impact is clear: increased geopolitical risk → high volatility → shift towards USD/safe haven asset → penalization of sensitive assets.

EURUSD weekly outlookI’m waiting for price to tap into the bearish FVG and sweep the buyside liquidity around before looking for a sell. If price sweeps the sellside liquidity or the lower FVG around I’ll shift my focus to a buy setup. Trading both sides of the range based on liquidity grabs and reaction.

Bearish reversal?EUR/USD is rising towards the resistance level which is a pullback resistance that lines up with the 61.8% Fibonacci retracement and could reverse from this level to our take profit.
Entry: 1.1555
Why we like it:
There is a pullback resistance that lines up with the 61.8% Fibonacci retracement.
Stop loss: 1.1608
Why we like it:
There is a pullback resistance.
Take profit: 1.1483
Why we like it:
There is a pullback support level that aligns with the 61.8% Fibonacci retracement.
Enjoying your TradingView experience? Review us!
Please be advised that the information presented on TradingView is provided to Vantage (‘Vantage Global Limited’, ‘we’) by a third-party provider (‘Everest Fortune Group’). Please be reminded that you are solely responsible for the trading decisions on your account. There is a very high degree of risk involved in trading. Any information and/or content is intended entirely for research, educational and informational purposes only and does not constitute investment or consultation advice or investment strategy. The information is not tailored to the investment needs of any specific person and therefore does not involve a consideration of any of the investment objectives, financial situation or needs of any viewer that may receive it. Kindly also note that past performance is not a reliable indicator of future results. Actual results may differ materially from those anticipated in forward-looking or past performance statements. We assume no liability as to the accuracy or completeness of any of the information and/or content provided herein and the Company cannot be held responsible for any omission, mistake nor for any loss or damage including without limitation to any loss of profit which may arise from reliance on any information supplied by Everest Fortune Group.

EURUSD -> Bullish Idea 22/06/2025(ICT x Volume Profile)OANDA:EURUSD 🎯 Bias: Bullish
🕒 Timeframe: H1 primary, H15 confirmation
Happy sunday traders!
Following President Trump’s strikes on Iran, I expect an initial bearish reaction in the Asian and London Sessions, then a bullish reaction in the NY sessions as sellers push the USD lower. However, the prevailing trend context remains bullish: the hourly chart has shifted structure (MSS) and broke structure to the upside. I anticipate a liquidity sweep below the recent lows, before a retracement into the 15-minute fair value gap (FVG) which aligns with the volume profile, then continuation higher to target the weak high and into the swing highs marked.

EURUSD: Important Supports & Resistances For Next Week 🇪🇺🇺🇸
Here is my latest structure analysis for EURUSD for next week.
Consider these supports and resistances for breakout/pullback trading.
❤️Please, support my work with like, thank you!❤️
I am part of Trade Nation's Influencer program and receive a monthly fee for using their TradingView charts in my analysis.

Short EU next weekAs can see from chart EU is currently in a small down channel and now price rejected the upper channel with good pin bar formation. Sell this projected to the lower channel

EUR/USD breakout awaiting EUR/USD has not provided a clear structure over the past week or two. The pair appears to be in consolidation, building liquidity on both sides of the current range. At the moment, I’m waiting for a decisive breakout, ideally followed by distribution within the monthly supply zone, although that zone is still some distance away.
This week, my focus will be on whether a new supply zone forms, closer to current price. If price sweeps the nearby equal highs and then shows signs of reversal, this could give us a fresh supply area to work from. Alternatively, if price moves lower, I’ll be looking at the 8-hour demand zone around 1.16000 for a possible long setup.
Confluences for EUR/USD:
- Although price has been slightly bullish, the current consolidation phase suggests a potential reversal could be on the horizon.
- Liquidity is building on both sides of the range, making a reaction from the monthly supply zone increasingly probable.
- There’s significant downside liquidity still untapped, such as Asia session lows, which could serve as short-term targets.
- For clearer confirmation, we still need a decisive break in market structure to the downside.
P.S. If price sweeps the lower liquidity and moves into the 8-hour demand zone near 1.16000, I will be watching for accumulation to form and signs of bullish intent from there.

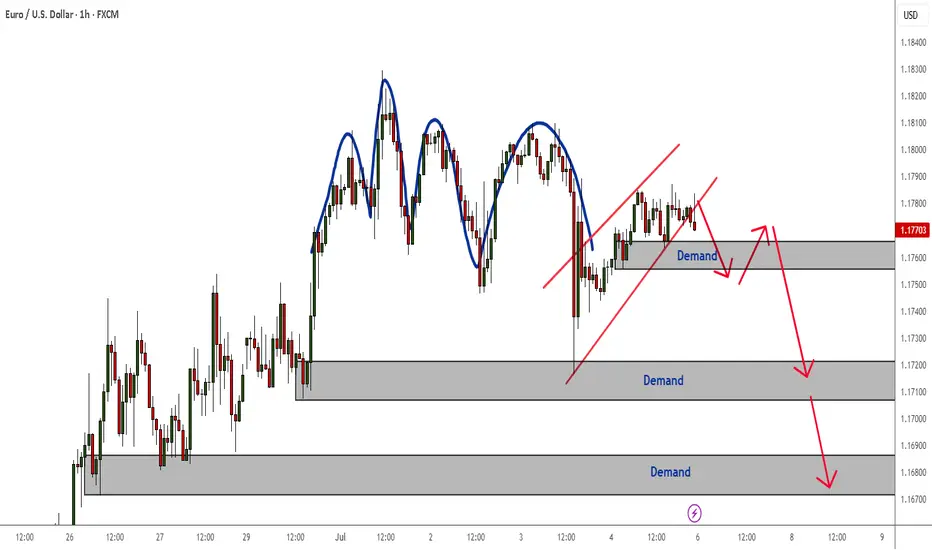
EURUSD Quadruple Top Rejection Pattern - Bearish Correction This quadruple top rejection pattern on the H1 timeframe is currently in play and it is a strong indication or confirmation that the bearish correction will likely resume next week.
If you are unsure when to enter short positions for this trade setup, wait for a demand zone to break, followed by a pullback and continue to ride the bearish momentum and target the next demand zone, and the next and so on and so forth until a time when this correction ends and the uptrend continues.
EUR/USD Daily Chart Analysis For Week of July 4, 2025Technical Analysis and Outlook:
During the trading session this week, we witnessed the successful completion of the Outer Currency Rally at a level of 1.177. Recent analyses suggest that the Euro is likely to encounter a downward trend, with an initial target set at the Mean Support level of 1.168 and a potential extension to an additional Mean Support of 1.160. Nevertheless, it is crucial to acknowledge the possibility of a subsequent increase toward the next Outer Currency Rally level of 1.187 before any definitive downward movement transpires.

EURUSD facing resistance at upper channel line-consolidatingEURUSD facing resistance at upper channel line-consolidating at narrow zone

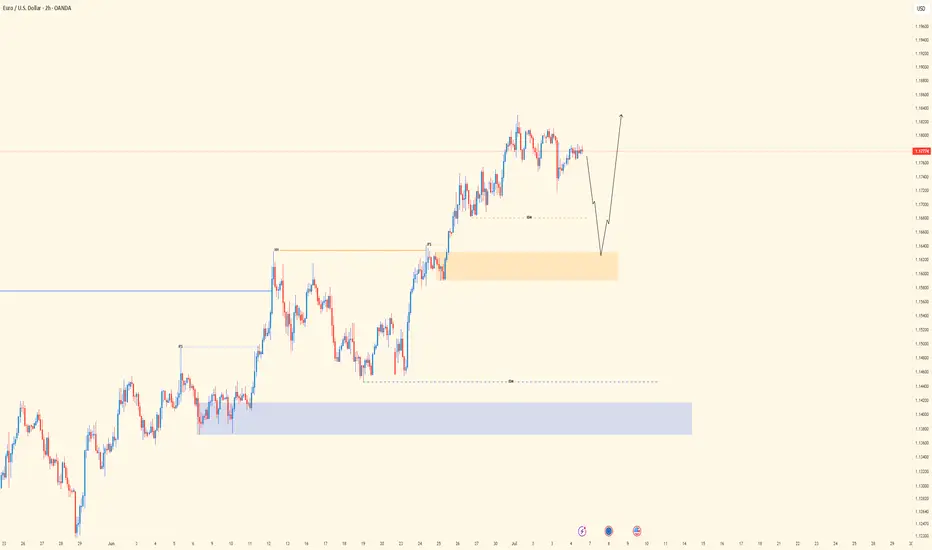
EU| - Bullish Structure Intact | Watching for SSL Sweep and RunPair: EURUSD
Bias: Bullish
Timeframes: 4H, 2H, LTFs
• 4H structure is clean and bullish — momentum’s been steady, and the market looks ready to ride higher going into next week.
• 2H gives clarity — I’m watching for a sweep of SSL into OB to set the stage for LTF confirmation.
• Entry process remains the same: wait for CHoCH, followed by sweep inside the OB zone.
🔹 Entry: After CHoCH + sweep inside OB (LTF process repeated)
🔹 Entry Zone: After confirmation within OB
🔹 Target: Structure highs — letting price unfold with the trend
Mindset: Patience pays the most. Wait for the market to come to you, not the other way around.
Bless Trading!
Euro-dollar retreats from $1.18Euro-dollar’s uptrend which has lasted fairly consistently since the start of 2025 continued in June with the price reaching a fresh four-year high above $1.18 on 1 July. Less confidence in the USA as the government continues to flip-flop and contradict on tariffs has driven capital out of the dollar. Monetary policy in the eurozone might stabilise with majority expectations pointing to only one more cut by the ECB this year while CME FedWatch suggests an 80% probability of at least two cuts by the Fed before the end of 2025.
Low volume and clear overbought conditions might point to a pause in the uptrend soon, but selling demand also seems to be limited as seen from the relatively long tails of recent candlesticks. The 23.6% monthly Fibonacci retracement is slightly above the top of this chart around $1.1885. The 38.2% Fibo around $1.166 is a possible area of support.
This is my personal opinion, not the opinion of Exness. This is not a recommendation to trade.

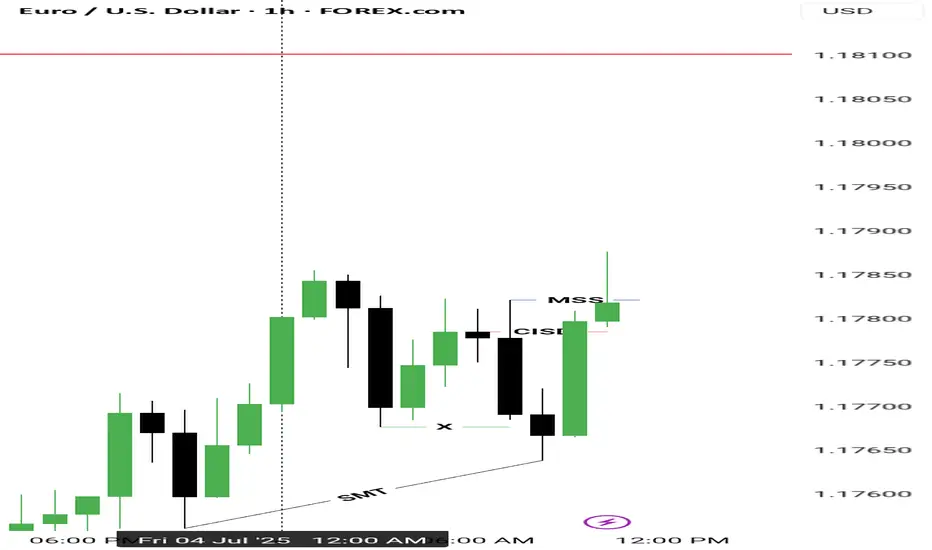
Possible buys for eurusd Dxy yet to confirm the CISD
HTF KEY LEVEL
1. Hourly OB; we've confirmed bullishness yesterday so 1H can serve as HTF
CONFIRMATIONS
1. liquidity purge ✅
2. Cisd ✅
3. ifvg✅
4. Fvg ✅
5. Mss ✅
EURUSD 4H Structure Analysis | MMC Strategy + Channel + CurveIn this EURUSD 4-hour chart analysis using MMC (Market Mind Concept), we are observing a textbook rising channel structure accompanied by a black mind curve (evidence of psychological support behavior). Let's break it down:
📊 Structure Overview:
Straight Ascending Channel:
Price has been respecting a clean, straight rising channel, forming higher highs and higher lows over the past several weeks. This structure provides a controlled bullish bias, but we are approaching an inflection point.
Black Mind Curve Support (Evidence 2):
A curved trendline (Mind Curve) is providing dynamic support. This curve intersects with the lower boundary of the rising channel—creating a confluence zone, which is likely to act as strong short-term support or the base of a reversal.
Major BOS (Break of Structure):
A significant bullish BOS occurred earlier, confirming momentum strength. This previous break is acting as a reference point for bullish continuation scenarios.
📉 Bearish Scenario:
If the price breaks below the channel and mind curve support, this would invalidate the current bullish channel structure.
A clean breakout + retest below the support zone may invite strong selling pressure, targeting previous support zones around 1.1500 – 1.1350.
📈 Bullish Scenario:
If the price holds above the mind curve and continues upward, we may see a breakout above the top of the channel.
A confirmed breakout could send price toward the 1.1900 – 1.2000 resistance zone.
Patience is key—wait for a confirmed breakout from the channel (either side) before engaging.
⏳ Strategy Outlook:
✅ Wait for channel breakout confirmation (up or down)
⚠️ Watch for fakeouts or liquidity grabs near channel boundaries
🔁 Mind Curve Support adds another layer of decision-making structure
🧠 Trade with the trend, but remain adaptable to shift if channel breaks
🔍 Summary:
The EURUSD pair is in a decision-making zone—either we get a bullish continuation breakout, or the structure fails and we flip into a bearish correction. The confluence of the straight channel and mind curve makes this setup high-quality for both trend traders and breakout traders.

EURUSD is almost at h1 ob and previous day high. EURUSD approaching the H1 order block (OB) and the previous day high. That’s a strong confluence zone for a potential reversal.
Here’s a quick game plan you could consider:
Entry: Look for bearish reversal price action signals (like pin bars, bearish engulfing candles) right at the H1 OB / previous day high zone.
Stop loss: Just above the order block or recent swing high to minimize risk.
Target: Yesterday’s low as your take profit zone — logical support area.
Risk/Reward: Make sure it fits your 1-2% risk per trade with at least 1:2 or 1:3
Fundamental Market Analysis for July 4, 2025 EURUSDEvents to pay attention to today:
12:00 EET. EUR - Producer Price Index
EURUSD:
On Friday, during the Asian session, the EUR/USD pair is trading in a narrow range around 1.1760. The main currency pair is showing sluggish dynamics amid the US holiday (Independence Day).
The US dollar (USD) is maintaining its recovery, triggered by better-than-expected non-farm payrolls (NFP) data for June. Data released on Thursday showed that the US economy added 147,000 new jobs, exceeding expectations of 110,000.
The better-than-expected NFP data brought some relief to the US dollar, but this is unlikely to continue as the report shows that private sector hiring is losing momentum. Private employers added 74,000 jobs in June, well below the three-month average of 115,000. This scenario is unlikely to ease the position of several Federal Reserve (Fed) officials, including Vice Chair for Supervision Michelle Bowman, who advocated for lower interest rates at a policy meeting later this month, citing potential risks in the labour market.
In the eurozone, the sharp appreciation of the euro (EUR) has raised concerns that inflation could fall below the European Central Bank's (ECB) 2% target. According to a senior ECB official, ‘the ECB may have to make it clear that too strong a euro could be a problem, as it could cause inflation to hover below target,’ reports the Financial Times (FT).
Trading recommendation: SELL 1.17700, SL 1.18000, TP 1.16900


EURUSD: Expecting Bullish Continuation! Here is Why:
The analysis of the EURUSD chart clearly shows us that the pair is finally about to go up due to the rising pressure from the buyers.
Disclosure: I am part of Trade Nation's Influencer program and receive a monthly fee for using their TradingView charts in my analysis.
❤️ Please, support our work with like & comment! ❤️

EURUSD | ARX Method RecapIn this short video, we walk through what happened on EURUSD today using the ARX Method focusing on liquidity, structure, and market behavior.
We also highlight the next key zones and areas of interest we're watching based on price flow and confluence.
This is for educational purposes only not financial advice or trade signals.
The goal is to help traders understand how to read and react to price with clarity and structure.

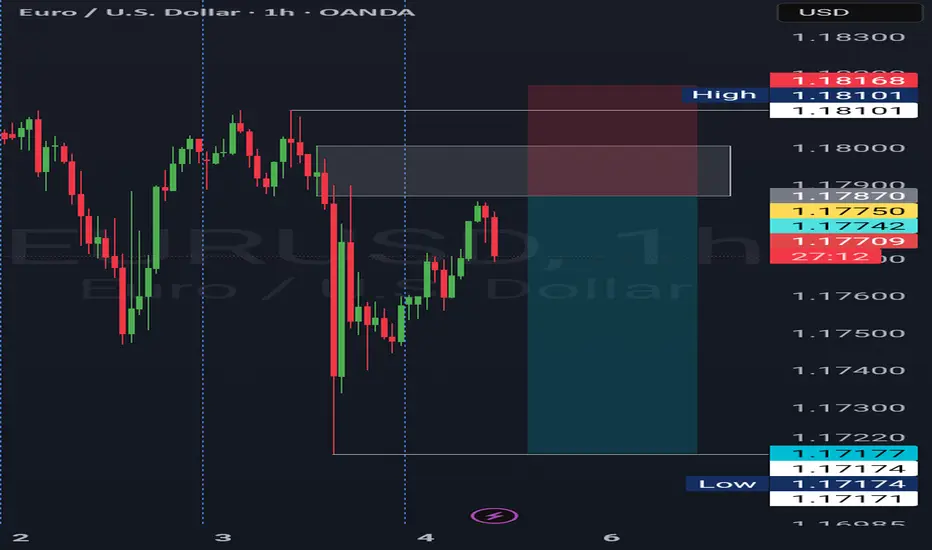
EURUSD: Move Up Expected! Long!
My dear friends,
Today we will analyse EURUSD together☺️
The recent price action suggests a shift in mid-term momentum. A break above the current local range around 1.17930v will confirm the new direction upwards with the target being the next key level of 1.17985 and a reconvened placement of a stop-loss beyond the range.
❤️Sending you lots of Love and Hugs❤️
