Here is why EURUSD bulls will holdBased on fundamental analysis, the dollar has remained in a risk on mood due to tariffs and the delay of Powell to cut rates. Despite the delay, President Trump has also been threatening the Fed independence making it difficult for the dollar to sustain gains. Technically the pair has been seen to clear sell side liquidity at 1.14500 zones. Therefore, if the pair maintains the momentum it will go to 1.19000
EURUSD trade ideas


EURUSD – DAILY FORECAST Q3 | W33 | D13 | Y25📊 EURUSD – DAILY FORECAST
Q3 | W33 | D13 | Y25
Daily Forecast 🔍📅
Here’s a short diagnosis of the current chart setup 🧠📈
📍EURUSD Market Update – FRGNT
Price has now entered our higher time frame order block, meaning long positions are off the table for now. ❌📈
We’re now looking for price to push deeper into the daily OB, advancing into the lower time frame order blocks nested within the HTF zone. 🔍
From here, we’re waiting for a clear break of structure to confirm intent — once we get that, we’ll look to ride price short with the trend. 📉🎯
Stay patient, stay disciplined — let the setup come to you.
Higher time frame order blocks have been identified — these are our patient points of interest 🎯🧭.
It’s crucial to wait for a confirmed break of structure 🧱✅ before forming a directional bias.
This keeps us disciplined and aligned with what price action is truly telling us.
📈 Risk Management Protocols
🔑 Core principles:
Max 1% risk per trade
Only execute at pre-identified levels
Use alerts, not emotion
Stick to your RR plan — minimum 1:2
🧠 You’re not paid for how many trades you take, you’re paid for how well you manage risk.
🧠 Weekly FRGNT Insight
"Trade what the market gives, not what your ego wants."
Stay mechanical. Stay focused. Let the probabilities work.
FX:EURUSD


EURUSD DAILY TIMEFRAME ANALYSIS From the chart (EUR/USD, Daily), here’s the breakdown:
---
Trend Analysis
Medium-term context: Price previously made a strong bullish run from late May to late June 2025, topping near 1.1840.
Recent action: After that peak, we’ve seen a lower high and lower low structure, meaning the market shifted into a bearish correction.
Current state: Price is in a range/consolidation between roughly 1.1400 (support) and 1.1780 (resistance), but leaning bullish short-term because the recent candles have been climbing back toward the upper mid-range.
The key mid-range level around 1.1680–1.1700 is being retested — this is both a former support-turned-resistance and a zone where many stop orders could be clustered.
---
Liquidity & Stop Hunt Zones
1. Above current highs (bullish liquidity)
Around 1.1730–1.1780: Previous swing highs and order block zone.
Institutions could push price above here to trigger buy stops before reversing.
Above 1.1840: Major liquidity pool from the June top.
2. Below current lows (bearish liquidity)
Around 1.1610: Recent swing low and consolidation base.
Around 1.1560: Cluster of lows where stop losses for buyers may sit.
1.1400 zone: Key liquidity pool from the July drop — large stop cluster likely below here.
---
Possible Stop Hunt Scenarios
Bullish Stop Hunt: Price could run above 1.1730 to take out breakout buyers’ stops and then reverse down.
Bearish Stop Hunt: Price could drop below 1.1610 to grab liquidity before pushing up again toward 1.1780.


EURUSD Setup Is Crystal Clear — Here’s My Long & Short TriggersHey, it’s Skeptic. This isn’t about blind price prediction — it’s about spotting clean long and short triggers on EURUSD using daily and 4H structure, DXY correlation, and momentum.
We’ll break down a fresh V-Pattern , exact breakout levels, and how to avoid getting chopped in ranges.
If this helped, give it a boost — peace out.

EURUSD after the newsYesterday, EURUSD continued its bullish move, reaching 1,1697.
If the rally continues, the next target is 1,1760.
Some pullbacks are still possible before breaking above the previous high, which could provide opportunities for additional entries.
Focus only on trades in the main direction!


EURUSD H4 | Bearish reversalEUR/USD is rising towards the sell entry which is a pullback resistance and could drop from this level to the downside.
Sell entry is at 1.1674, which is a pullback resistance.
Stop loss is at 1.1778, which is a swing high resistance.
Take profit is at 1.1538, a pullback support that aligns with the 127.2% Fibonacci extension.
High Risk Investment Warning
Trading Forex/CFDs on margin carries a high level of risk and may not be suitable for all investors. Leverage can work against you.
Stratos Markets Limited (tradu.com ):
CFDs are complex instruments and come with a high risk of losing money rapidly due to leverage. 65% of retail investor accounts lose money when trading CFDs with this provider. You should consider whether you understand how CFDs work and whether you can afford to take the high risk of losing your money.
Stratos Europe Ltd (tradu.com ):
CFDs are complex instruments and come with a high risk of losing money rapidly due to leverage. 66% of retail investor accounts lose money when trading CFDs with this provider. You should consider whether you understand how CFDs work and whether you can afford to take the high risk of losing your money.
Stratos Global LLC (tradu.com ):
Losses can exceed deposits.
Please be advised that the information presented on TradingView is provided to Tradu (‘Company’, ‘we’) by a third-party provider (‘TFA Global Pte Ltd’). Please be reminded that you are solely responsible for the trading decisions on your account. There is a very high degree of risk involved in trading. Any information and/or content is intended entirely for research, educational and informational purposes only and does not constitute investment or consultation advice or investment strategy. The information is not tailored to the investment needs of any specific person and therefore does not involve a consideration of any of the investment objectives, financial situation or needs of any viewer that may receive it. Kindly also note that past performance is not a reliable indicator of future results. Actual results may differ materially from those anticipated in forward-looking or past performance statements. We assume no liability as to the accuracy or completeness of any of the information and/or content provided herein and the Company cannot be held responsible for any omission, mistake nor for any loss or damage including without limitation to any loss of profit which may arise from reliance on any information supplied by TFA Global Pte Ltd.
The speaker(s) is neither an employee, agent nor representative of Tradu and is therefore acting independently. The opinions given are their own, constitute general market commentary, and do not constitute the opinion or advice of Tradu or any form of personal or investment advice. Tradu neither endorses nor guarantees offerings of third-party speakers, nor is Tradu responsible for the content, veracity or opinions of third-party speakers, presenters or participants.

Live Demo: Applying the Nx BIAS Indicator in a Swing TradeHi
Following my last thread about the 🛡️ Nx BIAS 🛡️ indicator for defining market direction, I decided to take a short-term swing trade as part of a backtesting exercise on #EURUSD. Here are the details:
1. Initial Bias (1-Hour Timeframe):
At the beginning of the Asian session, a 'B' (Bullish) signal appeared on the 1H chart. This gave me my initial bullish bias. The invalidation for this bias was a candle body close below the low of the 'B' signal candle.
2. Identifying Liquidity (15-Minute Timeframe):
Dropping down to the 15-minute chart, I identified the nearest clear liquidity zones, as shown in Image #2.
3. Entry Execution (15-Minute Timeframe):
My entry was triggered after an I-MSS (Internal Market Structure Shift) on the 15-minute timeframe. The trade had a projected Risk-to-Reward Ratio (RRR) of 2.5.
The Target:
The ultimate target is the DOL (Draw on Liquidity) of the daily candle from August 22, 2025. On lower timeframes, this same high represents a significant liquidity pool ($).
Interestingly, the daily chart itself had previously printed a 'B' signal, and the price has not yet reached either its DOL or its invalidation level.
Next Steps & Forward Testing:
I will be experimenting extensively with this indicator. A primary goal is to rely solely on it for defining bias in live conditions to test its real-world performance, moving beyond backtest results.
Disclaimer: DYOR (Do Your Own Research).
Best regards.
Hashtags:
#FOREX #TradingView #TradingIndicators #AlgoTrading #PriceAction

EUR/USD Coiling - When Will We See a Breakout?EUR/USD Technical outlook:
Resistance: Price is capped by a descending trendline from the July highs, aligning near the 78.6% Fibonacci retracement around 1.1745, which is the key ceiling to watch.
Support: The horizontal structure at 1.1580 is repeatedly tested but holding firm, making it a crucial pivot. Below this, the 50-day SMA (1.1656) has also been acting as dynamic support.
Momentum: RSI sits near neutral (51), showing no strong directional bias yet. MACD is flat, indicating consolidation rather than trend continuation.
Moving averages: Price remains above the 200-day SMA (1.1018), confirming the broader bullish trend is intact despite the current pause.
What this means:
EUR/USD is stuck in a tightening range between 1.1580 support and the descending trendline/Fibonacci resistance. A breakout above the trendline could reopen the path toward the 1.18 region, while a breakdown under 1.1580 may trigger a deeper retracement toward 1.14–1.13.
This consolidation looks like a classic “pressure build-up” phase. Traders may want to watch for a decisive daily close outside of this compression zone to gauge the next major move.
-MW

EURUSD Drops as Traders Eye U.S. Consumer Confidence DataEURUSD Drops as Traders Eye U.S. Consumer Confidence Data
EURUSD slipped 0.69% to 1.1634, after touching a four-week high of 1.1742 on Friday.
Why the euro had support:
German business climate hit a 15-month high, signaling economic strength and boosting sentiment for eurozone growth.
Improved outlook reduces expectations for ECB rate cuts, making the euro more attractive.
Today’s focus:
U.S. CB Consumer Confidence report.
Strong data → delays Fed cuts → EUR/USD could dip below 1.1600.
Weak data → dollar softens → EUR/USD may climb above 1.1700.

EURUSD swing long trade - up trendOn EURUSD we have 4hourly and hourly up trend, we are looking for bullish trading setup from low area. We have 15 min bullish divergence. We are already on BE and risk free, setup can give us 4 risk to reward. Targeting hourly high. Have a nice trading week!

Fundamental Market Analysis for August 26, 2025 EURUSDEUR/USD is holding onto its gains after rising more than three-quarters of a percent in the previous session, trading around 1.1630 during Asian hours on Tuesday.
President Trump posted a letter on social media Tuesday morning announcing that he was removing Fed Governor Cook from the Fed's board of directors. However, Cook said she would not resign because there was no reason for her dismissal. “I will continue to fulfill my duties,” she added.
President Trump also warned that he could impose a 200% tariff on Chinese goods if China refuses to supply magnets to the US. In addition, Trump threatened “additional tariffs” and restrictions on the export of advanced technologies and semiconductors in response to digital services taxes that have hit US technology companies.
The EUR/USD pair is strengthening as the euro (EUR) receives support after the European Central Bank (ECB) signaled a pause in monetary policy easing amid a strengthening labor market in the eurozone. Meanwhile, details of the agreement between the EU and the US indicate that a 15% tariff will be imposed on most European goods, while cars, pharmaceuticals, and semiconductors may be exempt from tougher US duties.
Trade recommendation: BUY 1.1655, SL 1.1585, TP 1.1765

EURUSD corrective pullback supported at 1.1544The EURUSD remains in a bullish trend, with recent price action showing signs of a corrective pullback within the broader uptrend.
Support Zone: 1.1544 – a key level from previous consolidation. Price is currently testing or approaching this level.
A bullish rebound from 1.1544 would confirm ongoing upside momentum, with potential targets at:
1.1714 – initial resistance
1.1795 – psychological and structural level
1.1890 – extended resistance on the longer-term chart
Bearish Scenario:
A confirmed break and daily close below 1.1544 would weaken the bullish outlook and suggest deeper downside risk toward:
1.1500 – minor support
1.1450 – stronger support and potential demand zone
Outlook:
Bullish bias remains intact while the EURUSD holds above 1.1544 A sustained break below this level could shift momentum to the downside in the short term.
This communication is for informational purposes only and should not be viewed as any form of recommendation as to a particular course of action or as investment advice. It is not intended as an offer or solicitation for the purchase or sale of any financial instrument or as an official confirmation of any transaction. Opinions, estimates and assumptions expressed herein are made as of the date of this communication and are subject to change without notice. This communication has been prepared based upon information, including market prices, data and other information, believed to be reliable; however, Trade Nation does not warrant its completeness or accuracy. All market prices and market data contained in or attached to this communication are indicative and subject to change without notice.

EUR/USD holds above 1.16, testing 20 SMAEUR/USD has steadied after falling 0.8% in the previous session, finding support above 1.16.
EUR/USD longer-term uptrend remains intact for now. The price ran into resistance at 1.1830 and has been pulling back, but continues to find support from the 20 SMA around 1.16. The RSI is neutral.
Should the 20 SMA continue to hold, buyers will look to rise above 1.1650, the 50 SMA, ahead of a re-test of 1.17.
Sellers would need to break below 1.16 to open the door to 1.1570, the April high. Below here 1.15, the rising trendline support comes into play.
FC

EURUSDMy expactations on EURUSD, is still buy position. Still waiting sign of reversal after complete pullback.
Let's go....

EU TECHNICAL analysis For SHORTSEU is bullish. Whatever is been traded here is a corrective structure preparing a bullish momentum. From built strategic confidence, this drop should offer prime reward.


EUR-USD Risky Long! Buy!
Hello,Traders!
EUR-USD made a sharp
Move down in one candle
Which looks very risky
But the pair is also locally
Overbought and as a horizontal
Support level is ahead
At 1.1592 we will be
Expecting a local
Bullish rebound
Buy!
Comment and subscribe to help us grow!
Check out other forecasts below too!
Disclosure: I am part of Trade Nation's Influencer program and receive a monthly fee for using their TradingView charts in my analysis.

EUR/USD likely movementI wonder how during a historic recession and possible collapse of the European Union, the euro continues to rise. One thing is for sure, something dark is coming.
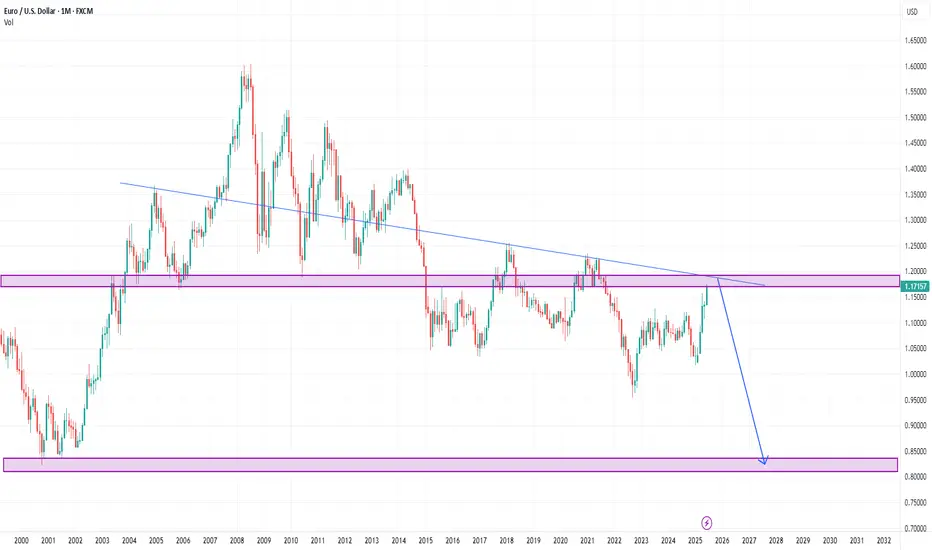
EURUSD - complete analysis HTFEURUSD - complete analysis HTF, use risk and trade managment,right now chart say short
