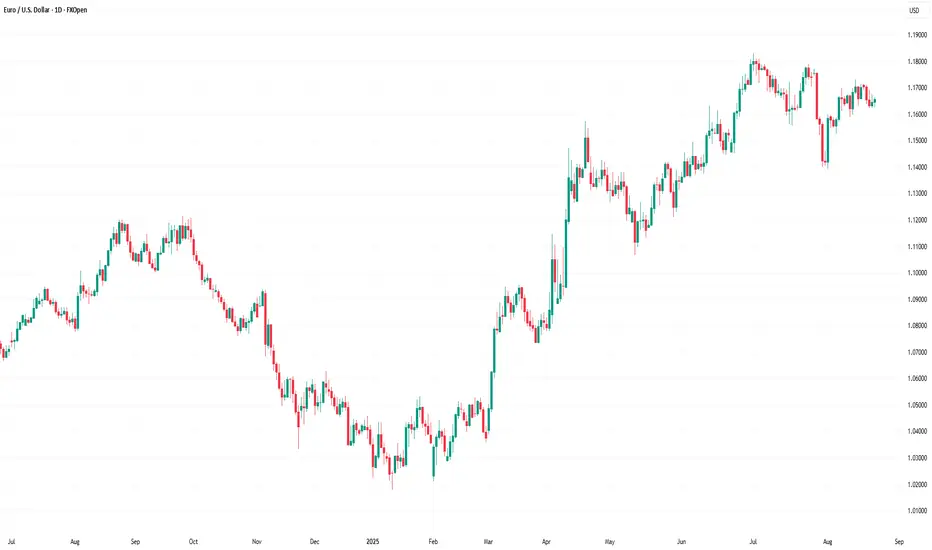
Long Trade Idea: EURUSD (Buy Setup)Market Analysis:
• Overall Trend: Bullish, supported by a clean Break of Structure (BOS) confirming upward momentum.
• Clean inducement identified
• Recent Price Action: The last bullish leg failed to clear the previous swing high and associated liquidity.
As a result, I anticipate a temporary downside move to sweep buy-side liquidity below current levels.
This pullback should create an optimal entry point for a long position, aligning with the broader bullish structure.
Trade Expectation:
Price is expected to dip lower to clear stops and liquidity before resuming the uptrend, providing a high-probability buy opportunity. Monitor for confirmation signals such as a reversal pattern or bullish divergence at lower levels.
Risk Disclaimer:
This is not financial advice. Market prices can move unpredictably due to various factors, including economic data releases, central bank speeches, interest rate decisions, geopolitical events, and policy updates. Always trade responsibly—only risk capital you can afford to lose, and employ sound risk management strategies such as stop-loss orders and position sizing.
EURUSD trade ideas

DeGRAM | EURUSD in the demand zone📊 Technical Analysis
● EUR/USD is trading within a bearish channel after rejecting the supply zone near 1.1700, with an ascending wedge breakdown confirming downside bias.
● Price is now testing the 1.1590 demand zone, but sustained closes below would open the path toward 1.1530 and possibly 1.1460, aligning with lower supply levels.
💡 Fundamental Analysis
● Dollar strength is returning as markets price reduced odds of aggressive Fed cuts, while weak eurozone PMI data this week reinforced concerns about slowing growth.
✨ Summary
Short below 1.1590; breakdown confirms targets at 1.1530 → 1.1460. Invalidation above 1.1640.
-------------------
Share your opinion in the comments and support the idea with a like. Thanks for your support!

EURUSD-Trade Plan 25/08/2025Dear traders,
i am looking for buy around 1.16400-16500 With SL : 1.15900 To Target 1.17000 -1.17300-1.17500
Regards,
Alireza!

Hellena | EUR/USD (4H): LONG to the resistance area 1.18098.We are observing the development of a five-wave impulse in the medium-term wave “2”.
The small wave “1” appears to be completing its movement, and I expect a correction in wave ‘2’ to the area of 1.15681, followed by a continuation of the upward movement in wave “3”. The minimum target for the movement is the resistance area of 1.18098.
I do not rule out the fact that wave “1” is not yet complete, so there is a possibility of the upward movement continuing without correction.
Manage your capital correctly and competently! Only enter trades based on reliable patterns!

Market Analysis: EUR/USD Dips AgainMarket Analysis: EUR/USD Dips Again
EUR/USD declined from 1.1720 and traded below 1.1650.
Important Takeaways for EUR/USD Analysis Today
- The Euro started a fresh decline after a decent move above 1.1680.
- There was a break below a key bullish trend line with support at 1.1650 on the hourly chart of EUR/USD.
EUR/USD Technical Analysis
On the hourly chart of EUR/USD, the pair rallied above the 1.1680 resistance zone before the bears appeared, as discussed in the previous analysis. The Euro started a fresh decline and traded below 1.1660 against the US Dollar.
There was a break below a key bullish trend line with support at 1.1650, and a low was formed near 1.1622. After that, the pair started a consolidation phase.
There was a minor recovery wave above 1.1630. EUR/USD is now trading below 1.1650 and the 50-hour simple moving average. On the upside, the pair is now facing hurdles near the 23.6% Fib retracement level of the downward move from the 1.1692 swing high to the 1.1622 low at 1.1640.
The next key resistance is 1.1655 and the 50% Fib retracement. The main barrier for the bulls could be 1.1665. A clear move above 1.1665 could send the pair toward 1.1690. An upside break above 1.1690 could set the pace for another increase. In the stated case, the pair might rise toward the 1.1720 zone.
If not, the pair might resume its decline. The first major support on the EUR/USD chart is near 1.1620. The next important region for buyers sits at 1.1600. If there is a downside break below 1.1600, the pair could drop toward 1.1550. Any more losses might send the pair toward 1.1500.
This article represents the opinion of the Companies operating under the FXOpen brand only. It is not to be construed as an offer, solicitation, or recommendation with respect to products and services provided by the Companies operating under the FXOpen brand, nor is it to be considered financial advice.

What Are Autoregressive Models in Trading?What Are Autoregressive Models in Trading?
Autoregressive (AR) models help traders analyse market movements by identifying statistical relationships in historical price data. These models assume that past values influence current prices, making them useful for spotting trends and price behaviour. This article explores “What is autoregression?”, how AR models function, their role in trading, and how traders apply them to market analysis.
What Is an Autoregressive Model?
Autoregressive (AR) models are statistical tools that can be used in numerous spheres, including market prices, weather, and traffic conditions. They analyse market movements by using past price data to understand current trends. The autoregressive definition refers to a model where each value in a time series depends on previous values plus an error term.
The number of previous values considered is called the “lag order,” denoted as AR(p), where ‘p’ represents the number of lags. In an autoregressive model example, an AR(1) model looks at just the previous value to estimate the current one, while an AR(3) model considers the last three. In trading, the key idea is that if historical prices show a consistent pattern—whether trending or reverting to a mean—an AR model can help identify that structure.
This approach differs from other time series models. Moving averages (MA) smooth out fluctuations by averaging past prices, while autoregressive integrated moving averages (ARIMA) combine both approaches and adjust for trends. AR models, however, focus purely on the statistical relationship between past and present values, making them particularly useful in markets where past behaviour has a clear influence on future movements.
Traders use an autoregressive process to explore trends, momentum, and potential reversals in markets that exhibit persistent patterns. However, their effectiveness depends on market conditions and the assumption that past relationships remain relevant—something that isn’t always guaranteed, especially in volatile or news-driven environments.
How Autoregressive Models Work in Trading
Traders use AR models to examine how past prices influence current movements. An autoregressive model trading strategy often involves assessing whether an asset’s price exhibits momentum or mean reversion tendencies. For example, if an AR(1) model shows that today’s price is strongly influenced by yesterday’s price, it may suggest a continuation bias—meaning traders could expect trends to persist in the short term.
In contrast, if an AR(2) or AR(3) model highlights a tendency for prices to move back toward an average after a few periods, it could indicate mean reversion. This is particularly relevant in range-bound markets where prices frequently return to support and resistance levels.
The number of past values included in an AR model is a key decision. Too few lags might miss relevant patterns, while too many can add unnecessary complexity. Traders typically determine the appropriate lag length by evaluating past data and statistical criteria like the Akaike Information Criterion (AIC).
AR models are more popular in markets where historical relationships hold for extended periods. It’s common to use autoregressive models for trading forex, equities, and commodities, especially in detecting short-term trends or cycles. While they aren’t predictive tools, they provide a structured way to analyse price behaviour, offering traders a statistical foundation for evaluating market movements.
Stationarity and Its Role in AR Models
For an autoregressive time series model to work, the data must be stationary. This means the statistical properties of the time series—such as its mean, variance, and autocorrelation—remain constant over time. If a dataset is non-stationary, meaning its trends, volatility, or relationships shift unpredictably, the AR model's analysis can become unreliable.
Why Stationarity Matters
The autoregressive model, meaning it assumes a consistent statistical structure, can struggle with shifting market conditions if stationarity is not ensured. If a time series is non-stationary, it might show an upward or downward drift, meaning price relationships aren’t consistent over time. This makes it difficult to analyse patterns. For example, a stock experiencing long-term growth won’t have a stable mean, which can distort AR-based analysis.
Testing for Stationarity
Traders often check for stationarity using statistical tests like the Augmented Dickey-Fuller (ADF) test. This test helps determine whether a time series has a unit root—a key characteristic of non-stationary data. If the test suggests a unit root is present, traders may need to adjust the data before using an AR model.
Transforming Data to Stationarity
When data is non-stationary, traders often apply transformations to stabilise it and convert it to an autoregressive model time series. Differencing is a common method, where they subtract the previous value from the current value to remove trends. Log transformations can also reduce the impact of volatility. Once stationarity is achieved, an AR model is believed to be more effective to analyse price movements.
Using an Autoregressive Model in Practice
Understanding how autoregressive models work is one thing—actually applying them in trading is another. These models are primarily used in quantitative strategies, where traders rely on statistical methods rather than gut feelings or news events. While AR models aren’t a complete trading strategy on their own, they can provide valuable insights when used correctly.
Building an AR Model
The first step in using an AR model is preparing the data. Traders typically start with a time series dataset—such as daily closing prices—and ensure it is stationary. If the data shows trends or changing volatility, they may apply differencing or log transformations to stabilise it.
Once the data is ready, the next step is determining the lag order—how many past values should be included in an AR(p) model. This is done through statistical tests like the Akaike Information Criterion (AIC) or Partial Autocorrelation Function (PACF), which help identify how far back price movements remain relevant. For instance, an AR1 model considers only the previous price point, while an AR3 model incorporates the last three observations. Choosing too few lags might miss important relationships, while too many can overcomplicate the model.
After selecting the lag order, traders fit the AR model using statistical software such as Python’s statsmodels or R’s forecast package. The model estimates how past prices influence current ones, producing a set of coefficients that define these relationships. The trader then analyses these results to determine if the model aligns with market behaviour.
Applying AR Models to Trading
Once built, an AR model provides insights into how past price behaviour influences future movement. For example:
- If an AR(1) model shows a strong positive coefficient, it suggests that today’s price is closely linked to yesterday’s, reinforcing a short-term trend.
- If an AR(2) or AR(3) model suggests a return toward a long-term mean, it may indicate a market where price cycles are present.
Traders use these insights in different ways. Some apply AR models to analyse short-term market momentum, while others use them to examine mean-reverting assets like certain forex pairs or commodities. They can also compare AR-based analysis with other indicators like moving averages or Bollinger Bands to refine their decision-making process.
Autoregressive models are also used in machine learning for time series forecasting, helping algorithms detect patterns in sequential data. In trading, autoregressive model machine learning techniques can refine models by dynamically adjusting lag parameters, improving adaptability to changing market conditions and reducing reliance on fixed assumptions.
ARIMA: Extending AR Models
While AR models work well on stationary data, many financial time series contain trends or seasonality that a basic AR model can’t handle. This is a scenario where Autoregressive Integrated Moving Average (ARIMA) models become useful. ARIMA combines AR components with moving averages (MA) and differencing (I for “integrated”) to account for non-stationary behaviour.
For example, if a stock price has an upward drift, an AR model alone won’t be sufficient. An ARIMA model can first remove the trend through differencing, and then apply AR and MA components to analyse underlying patterns. This makes ARIMA more flexible for complex market environments.
Challenges and Considerations When Using AR Models
Autoregressive models can be useful for analysing price movements, but they come with limitations that traders should consider. Financial markets are complex, and historical price patterns don’t always repeat in the same way. Understanding where AR models fall short might help traders apply them more effectively.
Overfitting and Choosing the Right Lag Order
One of the biggest challenges in using AR models is selecting the right lag order. Including too many past values can lead to overfitting, where the model becomes overly sensitive to historical fluctuations that may not be relevant going forward. Overfitting can create misleading analysis, making the model seem accurate in hindsight but ineffective in real-time market conditions. Traders typically balance complexity with statistical tests like the Akaike Information Criterion (AIC) to determine an optimal lag length.
Market Noise and Unexpected Events
AR forecasting assumes that past price relationships remain relatively consistent. However, financial markets are influenced by a wide range of external factors—economic reports, central bank decisions, and geopolitical events—that models based purely on past prices cannot account for. A market that has historically followed a trend can abruptly reverse due to news or institutional flows, reducing the usefulness of AR-based analysis.
Data Quality and Stationarity
The reliability of an AR model depends on the quality of the data used. Non-stationary data, sudden regime changes, or structural shifts in the market can distort results. Traders often need to check for stationarity and adjust their approach when market conditions change, ensuring that their models remain relevant rather than assuming past relationships always hold.
The Bottom Line
Autoregressive models offer traders a statistical approach to analysing price movements, helping them identify trends and market behaviour based on historical data. While they are not standalone trading signals, they can be valuable when combined with other analytical tools.
FAQ
What Is an Autoregressive Model?
An autoregressive (AR) model is a type of statistical model that analyses time series data by expressing a variable as a function of its past values. It assumes that past observations influence current values, making it useful for identifying patterns in sequential data.
What Is an Autoregressive Model in Finance?
In finance, AR models are used to analyse price movements by examining historical data. Traders apply them to identify trends, momentum, or mean-reverting behaviour in assets like stocks, forex, and commodities. AR models help quantify how past price changes relate to current movements.
What Is an Autoregressive Model for Stock Analysis?
AR models in stock analysis assess price patterns by using historical data to determine potential relationships between past and present values. They can highlight statistical trends but do not account for external market drivers like news or economic events.
This article represents the opinion of the Companies operating under the FXOpen brand only. It is not to be construed as an offer, solicitation, or recommendation with respect to products and services provided by the Companies operating under the FXOpen brand, nor is it to be considered financial advice.
LONG EURUSDHammer Candlestick right at the trendline of H4
Sign of Reversal
Price respect the support of 1.1638
Heading to the test the top again
Take profit at 1.174 -1.177
Goodluck

EURUSD - Swing Trades by QuantsutraExpecting a fall in EURUSD using simple strategy thought and used by Quantsutra Team.
This is how we analyze SWING trades and also Stack up our trades.
will be holding this trade for a week.

Buy idea!Hello all. for completing the correction market needs to go buy again and this is a good zone. be happy(wink)

EUR/USD Exchange Rate Shows Increased VolatilityEUR/USD Exchange Rate Shows Increased Volatility
Powell’s speech on Friday had a distinctly dovish tone. Expectations of an interest rate cut strengthened, which led to a sharp weakening of the dollar — on the EUR/USD chart, a bullish impulse A→B was formed.
On Monday, as often happens after an initial emotional reaction to major news, the price corrected as market participants reassessed prospects in light of the Fed Chair’s softened rhetoric.
What is particularly notable is that the correction was most evident on the EUR/USD chart, where the decline B→C almost completely offset Friday’s surge. This could point to underlying weakness in the euro, which seems justified when considering that the euro index EXY (the euro’s performance against a basket of currencies) has risen by roughly 13% since the beginning of the year.
The EUR/USD rate reacted less strongly to the news that President Trump had decided to dismiss Lisa Cook, a member of the Federal Reserve’s Board of Governors. While the media debates whether the President has the authority to remove her, traders may instead assess how EUR/USD could fluctuate following the A→B→C volatility swing.
Technical Analysis of the EUR/USD Chart
Recently, we outlined a descending channel using the sequence of lower highs and lows observed this summer. The upper boundary clearly acted as resistance for EUR/USD’s rise on Friday.
From the bears’ perspective:
→ the price has broken downward through an ascending trajectory (shown in purple), and the lower purple line has already changed its role from support to resistance (as indicated by the arrow);
→ today’s rebound from the 1.1600 support level appears weak, as highlighted by the long upper shadow on the candlestick;
→ if this rebound is merely an interim recovery following the bearish B→C impulse, it fails to reach the 50% Fibonacci retracement level.
In addition, the B peak only slightly exceeded the previous August high (which resembles a bull trap).
Taking all this into account, we could assume that in the near term we may see bears attempt to break the 1.1600 support level and push EUR/USD towards the median line of the primary descending channel.
This article represents the opinion of the Companies operating under the FXOpen brand only. It is not to be construed as an offer, solicitation, or recommendation with respect to products and services provided by the Companies operating under the FXOpen brand, nor is it to be considered financial advice.

Is it time to reform the EURUSD?
Hi dears
It looks like a head and shoulders pattern has formed which could be a sign of an interesting pullback.
I think we should see the dollar strengthen against its peers over the coming week.
What do you think?
If you like my analysis, just follow my page.

The reason we still have EURUSD bulls in play
If you check my chart I have used the 4HR TF to show the reaction points well. The reason I am maintaining a bullish stance is because of Powell's comments on rate cut. The comments indicated a dovish tone while at the same time signaling uncertainty in the policy rate path. With these comments the dollar still remains at risk. Therefore any sell offs are just retests. The only major event this week is the QGDP which is expected to rise. A higher than expected will only push the pair for retest to the marked levels.

EUR/USD BULLISH TRADE SETUP ON 2HOUR TIMRFRAME,,,,,,,EURUSD (2H) Trade Setup
Entry: 1.1631
Resistance Levels:
R1: 1.1665 – 1.1675
R2: 1.1700 – 1.1710
Targets:
TP1: 1.1700 (+69 pips)
TP2: 1.17418 (+111 pips)
Stop-loss options:
Tight SL: 1.1608 (risk 23 pips)
Wide SL: 1.1585 (risk 46 pips)
---
🔹 Risk–Reward Analysis
Tight SL (1.1608):
TP1 → R:R ≈ 3.0
TP2 → R:R ≈ 4.8
Wide SL (1.1585):
TP1 → R:R ≈ 1.5
TP2 → R:R ≈ 2.4
---
🔹 Technical View
1. Trendline Support: Price has reclaimed upward trade-line, indicating bullish momentum.
2. Cup Formation: Rounded base pattern suggests accumulation and breakout potential.
3. Resistance Test: First challenge is around 1.1670. A clean break opens way to 1.1700.
4. Extension Target: If momentum sustains, price can stretch to 1.1740 supply zone.
---
🔹 Trade Management
Enter at 1.1631 or after a bullish 2H candle close above 1.1650.
Take partial profit at TP1 = 1.1700.
Let rest ride to TP2 = 1.17418.
After TP1 is hit, move SL to breakeven.
Invalidation: A 2H close below 1.1608.
---
✅ Summary (Pro Signal):
EURUSD buy from 1.1631, targeting 1.1700 and 1.17418. Strong R:R (up to 1:4.8) with confirmation from rounded base breakout and trade-line support.

EURUSD | Sell Setup💎MJTrading
FX:EURUSD | Short Bias
🟢 Entry Zone: : Sell @ 1.16071
❌ Stop Loss (SL): 1.16229
🎯 Take Profit (TP) Levels
✅ TP1 → 1.15913
📈 TP2 → 1.15757
💰 TP3 - RR4→ 1.15436
#EURUSD #PriceAction #TechnicalAnalysis #Trading #MJTrading

EUR/USD - Candlestick Trading Introduction DownloadFOR BEGINNERS - THIS IS WHERE YOU START. ✅🎯
I posted this just for those who does not know where to begin learning
in the endless oceans of information regarding trading.
Please download this e-book ASAP and study the BASICS.
I do not know for how long it will remain available for free: 168 Pages
www.scribd.com
I am not affiliated or profiting from this at all.
It's where I started almost 4 years ago.
Keynote:
I see this instrument - EUR/USD is kickstarting a new BULL trend!!

EURUSD | Short Setup | Pending Order💎MJTrading
📸 Viewing Tip:
🛠️ Some layout elements may shift depending on your screen size.
🔗 View the fixed high-resolution chart here:
📝 Trade Setup: FX:EURUSD | Short Bias
Price is respecting the descending channel structure, with the recent rally testing the upper boundary near 1.1660.
🟢 Entry Zone: Pending Order: Sell Stop @ 1.16525
❌ Stop Loss (SL): 1.16643 (channel breakout invalidation)
🎯 Take Profit (TP) Levels
✅ TP1 → 1.16407
📈 TP2 → 1.16289
💰 TP3 - RR4→ 1.16050
#EURUSD #PriceAction #TechnicalAnalysis #Trading #MJTrading
Psychology Always Matters:

EURUSD - Moving towards the upper boundary in the rising channelSince reaching its recent low on August 1st, EUR/USD has been moving within a clear and consistent rising channel on the 4-hour chart. This upward structure has been well respected, with price action repeatedly reacting to both the upper resistance and lower support boundaries. The overall trajectory suggests that buyers have been steadily in control, but current market positioning shows the pair approaching a significant area that could determine the next directional move.
Rising channel
On the 4-hour timeframe, EUR/USD continues to trade inside this well-defined rising channel, with the slope indicating a healthy bullish trend. The price has been making higher highs and higher lows, consistently respecting the boundaries of the channel. At present, EUR/USD is hovering near the midline of this structure, which often acts as a pivot area where momentum can either accelerate toward the channel top or retrace toward its base.
4H FVG resistance
Currently, EUR/USD is facing a strong 4-hour Fair Value Gap (FVG) resistance zone, positioned around the 1.1720–1.1750 region. This supply area is from a sharp sell-off from late July and may act as a significant hurdle for buyers. If this resistance holds, price could be pushed back down toward the lower boundary of the rising channel, possibly testing the 1.1620–1.1650 area. However, if EUR/USD manages to decisively break above this 4H FVG, it would open the door for a continuation toward the upper channel trendline, which currently lies near the 1.1850 level.
Bullish support on the rising channel
Should the 4H bearish FVG remain unbroken, the lower boundary of the rising channel becomes an important support to watch. A pullback toward this zone could provide buyers with a favorable opportunity to re-enter the market. A strong bounce from this support would reinforce the bullish structure and potentially set the stage for another attempt to breach the resistance area, with the aim of resuming the climb toward the channel’s upper limits.
Final thoughts
EUR/USD is in a critical position within its well-structured rising channel. The outcome at the current 4H FVG resistance will likely dictate the next swing. A break above could fuel a run toward the upper channel boundary near 1.1850, while rejection here may see a retracement to the lower channel support before another push higher.
-------------------------
Disclosure: I am part of Trade Nation's Influencer program and receive a monthly fee for using their TradingView charts in my analysis.
Thanks for your support. If you enjoyed this analysis, make sure to follow me so you don't miss the next one. And if you found it helpful, feel free to drop a like 👍 and leave a comment 💬, I’d love to hear your thoughts!

EURUSDthere are chances that price might at this current levels start crawling lower due to this short term dollar strength,

EUR/USD - Bears Continue to DominateHello everyone, do you think FX:EURUSD will rise or continue to fall?
The EUR/USD pair continues to face short-term selling pressure today, with the price recently forming significant resistance levels. At the time of writing, the pair is trading around 1.164.
This movement is largely driven by a combination of technical factors and market sentiment, especially concerns about the global economy, including inflation fears and rising U.S. Treasury yields. These factors have added further downward pressure on the EUR/USD pair.
As seen in the chart, the price is struggling to break the resistance but has been unsuccessful so far. The trendline remains intact, and the bearish momentum may continue. As long as the trendline is protected by the bears, the downward targets will accelerate, with the 1.160 level in sight.
What do you think? Will EUR/USD reverse, or will it continue heading towards the next support target? Let me know your thoughts!

EURUSD: EU IS Strong vs USD Currently. Buy It?Welcome back to the Weekly Forex Forecast for the week of Aug 25 - 29th
In this video, we will analyze the following FX market: EURUSD
The EURUSD is strong. Buy it.
But... be mindful that we are still in corrective territory. The Friday Powell candle notwithstanding, the market has not traded through and closed above the last swing high. Last week's Weekly candle closed within the range of the previous candle. Not a bullish indication. This is the time to be cautious of new trade entries early in the week ahead. Let the market tip its hand before jumping into trades.
The market is more bullish than bearish, and buys on pullbacks are best.
Just be mindful that if a bearish BOS happens, sells will be the highest probability trades to take and hold.
Enjoy!
May profits be upon you.
Leave any questions or comments in the comment section.
I appreciate any feedback from my viewers!
Like and/or subscribe if you want more accurate analysis.
Thank you so much!
Disclaimer:
I do not provide personal investment advice and I am not a qualified licensed investment advisor.
All information found here, including any ideas, opinions, views, predictions, forecasts, commentaries, suggestions, expressed or implied herein, are for informational, entertainment or educational purposes only and should not be construed as personal investment advice. While the information provided is believed to be accurate, it may include errors or inaccuracies.
I will not and cannot be held liable for any actions you take as a result of anything you read here.
Conduct your own due diligence, or consult a licensed financial advisor or broker before making any and all investment decisions. Any investments, trades, speculations, or decisions made on the basis of any information found on this channel, expressed or implied herein, are committed at your own risk, financial or otherwise.

EUR/USD Holding Above 1.1600 — Outlook Remains BullishHi Everyone,
As highlighted in our previous idea, EUR/USD continues to correct above the 1.16000 zone, which could potentially set the stage for a renewed push higher toward the 1.17889 level. Should price extend lower in search of further demand, the next key area of interest sits around 1.15200, where we anticipate strong buying interest to step in.
The impulsive rally from the 1st August low continues to reinforce our bullish outlook on EUR/USD, and upcoming headlines in what looks to be a decisive week could provide the catalyst for the Fiber to press higher.
Our broader outlook remains unchanged: we continue to expect the pair to build momentum for another leg to the upside. A decisive break above 1.17889 would open the path toward the 1.18350–1.19290 area and ultimately the 1.20000 handle.
We’ll be monitoring price action closely to see whether this recovery gains traction and if buyers can sustain momentum through resistance. The longer-term outlook remains bullish, provided price continues to hold above the key support zone.
We’ll keep you updated throughout the week as the structure unfolds and share how we’re managing our active positions.
Thanks again for all the likes, boosts, comments, and follows — your support is truly appreciated!
All the best for the rest of the week.
Trade safe.
BluetonaFX

EURUSD Is it about to experience a big drop??The EURUSD pair has been consolidating under moderate pressure since the June 30 (weekly) High with its 1W RSI basically ranged since April 14.
We have seen this sequence of sideways 1W RSI trading after hitting the overbought (70.00) level another 3 times in the past 8 years. All of those times, the market priced a long-term Top there or shortly after.
In all instances, the first Target was the 1W MA50 (blue trend-line), with the price even going as low as the 0.382 Fibonacci retracement level.
If the Top this time was already priced in June, then we should be expecting a Target of at least 1.1200 on the medium-term, which would be a potential contact with the 1W MA50 and marginally above the 0.382 Fib.
-------------------------------------------------------------------------------
** Please LIKE 👍, FOLLOW ✅, SHARE 🙌 and COMMENT ✍ if you enjoy this idea! Also share your ideas and charts in the comments section below! This is best way to keep it relevant, support us, keep the content here free and allow the idea to reach as many people as possible. **
-------------------------------------------------------------------------------
Disclosure: I am part of Trade Nation's Influencer program and receive a monthly fee for using their TradingView charts in my analysis.
💸💸💸💸💸💸
👇 👇 👇 👇 👇 👇

Gamification People don't trade for money, they trade for other reasons without realising.
Many new traders, start with a point to prove. Although in the crypto space it seems to be "how to turn $100 into a Lambo" The issue is you know the majority of the comments will be from people that are way overleveraged on money they don't have.
Then you have individuals who are successful in another field, and they come to trade, thinking it's easy and they can win here as well.
The market has a way of humbling people quickly.
Gamification is more to do with people who "need to be in the market" - more trades equals more wins and more profits.
The issue is, well at least for most. Is that they dive in without really learning how to manage risk, actually no clue how to manage money properly not just the risk.
I wrote this post back in 2021 - Click it to open.
The psychology part of trading is the biggest thing most people seem to fail to understand.
It isn't just about risk management, it's about how you manage your emotions, the ability to not jump into revenge trades and beyond all of that it's about reading the markets with an appreciation of what the gamers are looking for.
Have you ever lined up a trade, you have your TP and SL mapped out, you have a clear plan - you assume your trading with an edge and you see an expected move like this?
Yet, as soon as you enter you get a run.
You see, when you are too focused on the game, you fail to read the story. Instead, you play each level as it's own map.
I covered a topic of relevance here;
This is about how you can structure the ranges, mechanically and take away the emotions and the guesswork.
When you fail to spot the signs, it's like missing a power up in a game.
The market often leaves behind footprints; these footprints help build a bias and in turn, give you more confirmation for each setup.
In this post, I explained that many new traders go seeking a silver bullet; they look for more data, indicators, screens, and instruments to trade.
I can't stress enough - less is more!!!!
Trading isn't about hoping you can turn your last $500 dollars into a retirement fund. It's about winning big and losing small. Then you refine and adjust so the win rate increases and doing it all again next week, next month, next year.
Now look at that image above and see the obvious when you zoom out.
As clear as day you can see an impulsive move, followed by a corrective move.
Instead of playing the game, try learning the map first.
This will help 100% with your win rate, that will ease your emotional anxiety and put you on the right path.
There are tools available today such as prop firms where you can reduce/limit your exposure, learn to trade as if it's a skill and not a game, and you will surprise yourself!
Stay safe! Have a great week!
Disclaimer
This idea does not constitute as financial advice. It is for educational purposes only, our principal trader has over 25 years' experience in stocks, ETF's, and Forex. Hence each trade setup might have different hold times, entry or exit conditions, and will vary from the post/idea shared here. You can use the information from this post to make your own trading plan for the instrument discussed. Trading carries a risk; a high percentage of retail traders lose money. Please keep this in mind when entering any trade. Stay safe.
