Strong daily supply level in control on EURUSDThere is a strong daily supply level in control on EURUSD the 19th of August 2025. Will the EURUSD drop much further. Hopefully it will.
EURUSD trade ideas

EURUSD: Support & Resistance Analysis For Next Week 🇪🇺🇺🇸
Here is my structure analysis and important supports & resistances
for EURUSD for next week.
Consider these structures for pullback/breakout trading.
❤️Please, support my work with like, thank you!❤️
I am part of Trade Nation's Influencer program and receive a monthly fee for using their TradingView charts in my analysis.

EURUSD Short Setup - Pending Order💎MJTrading
Single Chart Overview:
FX:EURUSD
| Short Bias
📝 Trade Logic and Setup:
Bearish momentum is accelerating with strong downside pressure. Price has rejected the previous low, turning it into resistance. This breakdown setup seeks continuation into deeper liquidity zones, with tight risk management above the invalidation point (above the CLOSE).
🟢 Entry Zone: Pending Order: Sell Stop @ 1.15930
❌ Stop Loss (SL): 1.16643 (channel breakout invalidation)
🎯 Take Profit (TP) Levels
✅ TP1 → 1.15800
📈 TP2 → 1.15666
💰 TP3 - RR4→ 1.17407
Important Note: This order is time sensitive and has a time limit...If the price moves upward, position won't be activated...
Manage Your Risk Wisely...
#EURUSD #PriceAction #TechnicalAnalysis #Trading #MJTrading
Psychology Always Matters:

BUYEUR/USD — Long Setup 💶💵
• Entry: 1.1690 (buy limit)
• Stop: 1.1650
• TP1: 1.1740
• TP2: 1.1810
• R/R: ~1:3 potential
Powell’s dovish tone keeps USD under pressure. Looking for EUR/USD to hold support at 1.1650 and push toward 1.1740/1.1810. Manage risk at 1% per trade. 📈
#EURUSD #Forex #TradingView #TradeSetup

EURUSD: Jackson Hole week The main macro US indicator posted during the previous week was the inflation rate, which stood at 0,2% in July for the month and 2,7% on a yearly basis. Both figures were in line with market expectations. The core inflation remains higher, at 0,3% in July and 3,1% for the year. The Producers Price Index in July was higher by 0,9% compared to the previous month, same as core PPI. The figure was much higher from forecasted 0,2% for the month. At the same time, retail sales in July were higher by 0,5%, and were in line with market estimates. The Industrial Production in July dropped by -0,1%, just a bit under market estimate of 0%. The same indicator stands at 1,4% on a yearly basis. University of Michigan Consumer Sentiment Index preliminary for August reached 58,6, a bit lower from estimated 62. The five years inflation expectations were just a bit corrected to the level of 3,9% from 3,4% posted previously. The same was for inflation expectations for this year, which were modestly increased to 4,9% from 4,5% posted previously.
The ZEW Economic Sentiment Index for August in the Euro Zone was standing at 25,1 a bit lower from estimated 28,1. The same indicator for Germany was at the level of 34,7 again lower from forecasted 40. The wholesale prices in Germany dropped in July by -0,1%, bringing the indicator to the level of 0,5% on a yearly basis. The Industrial Production in the Euro Zone in June dropped by -1,3%, which was higher from expected -1,0%. The second estimate of the GDP Growth rate for Q2 in the Euro Zone was 0,1% for the quarter and 1,4% compared to the previous year.
July US inflation data were in line with market expectations, in which sense, there has been only a mild reaction on financial markets. The eurusd currency pair tested the 1,16 support level at the start of the week, and moved to the higher grounds for the rest of the week. The 1,17 short term resistance line was also tested, while the pair ended the week at 1,1698. Daily lows found the support line at MA50 on a daily chart. At the same time, both MA50 and MA200 are moving as two parallel lines with an uptrend, without an indication of a potential cross in the near future. The RSI was also holding steady between levels of 50 and 56. The indicator still continues to be more oriented toward the overbought market side.
Although the RSI is showing the potential for further move toward the upside in the coming period, still, charts are indicating a modest potential for a short term correction, before the currency pair continues its move toward the upside. As per current charts, there is some probability for 1,16 support to be tested for one more time, and probably level shortly below the supporting level. At this moment, 1,1570 is indicated on charts. On the opposite side, the week ahead will start with testing of 1,17, current resistance, with some potential for a move modestly above this level. Charts are indicating the 1,1770 level.
Important news to watch during the week ahead are:
EUR: Balance of Trade in Euro Zone in June, PPI in July in Germany, Inflation rate final in July in Euro Zone, HCOB Manufacturing PMI Flash in August for Germany and Euro Zone, GDP Growth rate final for Q2 in Germany,
USD: Building Permits preliminary in July, Housing Starts in July, FOMC meeting minutes, Existing Home Sales in July, Fed Chair Powell speech on Friday at the Jackson Hole Symposium.

EURUSD – DAILY FORECAST Q3 | W34 | D22 | Y25📊 EURUSD – DAILY FORECAST
Q3 | W34 | D22 | Y25
Daily Forecast 🔍📅
Here’s a short diagnosis of the current chart setup 🧠📈
Higher time frame order blocks have been identified — these are our patient points of interest 🎯🧭.
It’s crucial to wait for a confirmed break of structure 🧱✅ before forming a directional bias.
This keeps us disciplined and aligned with what price action is truly telling us.
📈 Risk Management Protocols
🔑 Core principles:
Max 1% risk per trade
Only execute at pre-identified levels
Use alerts, not emotion
Stick to your RR plan — minimum 1:2
🧠 You’re not paid for how many trades you take, you’re paid for how well you manage risk.
🧠 Weekly FRGNT Insight
"Trade what the market gives, not what your ego wants."
Stay mechanical. Stay focused. Let the probabilities work.
FX:EURUSD

EURUSD SELLBearish for me im looking for a pull back on the news at 1.30pm gmt for a sell. My stop loss should be 20 pips not as shown

EurUsd shortsFollowing last weeks expansion, I intend shorting this pair to correct the market inefficiencies caused by the institutional move.
First, price took out buyside liquidity which then proceeded to take out the 4h candle high (turtle soup) then gave a market structure shift down.
This confirmation the willingness of price to go down.
Then I set my order at the 2h order block. I got my second entry and price tapped into the first and then repeated what it did on the higher timeframes on the 30m and 1m timeframes.(the picture of the second entry would be in the comments)

EURUSD – buying after the correctionEURUSD remains in an uptrend despite yesterday’s pullback.
The price has tested the support zone and is holding above it.
The main scenario is for price to stay above support and continue higher, aiming for a test of 1,1760 and a potential breakout above recent highs.
We are only looking for entries in the direction of the trend – buying after market confirmation.

EURUSD at a Crossroads: The Battle at the 78.6% Fib LevelMarkets rarely move in a straight line. After a powerful rally was stopped by monthly supply, EURUSD has arrived at a critical crossroads. The higher timeframe trend is still bullish, but a potential daily downtrend is emerging. This analysis focuses on the single high-probability short setup that could define the next major move.
After the price found support at the 50% Fibonacci retracement level of the weekly structure , which coincided with the daily structure's break level, further decline was prevented by negative NFP news last Friday, which pushed the dollar index down. The long scenario from this level, which I detailed in my previous analysis " EURUSD: The Logic of Institutional Capital Unveiled ", is still active. An entry directly from that level was impossible due to the reversal occurring on highly volatile news, but it's still possible from the manipulation zone in the form of the bullish order block below.
This current analysis is a continuation of that one, but from the perspective of looking for short positions , as the price has shown its intention to first reach a zone of interest above. So, let's try to further unravel the logic and the next step of large capital.
The global uptrend of the pair was halted by a monthly supply zone , from which a correction began and subsequently reversed at the 50% weekly level. One might expect the uptrend to continue and only look for long entries. However, the fact that the price found its pivot point in a monthly supply zone and has since shown the potential genesis of a bearish daily structure allows us to consider counter-trend short trades, with fresh footprints from "smart money" to guide us.
On its continued ascent, the price will face resistance in the form of a bearish order block in conjunction with the 78.6% retracement level of the new, potentially bearish structure. Everything will depend on whether this level and order block hold and show a reversal reaction. The entry condition for a short will be the mitigation of this order block concurrently with reaching the 78.6% level, followed by price finding acceptance below it .
► Invalidation: Invalidation of the short scenario would be a break of the 78.6% level with the price finding acceptance above it.
In the case of a short setup forming and an entry being confirmed, the minimum target for the price will be the bullish daily order block below, which was formed during the liquidity sweep of the daily structure's break level.
A key global context for EURUSD to consider upon the mitigation of the daily bearish order block is the Dollar Index (DXY) . After breaking its bearish daily structure (BOS D) to the upside, it also began a correction after NFP. The target and potential reversal zone for DXY is the same as EURUSD's but a mirror image: the 78.6% Fibonacci retracement level in conjunction with a daily order block . It is highly probable that the potential setup formation on these two instruments will occur synchronously. Given their strong inverse correlation, a potential short setup on the euro pair would receive additional confirmation if a long setup forms on the Dollar Index.
~~~~~~~~~~~~~~~~~~~~~~~~~~~~~~~~~~~~~~~~~~~~~~~~~~~~~~~~~~~~~~~~~
The principles and conditions for forming the manipulation zones I show in this trade idea are detailed in my educational publication, which was chosen by TradingView for the "Editor's Picks" category and received a huge amount of positive feedback from this insightful trading community. To better understand the logic I've used here and the general principles of price movement in most markets from the perspective of institutional capital, I highly recommend checking out this guide if you haven't already. 👇
P.S. This is not a prediction of the exact price direction. It is a description of high-probability setup that become valid only if specific conditions are met when the price reaches the marked POI. If the conditions are not met, the setup are invalid. No setup has a 100% success rate, so if you decide to use this trade idea, always apply a stop-loss and proper risk management. Trade smart.
~~~~~~~~~~~~~~~~~~~~~~~~~~~~~~~~~~~~~~~~~~~~~~~~~~~~~~~~~~~~~~~~~
If you found this analysis helpful, support it with a Boost! 🚀
Have a question or your own view on this idea? Share it in the comments. 💬
► Follow me on TradingView for timely updates on THIS idea (entry, targets & live trade management) and not to miss my next detailed breakdown.
~~~~~~~~~~~~~~~~~~~~~~~~~~~~~~~~~~~~~~~~~~~~~~~~~~~~~~~~~~~~~~~~~

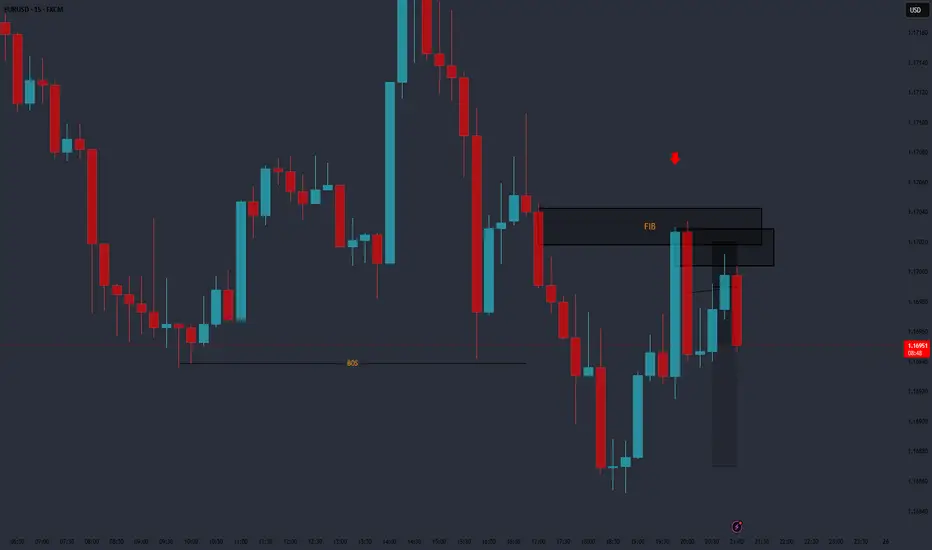
EUR/USD – 15m | Rejection Block Test
Price is consolidating at 1.1645 after MSS recovery. Market is testing a rejection block with both upside and downside paths.
Bullish Scenario:
* Hold above 1.1630–1.1640 zone
* Break 1.1660 rejection block
* Extend toward 1.1698 strong high → 1.1730 P1D high
Bearish Scenario:
* Rejection from 1.1660 block
* Drop below 1.1625 swing low
* Continuation toward 1.1608 rejection block → 1.1580 unmitigated OB
Key Levels:
* 1.1730 (P1D High)
* 1.1698 (Strong High)
* 1.1660 (Rejection Block)
* 1.1625 (Swing Low)
* 1.1608 (Rejection Block)
* 1.1580 (Unmitigated OB)
💬 Will EUR/USD clear the rejection block or dive back to the unmitigated OB?

EURUSD FollowupThe market pushed up way above our expected POI which we were hoping the entry was going to be, we have bought towards the OB ... our sell is still valid , if the market gives us a confluence for a sell at its current price then we react , lets stalk the market
In EU we stand with a sell
DISCLAIMER : This is not financial advice , any monetary risk is sorely personal and l will not be liable for any loss encountered

DeGRAM | EURUSD is testing the support level📊 Technical Analysis
● EUR/USD rebounded sharply from the 1.1590 support zone, breaking above the descending resistance line and confirming a bullish breakout.
● Price is now consolidating above 1.1690, with potential to retest 1.1715 and extend gains toward the 1.1743 resistance.
💡 Fundamental Analysis
● Softer US dollar sentiment followed weaker housing data and dovish Fed remarks, while expectations for the ECB to maintain restrictive rates supported euro strength.
✨ Summary
Long above 1.1590; breakout above 1.1690 confirms upside toward 1.1715 → 1.1743. Invalidation below 1.1590.
-------------------
Share your opinion in the comments and support the idea with a like. Thanks for your support!

EURUSDThe Taylor Rule is a monetary policy guideline developed by economist John B. Taylor in 1992. It provides a formula to help central banks, like the Federal Reserve, determine the optimal short-term interest rate based on economic conditions.
What is the Taylor Rule?
It links the central bank's target interest rate (the federal funds rate in the U.S.) to two key economic factors:
The difference between actual inflation and the central bank's target inflation rate (usually around 2%).
The output gap—the difference between actual economic output (GDP) and the economy's potential output.
The rule suggests that the central bank should raise interest rates when inflation is above target or when the economy is producing above its potential, to cool down inflation and avoid overheating.
Conversely, it advises lowering interest rates when inflation is below target or the economy is underperforming, to stimulate growth.
Why Does It Matter to the Fed in Rate Decisions?
The Taylor Rule provides a systematic, rules-based framework for setting interest rates, enhancing policy predictability and transparency.
It serves as a benchmark for policymakers to assess whether current rates are appropriate, balancing inflation control and economic growth.
The Fed often considers the Taylor Rule when making decisions but does not follow it mechanically, as real-world factors like financial stability and global economic conditions also influence policy.
During periods of deviation from the rule’s recommendation, the Fed may explain why it chose a different path, reflecting discretion and judgment.
The Taylor Rule helps anchor market expectations by providing a reference point for where interest rates "should" be, reducing uncertainty in financial markets.
Basic Taylor Rule Formula
r=p+0.5y+0.5(p−p ∗ )+r ∗
r=nominal federal funds rate (target rate)
p=actual inflation rate
p*=target inflation rate (~2%)
y=output gap (percent difference between actual and potential GDP)
r*=equilibrium real federal funds rate (often assumed to be about 2%)
In simple terms, the Fed should raise or lower rates in response to inflation deviations and output gaps to stabilize the economy.
The Taylor Rule matters because it guides the Fed to pursue a balanced approach—tightening policy when inflation or growth is too high, and easing when the economy slows or inflation falls short—helping to achieve stable prices and sustainable growth.
The Taylor rule also points to a hike
Even when considering the prior data, the Taylor Rule also suggests that the Fed could hike the Federal Funds rate. The Taylor Rule is one of the most reliable tools that the Fed considers for monetary policy action. It's based on the neutral rate, inflation measure, and the resource gap measure.
Since these are not easily measurable variables, the Taylor Rule allows for simulations with different measures. The most common measures are summarized in three scenarios.
Currently, two scenarios put the Federal Funds rate at around 4.25%, which is the bottom range of the current level of the Federal Funds rate, and suggests no cuts or hikes are necessary.
However, Scenario 3 is putting the Federal Funds rate at 5.45%, which suggests that the Fed should hike by around 1% from the current level.
The fact is that the unemployment rate is very low at the full employment level, while inflation has been well above the 2% target for a long time now.
trading is 100% probability ,EURUSD buy gains today could become bearish tomorrow.
trade carefully
#eurusd

Intraday Short EURUSDIntraday Trade Plan for today
Update:
-We are in a controlled downtrend below 1.1645
-Best trades are sell rallies into resistance
-Remember: You don't need to chase-let the price come to you
Sell Zone (Best entry): 1.1620-1.1635
Stoploss: above 1.1650
TP1: 1.1585 (First Liquidity zone)
TP2: 1.1565 (major support/daily target)
Remember to trail stop above 1.1605 once TP1 hit
Keys:
H4: Clear bearish momentum- belove MA, RSI~33 not yet oversold but weak. the trend is still pointing down
H1: Price bounced slightly but still under pressure, trading below all the short/medium MAs. RSI ~33-35= bearish bias but small room for corrective bounce
M30: Show the same bearish channel, but a pause is forming-sellers weak RSI~34
M15: RSI recovering from oversold= suggests small bullish retracement is possible before another drop
M5: Attempting a bounce RSI near 45-50. This is usually where false hop rallies form before bigger moves continue
Goodluck to all of us

EURUSD: Tariff Truce Keeps Bearish PressureBy Ion Jauregui – Analyst at ActivTrades
The EURUSD pair remains in the spotlight following the new trade agreement between the United States and the European Union. ECB President Christine Lagarde confirmed that although tariffs of 15% on most products have been accepted, strategic sectors such as pharmaceuticals and semiconductors remain under heavy uncertainty.
According to the ECB, the effective tariffs will range between 12% and 16%, slightly above expectations but far from the critical scenario of over 20%. From a macroeconomic perspective, the impact appears contained: the Eurozone’s GDP growth forecast for 2025 remains at 1.1%, compared to the 0.7% it would have fallen to without the agreement.
Implications for the euro
Lagarde’s message from Geneva was clear: Europe must diversify its trade partners and reduce its dependence on the U.S. in order to maintain its export strength. In the short term, this deal eliminates the risk of a “full-blown tariff war,” providing some relief to the euro. However, the burden of tariffs in key sectors could continue to weigh on the common currency if competitiveness slows.
Technical analysis of EURUSD
On the daily chart, EURUSD remains in a consolidation range following this week’s declines. The pair is supported near the 1.15270 zone, a relevant support level. As long as this threshold holds, the pair could attempt a rebound towards the 1.18291 highs, where selling pressure from the last bullish impulse is concentrated.
The short-term bias remains sideways-to-bearish: a clear break below 1.13909 would open the door to declines towards 1.12752, while a breakout above recent highs could pave the way to test the psychological barrier of the current range between 1.18291 and 1.13565 per euro. The point of control (POC) is currently around 1.16629. The RSI shows oversold conditions at 44.86%, while the MACD turned negative this week, confirming the sideways-bearish bias.
Stability scenario for Europe
In summary, the trade agreement has succeeded in preventing the worst-case scenario for the Eurozone, providing macroeconomic stability and a degree of confidence in the euro. However, tensions in strategic sectors and the structural dependence on the U.S. remain latent risks. From a technical standpoint, EURUSD stays locked in a range that reflects this duality: apparent fundamental stability, but with a sideways-bearish bias that limits recovery attempts. Unless key resistances are broken, selling pressure will continue to weigh on the pair, forcing investors to keep a close eye on support levels.
Ultimately, the euro is holding up thanks to diplomatic breathing space, but the real battle will be played out on the charts and in Europe’s ability to diversify its trade strategy in the coming months.
*******************************************************************************************
The information provided does not constitute investment research. The material has not been prepared in accordance with the legal requirements designed to promote the independence of investment research and such should be considered a marketing communication.
All information has been prepared by ActivTrades ("AT"). The information does not contain a record of AT's prices, or an offer of or solicitation for a transaction in any financial instrument. No representation or warranty is given as to the accuracy or completeness of this information.
Any material provided does not have regard to the specific investment objective and financial situation of any person who may receive it. Past performance and forecasting are not a synonym of a reliable indicator of future performance. AT provides an execution-only service. Consequently, any person acting on the information provided does so at their own risk. Political risk is unpredictable. Central bank actions can vary. Platform tools do not guarantee success.

Bullish moveEurusd just entered my buy POI
I'm bullish on this after the bullish engulfing candle on the 4hr time frame as a confirmation... Waiting for a retest on the marked zone to ride the trend

ENTRY CRITERIA For this currency pair, I have noticed that the majority of the trading volume occurs during the London session. Therefore, the market often sweeps the highs and lows from previous trading sessions. As you can see, we have the Tokyo high and low formed, and the market is likely to gravitate towards the Asian low. Around 7 a.m. or 8 a.m. London time, it will likely be swept. I assume the previous high will be the target, so I would like to go long today if my entry criteria are met in the lower time frames.


EURUSD ShortEURUSD 4H – Short Setup from Supply Zone
Price is approaching a key supply zone around 1.1746 – 1.1792. This level acted as strong resistance before, leading to a sharp drop, so I’ll be watching for a possible rejection here.
📌 Plan:
Entry: Inside the supply zone (1.1746 area)
Stop Loss: Above zone (1.1792)
Target: 1.1613 support area
The idea is simple: if sellers step in again at this zone, we could see another move lower.
⚠️ Not financial advice – just sharing my setup.


EURUSDEURUSD needs a pullback very soon above the last top before going back up again.
Disclosure: We are part of Trade Nation's Influencer program and receive a monthly fee for using their TradingView charts in our analysis.
