
Fartcoin to the moon again !!!!Fartcoin: Eyeing a Rebound to $1.20 USDT 🤑
🚀🚀🚀
Technical indicators suggest Fartcoin (FARTCOIN/USDT) could be poised for a significant price recovery, potentially reaching $1.20 USDT. After a period of consolidation between $0.95 and $1.05 USDT, signs of accumulation are emerging.
Key Technical Sig

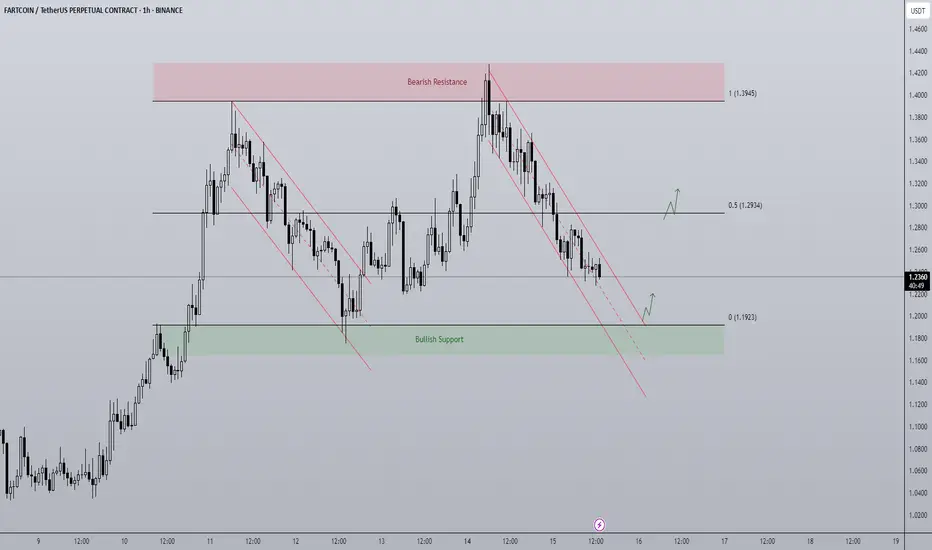
Fartcoin long positionWaiting for retest on the weekly support for entry, Should get a nice bounce from this region.

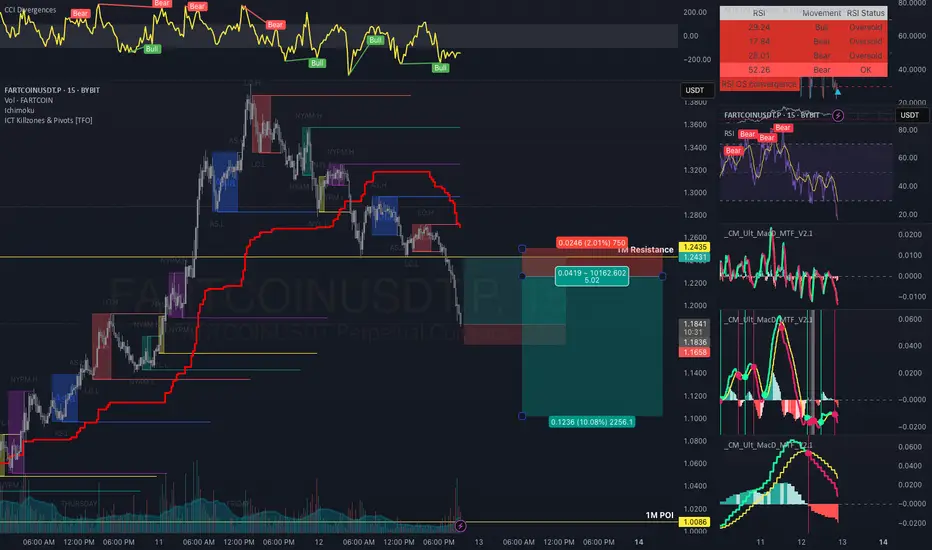
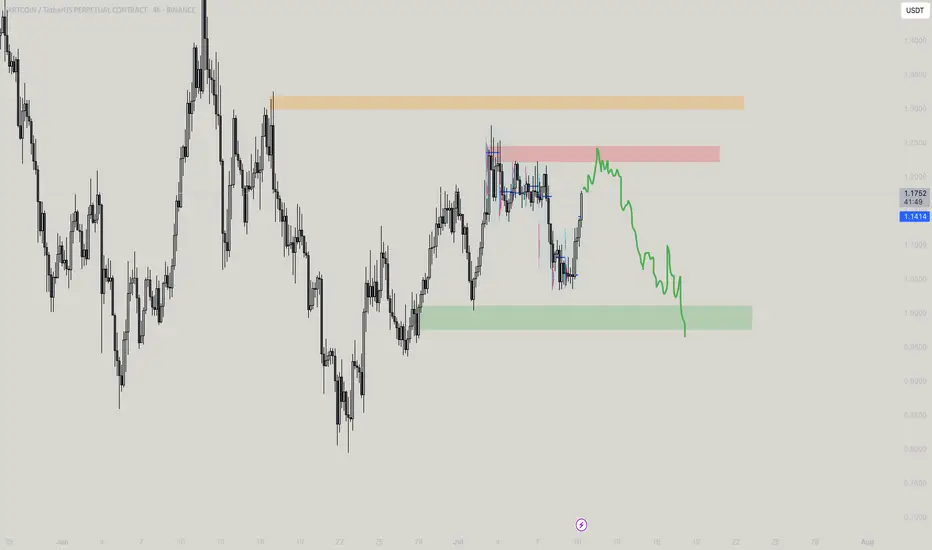
Fartcoin Short SetupWaiting for a bounce and rejection from around 1.22-1.25 before we continue to go down. as we have no reason to long this yet. RSI is not showing any bull divs just yet. but our CCI does. so it simply means that this is the 1st bounce or more of w4/wc corrections
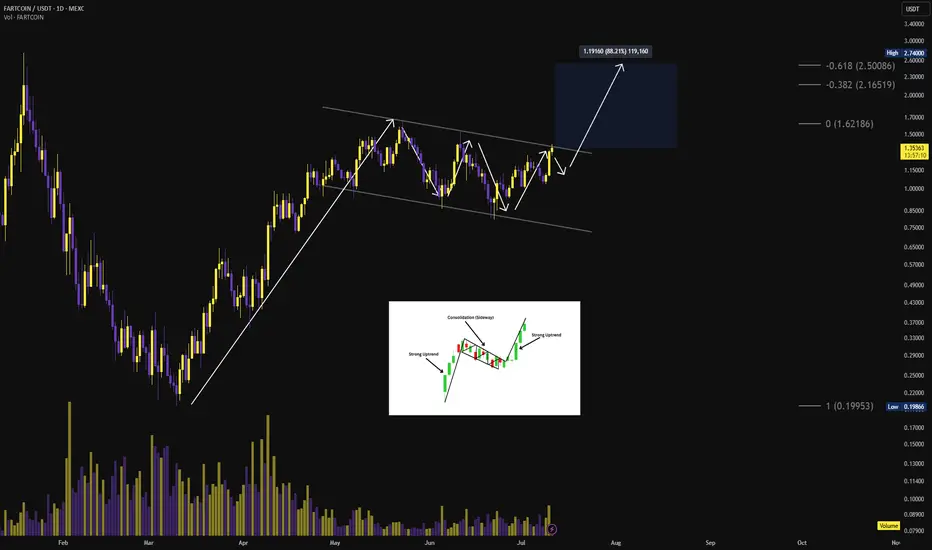
$FART Bull flag can breakout here!🚨 SEED_WANDERIN_JIMZIP900:FART about to rip faces clean off with a bull flag breakout! ⚠️📈
Weeks of consolidation, fakeouts, and shakeouts… and now it’s knocking on the $1.40 breakout level🌪️
Break that line — and we’re heading straight for $2.00, with $2.50 in the crosshairs. 🎯
$FARTCOIN has t
FARTS to SHARTSOkay so as I see this happening, What i have learnt, this is best way to catch all the buyers!

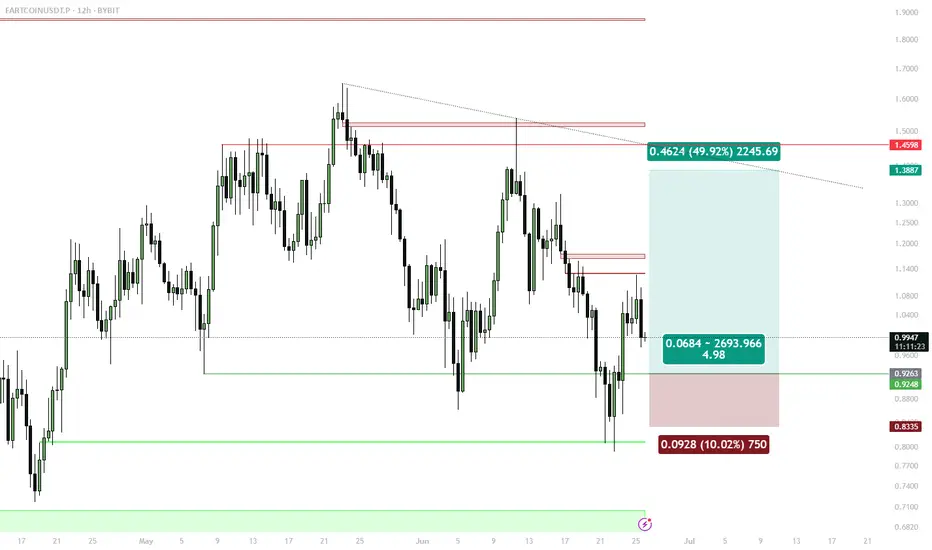
Fartcoin - Rangebound repeat? A BTC makes new highs attention has turned towards altcoins to play catch up.
FARTCOIN has been a top performer of the last month and currently on the 1D timeframe finds itself in a rangebound environment capped between $1.1923 - $1.3945. The end of last week price trended down in a bearish channel
FARTCOIN Swing Long — Reclaimed Support, Bids at Bullish OBSwing Long Setup:
Entries: Limit orders in $0.91–$0.93 (12h OB zone, 1D support)
Stops: 4h close below $0.86–$0.87 (support invalidation)
Targets: $1.16 (first TP), $1.43 (secondary target)
🔔 Triggers & Confirmations:
Only stay in trade if 1D/12h support holds on 4h closes
Re-enter on reclaim i
The MEGA FART SHOWYEs its a fartshow! Okay so got so many DM for ALT's, I am going to write something what I see, As per move, ETH looks strong till $3,200 and except for that all just moved without any heavy institutional moves means volume is just based on Future OI which isnt a perfect move, So i wont comment unl
Time for a short? As you can see, after the price dropped, it made a retracement close to the 0.78 Fibonacci level, and then the market reacted with another downward move.
At the same time, a triangle pattern—or whatever you’d call it—has also formed, which is often considered a continuation pattern, especially in a

See all ideas
Summarizing what the indicators are suggesting.
Oscillators
Neutral
SellBuy
Strong sellStrong buy
Strong sellSellNeutralBuyStrong buy
Oscillators
Neutral
SellBuy
Strong sellStrong buy
Strong sellSellNeutralBuyStrong buy
Summary
Neutral
SellBuy
Strong sellStrong buy
Strong sellSellNeutralBuyStrong buy
Summary
Neutral
SellBuy
Strong sellStrong buy
Strong sellSellNeutralBuyStrong buy
Summary
Neutral
SellBuy
Strong sellStrong buy
Strong sellSellNeutralBuyStrong buy
Moving Averages
Neutral
SellBuy
Strong sellStrong buy
Strong sellSellNeutralBuyStrong buy
Moving Averages
Neutral
SellBuy
Strong sellStrong buy
Strong sellSellNeutralBuyStrong buy
Displays a symbol's price movements over previous years to identify recurring trends.