FARTCOINUSDT trade ideas

Fartcoin to the moon again !!!!Fartcoin: Eyeing a Rebound to $1.20 USDT 🤑
🚀🚀🚀
Technical indicators suggest Fartcoin (FARTCOIN/USDT) could be poised for a significant price recovery, potentially reaching $1.20 USDT. After a period of consolidation between $0.95 and $1.05 USDT, signs of accumulation are emerging.
Key Technical Signals:
•RSI Reversal: The Relative Strength Index (RSI) is showing a bullish reversal, moving up from oversold conditions, indicating waning selling pressure.
•MACD Crossover: A potential bullish crossover on the MACD (Moving Average Convergence Divergence) suggests growing upward momentum.
•Volume Profile: Accumulation within the current range, with buying interest absorbing selling, points to a potential price floor.
•Fibonacci Target: The $1.20 USDT level aligns with a significant Fibonacci retracement point, making it a plausible target if upward momentum continues.A confirmed breakout from the current consolidation, supported by increased buying volume, would strengthen the case for a rally towards the $1.20 USDT mark !!!

Fartcoin long positionWaiting for retest on the weekly support for entry, Should get a nice bounce from this region.

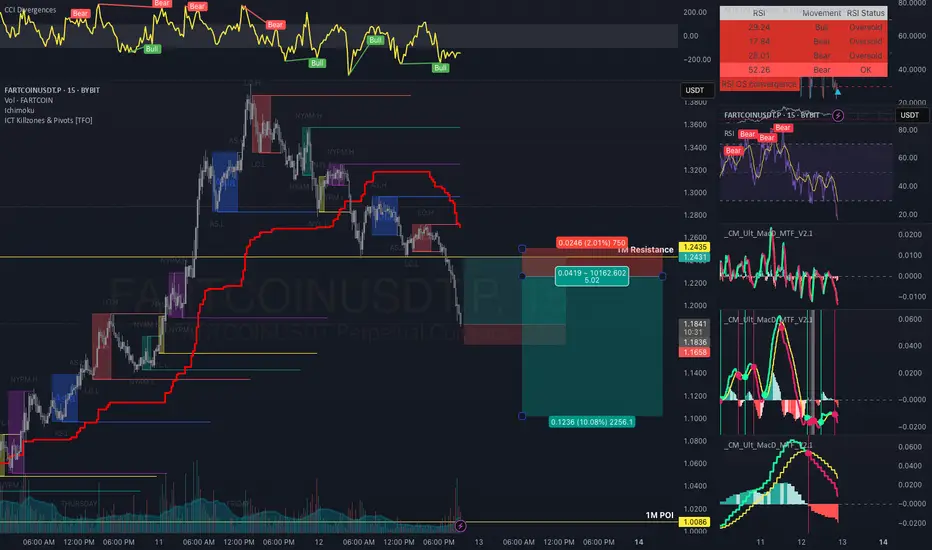
Fartcoin Short SetupWaiting for a bounce and rejection from around 1.22-1.25 before we continue to go down. as we have no reason to long this yet. RSI is not showing any bull divs just yet. but our CCI does. so it simply means that this is the 1st bounce or more of w4/wc corrections
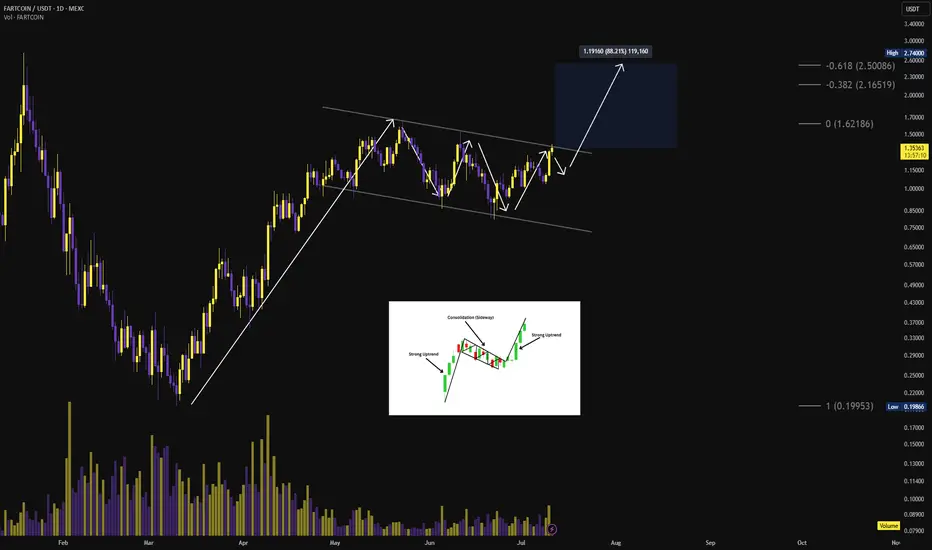
$FART Bull flag can breakout here!🚨 SEED_WANDERIN_JIMZIP900:FART about to rip faces clean off with a bull flag breakout! ⚠️📈
Weeks of consolidation, fakeouts, and shakeouts… and now it’s knocking on the $1.40 breakout level🌪️
Break that line — and we’re heading straight for $2.00, with $2.50 in the crosshairs. 🎯
$FARTCOIN has the structure is textbook. Volume creeping. Momentum building.
#FART isn’t just a meme anymore… it’s a rocket with fuel to burn. 🚀
Time for a short? As you can see, after the price dropped, it made a retracement close to the 0.78 Fibonacci level, and then the market reacted with another downward move.
At the same time, a triangle pattern—or whatever you’d call it—has also formed, which is often considered a continuation pattern, especially in a downtrend. So, there’s a chance the price could drop further.
Personally, I entered a short position at 0.121$, with my take-profit set at 0.8$.

FARTS to SHARTSOkay so as I see this happening, What i have learnt, this is best way to catch all the buyers!

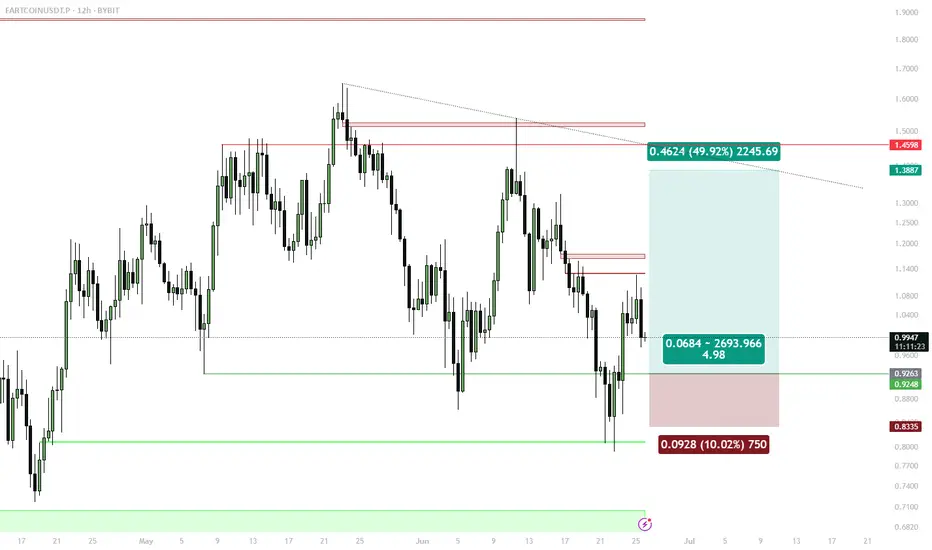
FARTCOIN Swing Long — Reclaimed Support, Bids at Bullish OBSwing Long Setup:
Entries: Limit orders in $0.91–$0.93 (12h OB zone, 1D support)
Stops: 4h close below $0.86–$0.87 (support invalidation)
Targets: $1.16 (first TP), $1.43 (secondary target)
🔔 Triggers & Confirmations:
Only stay in trade if 1D/12h support holds on 4h closes
Re-enter on reclaim if stopped out and structure recovers
🚨 Risk Warning:
Breakdown of reclaimed S/R flips setup invalid — exit on signal
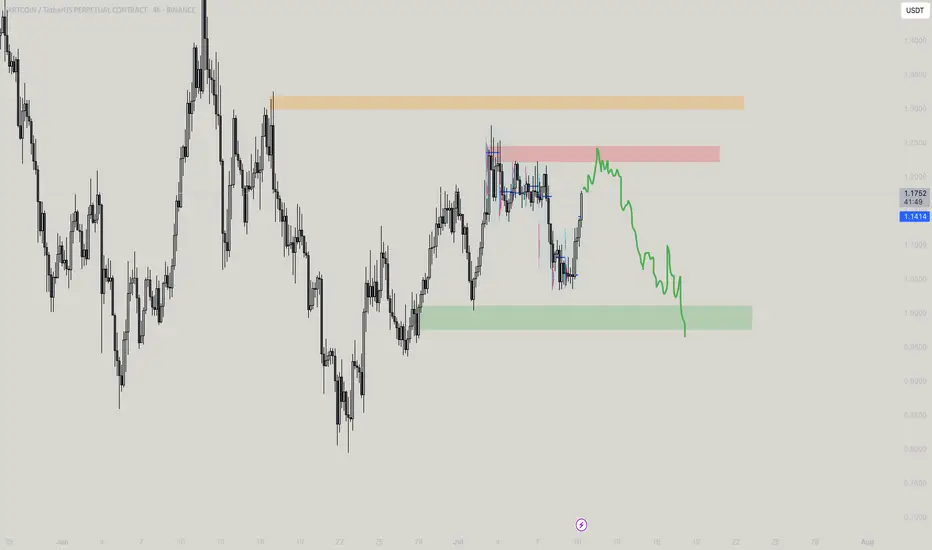
The MEGA FART SHOWYEs its a fartshow! Okay so got so many DM for ALT's, I am going to write something what I see, As per move, ETH looks strong till $3,200 and except for that all just moved without any heavy institutional moves means volume is just based on Future OI which isnt a perfect move, So i wont comment unless full OB forms, but seeing this - You get another huge short oppurtuunity- this fartcoin is having the range marked, it would be a positional short/ and a hold trade as stated if you create position in the red and if it briefly touches the orange box, dont exit! Its the plan you know now!
FART _ You dont realise he farts on us? All day?If you look at this Farts - Comes two perspective here - One - This is retracement, i.e it took all sellers wrecked - took buyers on top and would break the skyblue line and eventually come to the red one - But the fact is - if we see another prespective - We see it can just go up at 1.26 also -- For me I would follow this what I have learnt, And am pretty sure it would retrace back the red box as well in full

Fartcoin Swing Long – 7R Setup in PlayI’m entering a Fartcoin swing long on a golden pocket pullback during a bullish structure continuation, with confluence from EMAs, fibs, and demand volume. The setup is based on the daily chart for trend structure and 1-hour chart for entry timing.
My stop is placed below structural invalidation, and I have two profit targets: one conservative (TP1) and one trend-continuation (TP2).
Entry at $1.15 – Inside the golden pocket (0.618–0.65 fib), where bullish pullbacks often reverse. Confluence with reclaim of daily 50 EMA.
Stop-loss at $1.08 – Below structure and golden pocket. If broken, the setup is invalid and trend may shift.
TP1 at $1.36 – 0.786 fib level and previous local high. Strong resistance and logical partial profit zone. Locks in 3R.
TP2 at $1.64 – Full fib retrace and swing high. If trend continues, this is where momentum likely tops out short term. Gives 7R.
DISCLAIMER: I am not providing trading signals or financial advice. The information shared here is solely for my own documentation and to demonstrate my trading journey. By openly sharing my process, I aim to put pressure on myself to stay focused and continually improve as a trader. If you choose to act on any of this information, you do so at your own risk, and I will not be held responsible for any outcomes. Please conduct your own research and make informed decisions.

FARTCOIN/USDT – 4H Chart Analysis$FARTCOIN is showing strong structure and has broken out of a bullish flag formation on the 4H timeframe. The price is currently holding above the breakout zone, which increases the probability of continuation.
Setup:
Entry: Buy on retest of breakout (~1.20–1.21 zone)
Stop Loss: Below 1.15
Targets:
TP1: 1.25
TP2: 1.35
TP3: 1.53
Support: 1.15
Resistance levels ahead: 1.25 | 1.35 | 1.53
Watch for the retest — it may provide a great second entry opportunity if missed.
DYOR. Not financial advice
#FARTCOIN #CryptoTrading

FARTCOIN – Triangle Pattern Setting Up for a Break
**Pair:** FARTCOIN/USDT
**Timeframe:** 1H
**Pattern:** Symmetrical Triangle
FARTCOIN is consolidating around 1.1820 within a symmetrical triangle on the 1H chart. This structure usually signals a breakout is near — but the direction remains uncertain.
**Bullish Case:**
If the price breaks above the upper trendline with strong momentum, we could see a short-term bullish move.
**Bearish Case:**
If the triangle support breaks down, expect bearish continuation in the short term.
No confirmed move yet. Wait for a clear breakout before entering.

FARTCOIN – Short-Term Reversal SetupPrice consolidating near strong support at 1.1523 with bullish signs emerging.
Key Levels:
Entry: Around 1.1589
Support: 1.1523
Targets: 1.1649 → 1.1698 → 1.1820
As long as 1.1523 holds, this setup favors short-term upside. Break and hold above 1.1649 can lead to stronger momentum.
#DYOR #NFA

Parabolic3 days of rise, broke daily structure, pulled back above vwap , got one lot in and 10% down in half a day


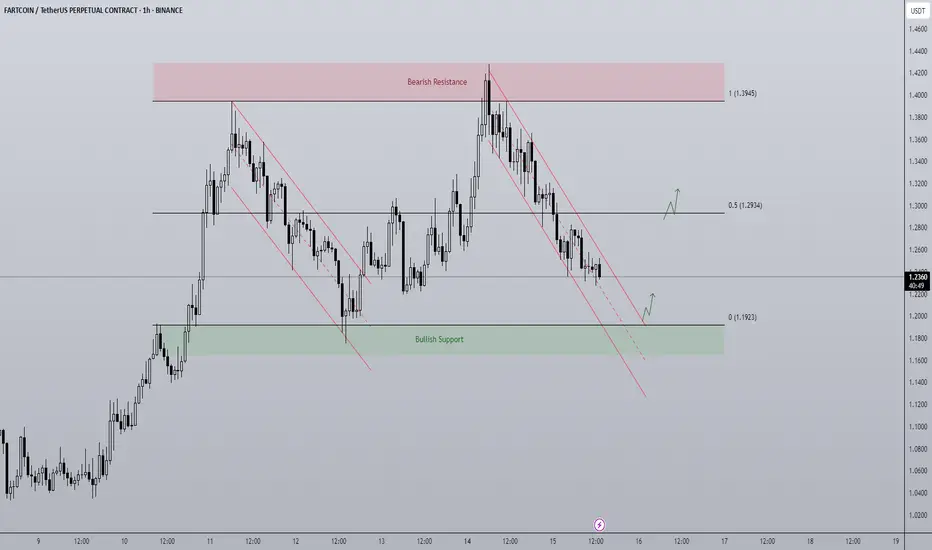
Fartcoin - Rangebound repeat? A BTC makes new highs attention has turned towards altcoins to play catch up.
FARTCOIN has been a top performer of the last month and currently on the 1D timeframe finds itself in a rangebound environment capped between $1.1923 - $1.3945. The end of last week price trended down in a bearish channel from top to bottom and it looks to be doing the same currently. As the supply zone above the range high got swept, price printed a SFP getting back inside the range and began trending down, for me there are two actionable long entries here:
- A range low bounce + breakout of trend channel would be an ideal long entry. An area of clear support coupled with a breakout is a historically strong setup with a clear invalidation if price breaks below the range and gets accepted.
- A more aggressive but potentially less ideal setup would be a breakout of the downtrend before hitting range lows. Higher risk as the level of support is not as defined but in the more risk-on environment crypto is currently in, the chance of major support levels being front run does go up as buyers become more impatient when FOMO grows.
The midpoint is key level to look out for too as a reclaim would mean a run at the highs, rejection opens the door to retest the lows.

FARTCOIN — Choppy Zone, Support Buy Setup1. Choppy price action likely until sale is done
2. Buy on retest and bounce from 1D support ($0.90)
3. Only long above support, stop below $0.90

Dribble Farts - Smell like rosee!So this fart smells like rose i sniffed! Just let the move come down, hodl it, look after the caution line!

FARTCOIN — Perfect Swing Long Up 27%, Dips Are for BuyingDips into $1.06–1.09 (1H FVG + BOS) are for buying.
Still bullish while above $0.92–0.93 OB. Eyeing $1.43 next.

Have you heard a trumpet FARTS?So yeah that would sound amazing, but this sound is like he boasts yeah man come i am giving you free money LOLOLOL

Fart isnt deadly anymore!Just a smol notion on how things work! This can make or break though shall break up, but for me ideal is break down and up!
